Price Action and Key Levels
Timeframe: 4-hour (ZROUSDT.4h).
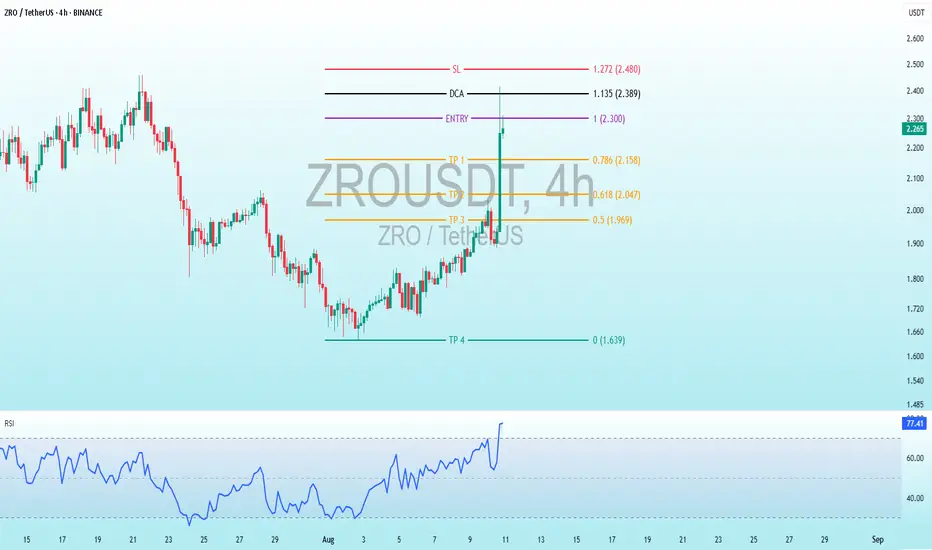
Current Price: As of the latest candle, the price appears to be around 2.292 USDT (based on the right-side price scale).
Historical Movement: The chart shows a significant downtrend from early July, followed by a recovery and recent consolidation around the 2.0–2.5 USDT range.
Support and Resistance:
SL (Stop Loss): Marked at 1.127 USDT (red line), indicating a potential exit point if the price drops further.
DCA (Dollar-Cost Averaging): Set at 2.389 USDT (black line), suggesting a level for additional buying.
Entry: Two entry levels are marked at 2.300 USDT (purple line) and 2.389 USDT (green line), indicating planned buy zones.
Take Profit (TP) Levels:
TP1: 0.786 (2.158 USDT, orange line).
TP2: 0.618 (2.047 USDT, orange line).
TP3: 0.5 (1.969 USDT, orange line).
TP4: 0.169 (1.649 USDT, green line).
These levels likely represent Fibonacci retracement or extension levels, with TP1–TP3 showing potential profit targets and TP4 a deeper support.
RSI Analysis
Indicator: The Relative Strength Index (RSI) is plotted at the bottom, with a scale from 0 to 100 and overbought (70) and oversold (30) levels marked.
Current RSI: Around 78.30, indicating the asset is in overbought territory as of the latest data point (late August).
Trend: The RSI has been rising sharply, suggesting strong bullish momentum, but the overbought condition may signal a potential reversal or consolidation soon unless supported by further price action.
Observations
The price is currently above the entry levels and near the TP1 zone, suggesting a profitable position if entered at the lower levels.
The overbought RSI could indicate a risk of a pullback toward the DCA or TP2 levels (around 2.0–2.1 USDT).
The chart reflects a trading strategy with predefined entry, exit, and profit-taking levels, likely based on technical analysis (e.g., Fibonacci or support/resistance).
Conclusion
The ZRO/USDT pair shows a recovery from its earlier lows, with the price nearing profit-taking zones and an overbought RSI suggesting caution. Monitoring for a potential pullback or breakout above current levels would be key.
Note
TP 1 FILLED
+6.35% PROFIT
✅MY Free Signals Telegram
t.me/AltcoinPiooners
✅Personal Telegram (Premium)
t.me/Altcoin_Piooners
✅YouTube
youtube.com/@AltcoinPiooners
t.me/AltcoinPiooners
✅Personal Telegram (Premium)
t.me/Altcoin_Piooners
✅YouTube
youtube.com/@AltcoinPiooners
Disclaimer
The information and publications are not meant to be, and do not constitute, financial, investment, trading, or other types of advice or recommendations supplied or endorsed by TradingView. Read more in the Terms of Use.