Pattern & Structure
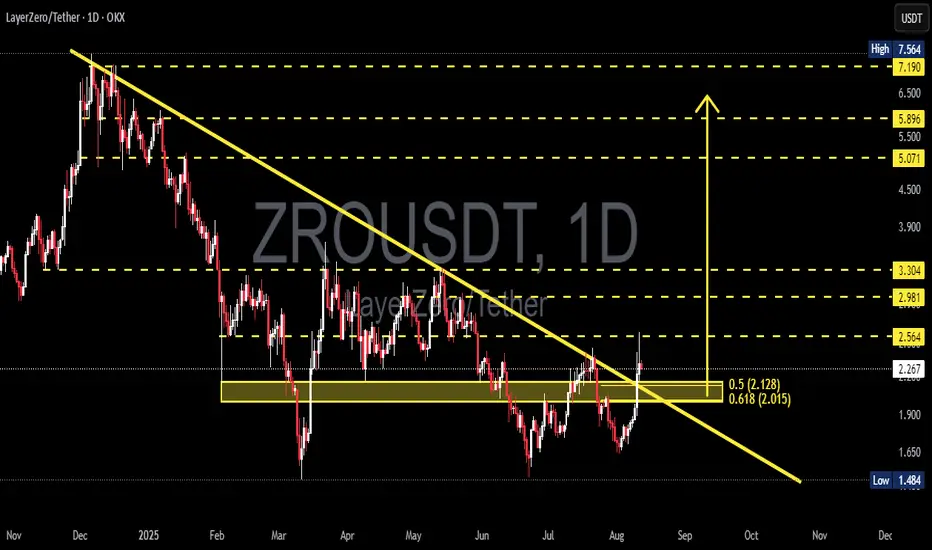
Medium-term trend: Clear downtrend since late last year (yellow diagonal line) with multiple touch points, making it a valid resistance line.
Breakout: Daily candle has closed above the downtrend line and above the yellow box (previous resistance zone). This is an early signal that medium-term selling pressure is weakening.
Golden Fibonacci zone: The yellow box marks the 0.5 = 2.128 and 0.618 = 2.015 retracement levels. This area acted as a supply/resistance and now becomes a potential retest zone (resistance turning into support).
Key horizontal levels (dashed lines):
Near-term: 2.564
Mid-term: 2.981, 3.304
Higher targets: 5.071, 5.896 (major resistance near 7.19)
Major structural low: 1.484
---
Bullish Scenario (if confirmed)
Main confirmation: Sustained daily close above the trendline + yellow box, ideally followed by upward continuation or a successful retest.
Possible target sequence:
First target: 2.564 → ~+12.8% from 2.273
Mid targets: 2.981 → +31.15%, then 3.304 → +45.36%
If momentum continues, possible extension toward 5.071 / 5.896 (>100% from current price).
Extra bullish sign: A retest of the yellow box (2.015–2.128) holding as support and forming higher lows.
---
Bearish Scenario (if failed)
Bearish invalidation trigger: Strong rejection in the breakout zone, followed by daily close back below the 0.5–0.618 range.
Downside risk levels:
Failed retest → drop to 2.128 (−11.4%).
Break below 2.015 → next major support 1.484 (~−34.7% from 2.273).
Losing the trendline + box would likely resume the downtrend.
---
Technical Notes
Breakout validation is key — one daily candle above is not enough, look for 1–3 days of follow-through or a clean retest.
Volume confirmation (not shown in this chart) is important; strong volume = stronger breakout.
Clear invalidation level: Below 0.618 (~2.015). Strong invalidation = 1.484.
Always consider overall crypto market sentiment to avoid false breaks.
---
> ZRO/USDT — Daily breakout from downtrend. Price broke above trendline and Fibonacci 0.5–0.618 (2.128–2.015). Confirmed retest = bullish; failed retest could send price back to 1.48. Not financial advice.
> Structure: Multi-month downtrend (yellow line) has just been broken. The yellow box = Fibonacci 0.5 (2.128) & 0.618 (2.015) cluster — now a key zone.
Bullish: Confirmed close above trendline + retest → targets at 2.564 (+12.8%), 2.981 (+31.2%), 3.304 (+45.4%).
Bearish: Rejection in this zone → back to 2.128 / 2.015 (−6% / −11%), and if broken → 1.484 (−34.7%).
Watch breakout validation, volume, and manage risk. Not financial advice.
#ZRO #ZROUSDT #crypto #cryptocurrency #TA #TechnicalAnalysis #Fibonacci #Breakout #Trendline #Altcoin #SupportResistance
✅ Get Free Signals! Join Our Telegram Channel Here: t.me/TheCryptoNuclear
✅ Twitter: twitter.com/crypto_nuclear
✅ Join Bybit : partner.bybit.com/b/nuclearvip
✅ Benefits : Lifetime Trading Fee Discount -50%
✅ Twitter: twitter.com/crypto_nuclear
✅ Join Bybit : partner.bybit.com/b/nuclearvip
✅ Benefits : Lifetime Trading Fee Discount -50%
Disclaimer
The information and publications are not meant to be, and do not constitute, financial, investment, trading, or other types of advice or recommendations supplied or endorsed by TradingView. Read more in the Terms of Use.