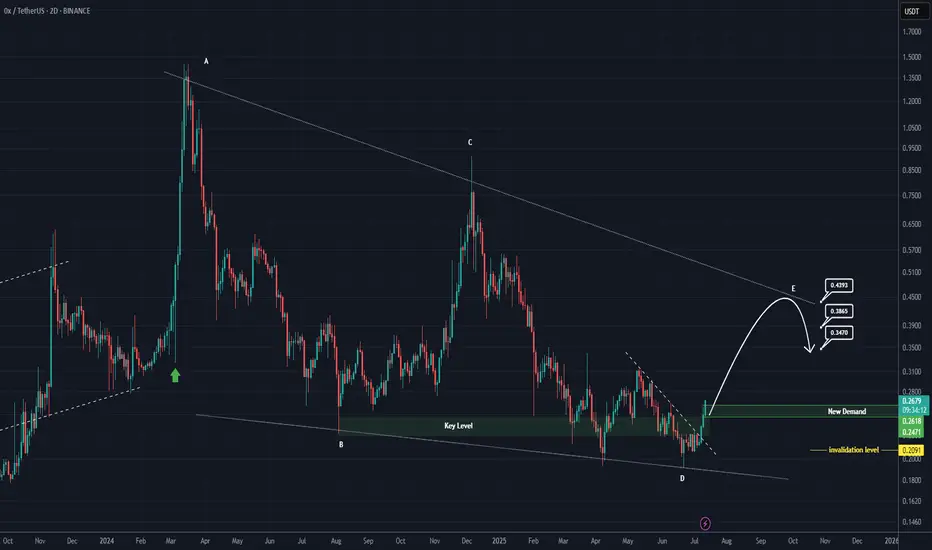
From the point where we placed the red arrow on the chart, it appears that a triangle is forming.
Now, considering the formation of a double bottom at the low and the break of the bearish trendline, it seems that the price is ready to complete wave E of this triangle.
As long as the new demand zone holds, the bullish move can continue.
The targets are marked on the chart.
A daily candle closing below the invalidation level will invalidate this analysis.
For risk management, please don't forget stop loss and capital management
When we reach the first target, save some profit and then change the stop to entry
Comment if you have any questions
Thank You
🔆To succeed in trading, just enter our Telegram channel:
Free membership: t.me/Behdark_EN
🔷Our Telegram channel has daily spot and futures signals 👉 t.me/Behdark_EN
💎 Exclusive signals are only shared on our Telegram channel
Free membership: t.me/Behdark_EN
🔷Our Telegram channel has daily spot and futures signals 👉 t.me/Behdark_EN
💎 Exclusive signals are only shared on our Telegram channel
Disclaimer
The information and publications are not meant to be, and do not constitute, financial, investment, trading, or other types of advice or recommendations supplied or endorsed by TradingView. Read more in the Terms of Use.