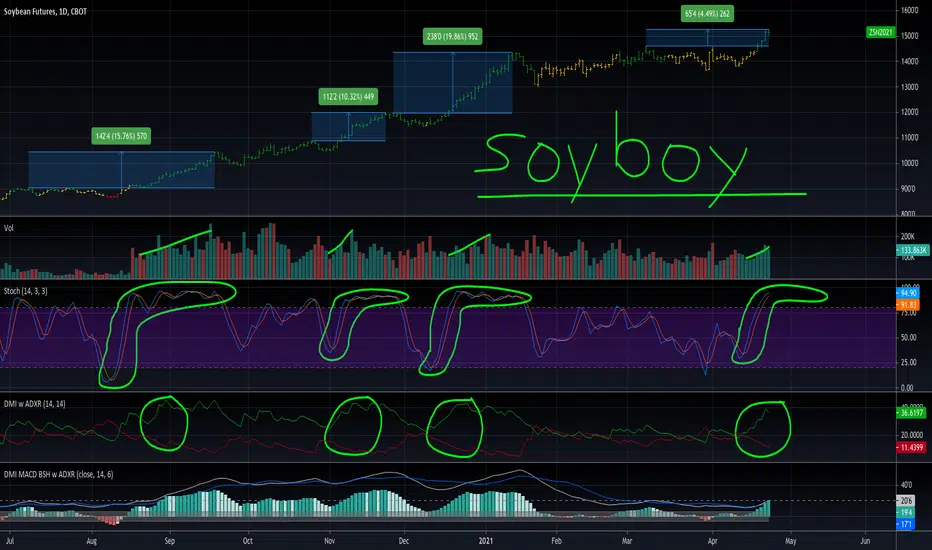
This recent breakout in soy has similarities to previous moves which have gained a lot more than this one currently has in terms of percentage gain and cents/bushel gain. These differences are noted on the top price chart.
Indicator Similarities:
Volume increasing after making a new high
Stochastic shooting up from below 50 without pause into overbought territory
Directional Movement Index achieving a large spread between +DM and -DM
The bottom indicator is a custom pine script indicator that shows the ADX (white), ADXR (blue), and the spread of the +DM and -DM in histogram format. The price chart colorization is based on this spread being above (green), inside (yellow), or below (red) the gray box which is a zone that makes sense from a historical-performance standpoint. One concern I have is that the ADXR level is low and ideally it would be above 20 which is the dotted line. The good news is that it is quickly rising and the first breakout from last August which is the most important one started with a similar setup.
Trade active
Soy made a new high, was rejected by 1600' which can be expected. Dollar closed below trendline support in a decisive manner. Corn is outperforming soy a lot, not sure why that is. I'm hoping soy starts catching up to corn in terms of percentage gain since the 2020 bottom in the weeks ahead.Long July soy since April 23rd at 1515', current price: 1589'6
Note
I closed with a profit mainly because corn looks really weak and I am worried soy will follow. Also, the soy chart is showing a lot more weakness than I'm comfortable with. Sell price 1588'Disclaimer
The information and publications are not meant to be, and do not constitute, financial, investment, trading, or other types of advice or recommendations supplied or endorsed by TradingView. Read more in the Terms of Use.
Disclaimer
The information and publications are not meant to be, and do not constitute, financial, investment, trading, or other types of advice or recommendations supplied or endorsed by TradingView. Read more in the Terms of Use.