🌾 Section 1: The Wheat–Weather Connection—Or Is It?
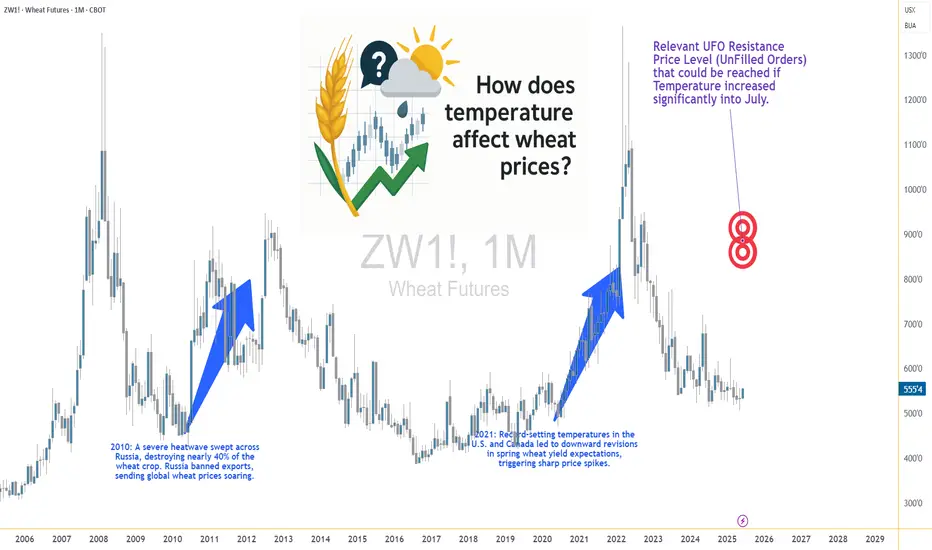
If there’s one crop whose success is often tied to the weather forecast, it’s wheat. Or so we thought. For decades, traders and analysts have sounded the alarm at the mere mention of a heatwave in key wheat-producing regions. The logic? Excessive heat during the growing season can impair wheat yields by disrupting pollination, shortening the grain-filling period, or damaging kernel development. A tightening supply should lead to price increases. Simple enough, right?
But here’s where the story takes an unexpected turn.
What happens when we actually analyze the data? Does heat reliably lead to price spikes in the wheat futures market? The short answer: not exactly. In fact, our statistical tests show that temperature may not have the consistent, directional impact on wheat prices that many traders believe it does.
And that insight could change how you think about risk, seasonality, and the role of micro contracts in your wheat trading strategy.
📈 Section 2: The Economics of Wheat—And Its Role in the Futures Market
Wheat isn’t just a breakfast staple—it’s the most widely grown crop in the world. It’s cultivated across North America, Europe, Russia, Ukraine, China, and India, making it a truly global commodity. Because wheat is produced and consumed everywhere, its futures markets reflect a wide array of influences: weather, geopolitics, global demand, and speculative positioning.

The Chicago Board of Trade (CBOT), operated by CME Group, is the main venue for wheat futures trading. It offers two primary wheat contracts:
Standard Wheat Futures (ZW)
Micro Wheat Futures (MZW)
These micro contracts have transformed access to grain futures markets. Retail traders and smaller funds can now gain precise exposure to weather-driven moves in wheat without the capital intensity of the full-size contract.
🌡️ Section 3: Weather Normalization—A Smarter Way to Measure Impact
When analyzing weather, using raw temperature values doesn’t paint the full picture. What’s hot in Canada might be normal in India. To fix this, we calculated temperature percentiles per location over 40+ years of historical weather data.
This gave us three weekly categories:
Using this approach, we grouped thousands of weeks of wheat futures data and examined how price returns behaved under each condition. This way, we could compare a “hot” week in Ukraine to a “hot” week in the U.S. Midwest—apples to apples.
🔄 Section 4: Data-Driven Temperature Categories and Wheat Returns
To move beyond anecdotes and headlines, we then calculated weekly percent returns for wheat futures (ZW) for each of the three percentile-based categories.
What we found was surprising.
Despite common assumptions that hotter weeks push wheat prices higher, the average returns didn’t significantly increase during high-temperature periods. However, something else did: volatility.
In high-temp weeks, prices swung more violently — up or down — creating wider return distributions. But the direction of these moves lacked consistency. Some heatwaves saw spikes, others fizzled.
This insight matters. It means that extreme heat amplifies risk, even if it doesn't create a reliable directional bias.

Traders should prepare for greater uncertainty during hot weeks — an environment where tools like micro wheat futures (MZW) are especially useful. These contracts let traders scale exposure and control risk in turbulent market conditions tied to unpredictable weather.
🔬 Section 5: Statistical Shock—The t-Test Revelation
To confirm our findings, we ran two-sample t-tests comparing the returns during low vs. high temperature weeks. The goal? To test if the means of the two groups were statistically different.
This result is counterintuitive. It flies in the face of narratives we often hear during weather extremes.
However, our volatility analysis (using boxplots) showed that variance in returns increases significantly during hotter weeks, making them less predictable and more dangerous for leveraged traders.
🧠 Section 6: What Traders Can Learn from This
This analysis highlights a few key lessons:
This article is part of a growing series where we explore the relationship between weather and agricultural futures. From corn to soybeans to wheat, each crop tells a different story. Watch for the next release—we’ll be digging deeper into more effects and strategies traders can use to capitalize on weather.
When charting futures, the data provided could be delayed. Traders working with the ticker symbols discussed in this idea may prefer to use CME Group real-time data plan on TradingView: tradingview.com/cme/ - This consideration is particularly important for shorter-term traders, whereas it may be less critical for those focused on longer-term trading strategies.
General Disclaimer:
The trade ideas presented herein are solely for illustrative purposes forming a part of a case study intended to demonstrate key principles in risk management within the context of the specific market scenarios discussed. These ideas are not to be interpreted as investment recommendations or financial advice. They do not endorse or promote any specific trading strategies, financial products, or services. The information provided is based on data believed to be reliable; however, its accuracy or completeness cannot be guaranteed. Trading in financial markets involves risks, including the potential loss of principal. Each individual should conduct their own research and consult with professional financial advisors before making any investment decisions. The author or publisher of this content bears no responsibility for any actions taken based on the information provided or for any resultant financial or other losses.
If there’s one crop whose success is often tied to the weather forecast, it’s wheat. Or so we thought. For decades, traders and analysts have sounded the alarm at the mere mention of a heatwave in key wheat-producing regions. The logic? Excessive heat during the growing season can impair wheat yields by disrupting pollination, shortening the grain-filling period, or damaging kernel development. A tightening supply should lead to price increases. Simple enough, right?
But here’s where the story takes an unexpected turn.
What happens when we actually analyze the data? Does heat reliably lead to price spikes in the wheat futures market? The short answer: not exactly. In fact, our statistical tests show that temperature may not have the consistent, directional impact on wheat prices that many traders believe it does.
And that insight could change how you think about risk, seasonality, and the role of micro contracts in your wheat trading strategy.
📈 Section 2: The Economics of Wheat—And Its Role in the Futures Market
Wheat isn’t just a breakfast staple—it’s the most widely grown crop in the world. It’s cultivated across North America, Europe, Russia, Ukraine, China, and India, making it a truly global commodity. Because wheat is produced and consumed everywhere, its futures markets reflect a wide array of influences: weather, geopolitics, global demand, and speculative positioning.
The Chicago Board of Trade (CBOT), operated by CME Group, is the main venue for wheat futures trading. It offers two primary wheat contracts:
Standard Wheat Futures (ZW)
- Contract Size: 5,000 bushels
- Tick Size: 1/4 cent per bushel (0.0025) has a $12.50 per tick impact
- Margin Requirement: Approx. $1,700 (subject to change)
Micro Wheat Futures (MZW)
- Contract Size: 500 bushels (1/10th the size of the standard contract)
- Tick Size: 0.0050 per bushel has a $2.50 per tick impact
- Margin Requirement: Approx. $170 (subject to change)
These micro contracts have transformed access to grain futures markets. Retail traders and smaller funds can now gain precise exposure to weather-driven moves in wheat without the capital intensity of the full-size contract.
🌡️ Section 3: Weather Normalization—A Smarter Way to Measure Impact
When analyzing weather, using raw temperature values doesn’t paint the full picture. What’s hot in Canada might be normal in India. To fix this, we calculated temperature percentiles per location over 40+ years of historical weather data.
This gave us three weekly categories:
- Below 25th Percentile (Low Temp Weeks)
- 25th to 75th Percentile (Normal Temp Weeks)
- Above 75th Percentile (High Temp Weeks)
Using this approach, we grouped thousands of weeks of wheat futures data and examined how price returns behaved under each condition. This way, we could compare a “hot” week in Ukraine to a “hot” week in the U.S. Midwest—apples to apples.
🔄 Section 4: Data-Driven Temperature Categories and Wheat Returns
To move beyond anecdotes and headlines, we then calculated weekly percent returns for wheat futures (ZW) for each of the three percentile-based categories.
What we found was surprising.
Despite common assumptions that hotter weeks push wheat prices higher, the average returns didn’t significantly increase during high-temperature periods. However, something else did: volatility.
In high-temp weeks, prices swung more violently — up or down — creating wider return distributions. But the direction of these moves lacked consistency. Some heatwaves saw spikes, others fizzled.
This insight matters. It means that extreme heat amplifies risk, even if it doesn't create a reliable directional bias.
Traders should prepare for greater uncertainty during hot weeks — an environment where tools like micro wheat futures (MZW) are especially useful. These contracts let traders scale exposure and control risk in turbulent market conditions tied to unpredictable weather.
🔬 Section 5: Statistical Shock—The t-Test Revelation
To confirm our findings, we ran two-sample t-tests comparing the returns during low vs. high temperature weeks. The goal? To test if the means of the two groups were statistically different.
- P-Value (Temp Impact on Wheat Returns): 0.354 (Not Significant)
- Conclusion: We cannot reject the hypothesis that average returns during low and high temp weeks are the same.
This result is counterintuitive. It flies in the face of narratives we often hear during weather extremes.
However, our volatility analysis (using boxplots) showed that variance in returns increases significantly during hotter weeks, making them less predictable and more dangerous for leveraged traders.
🧠 Section 6: What Traders Can Learn from This
This analysis highlights a few key lessons:
- Narratives aren’t always backed by data. High heat doesn’t always mean high prices.
- Volatility increases during weather stress. That’s tradable, but not in the way many assume.
- Risk-adjusted exposure matters. Micro wheat futures (MZW) are ideal for navigating weather-driven uncertainty.
- Multi-factor analysis is essential. Weather alone doesn’t explain price behavior. Global supply chains, speculative flows, and other crops’ performance all play a role.
This article is part of a growing series where we explore the relationship between weather and agricultural futures. From corn to soybeans to wheat, each crop tells a different story. Watch for the next release—we’ll be digging deeper into more effects and strategies traders can use to capitalize on weather.
When charting futures, the data provided could be delayed. Traders working with the ticker symbols discussed in this idea may prefer to use CME Group real-time data plan on TradingView: tradingview.com/cme/ - This consideration is particularly important for shorter-term traders, whereas it may be less critical for those focused on longer-term trading strategies.
General Disclaimer:
The trade ideas presented herein are solely for illustrative purposes forming a part of a case study intended to demonstrate key principles in risk management within the context of the specific market scenarios discussed. These ideas are not to be interpreted as investment recommendations or financial advice. They do not endorse or promote any specific trading strategies, financial products, or services. The information provided is based on data believed to be reliable; however, its accuracy or completeness cannot be guaranteed. Trading in financial markets involves risks, including the potential loss of principal. Each individual should conduct their own research and consult with professional financial advisors before making any investment decisions. The author or publisher of this content bears no responsibility for any actions taken based on the information provided or for any resultant financial or other losses.
🌟 Take This Analysis Further with Our AI Scripts 🎯 | Discover How at tradewithufos.com 🚀 Choose a Subscription: Monthly ᴼᴿ Yearly ᴼᴿ Lifetime 🗓️ | Unlock Intelligent UFO Scripts Free 💡
Related publications
Disclaimer
The information and publications are not meant to be, and do not constitute, financial, investment, trading, or other types of advice or recommendations supplied or endorsed by TradingView. Read more in the Terms of Use.