Search in ideas for "zAngus"
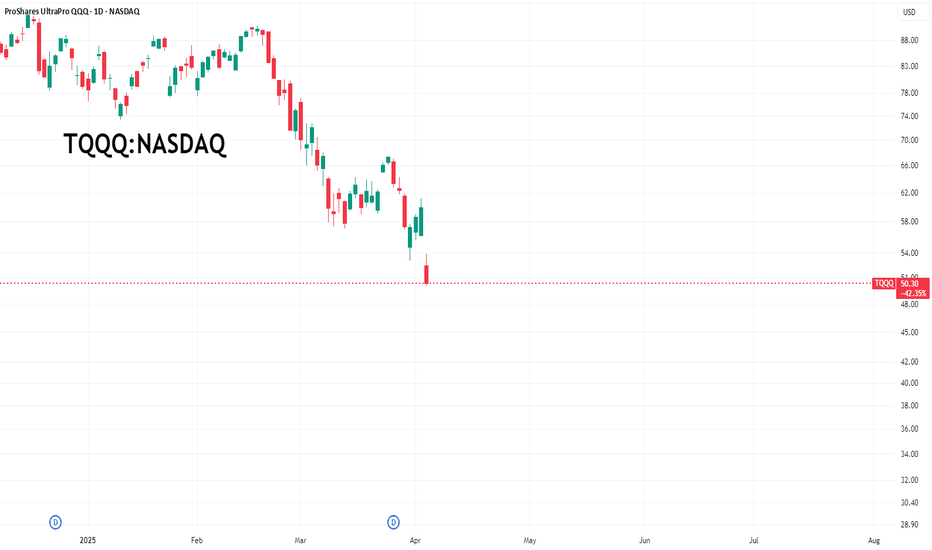
Short-Term Gamble on a NASDAQ Bounce Using TQQQIn this quick update, I’m taking a speculative short-term trade on a possible NASDAQ recovery after a steep sell-off. Was the market oversold—at least for a day? Maybe. Do I think the pain is over for the longer term? Probably not.
I’m using NASDAQ:TQQQ , a 3x leveraged ETF that tracks the NASDAQ-100 (the top 100 non-financial stocks in the NASDAQ). This means if the index moves up 2%, TQQQ should theoretically gain roughly 6%, and vice versa on the downside. Leveraged ETFs like this are high-risk, time-sensitive instruments—they’re designed for short-term trades, not buy-and-hold investing.
The idea here is that after a sharp drop, institutions might step in to scoop up oversold tech stocks, creating a brief rebound. If that happens, TQQQ could give me amplified upside. But this is purely a gamble—I’m under no illusion that the market has bottomed. In fact, I expect more downside ahead.
I entered in the after-hours session once some of the heavy bearish volume faded, and I’ve set a tight 5% stop-loss to manage risk. Yes, I could get shaken out by an early dip before any rebound, but the stop is there to protect me if the sell-off continues.
This is a high-risk, short-term trade—buyer beware. If you’re considering TQQQ, understand the risks: decay from daily resetting leverage, extreme volatility, and the potential for rapid losses.
I’ll update on how this plays out. Wish me luck in the comments below 😁
Real question is where to take profit...
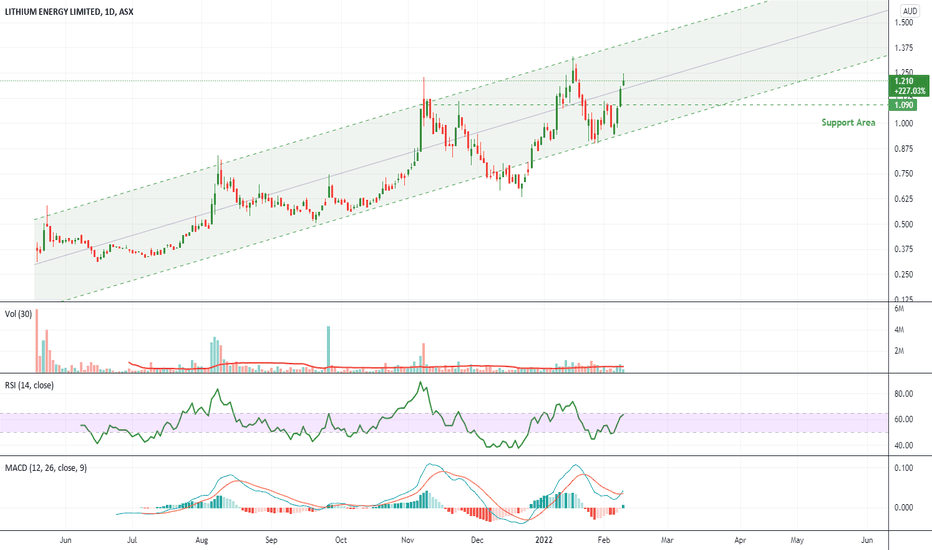
How To: Using Parallel Lines To Look For Entries Or Swing TradeSometimes it can be hard to see visually where the current price might be in terms of a longer term trend and whether the price might be at the top or the bottom (or the middle) of its range.
Depending on how you trade, you might want to dive in and look for a short term opportunity, or you might want to wait a little while for a bigger pullback and take a longer position on the stock.
Some of you might even want to wait until it gets closer to the top of the range and take a short position expecting it will go down.
Swing traders can use parallel channels as a really useful tool to take both sides of the trade as the stock goes up and down inside its channel.
In this video you will be able to see how to:
1. Add a parallel line / channel to your charts.
2. Add a horizontal support or resistance line to your chart and modify it.
3. Set an alert to notify you when the stock price might be crossing through these areas and send you a message.
Hopefully useful to some of you. Give it a thumbs up if it was :)
Angus.
Covid Cure Runners - Where the Smart Money is moving.Well, Pfizers news yesterday of a Corona vaccine with 90% efficiency was received well by the market sending the Dow through the roof and heavily punishing the stay-at-home / work-from-home stocks that have been keeping us all entertained for the last 6-8 months. As per the video, it all feels a bit too soon, but there does seem to have been a big sell off of the tech stocks, and you can see the smart (and retail) money moving into the heavily beaten up areas like airlines, cruises, casinos, and complimentary businesses like hotels and resorts where a lot more value and potential upside remains.
I thought I'd cover examples of some of the stocks in each of these areas and suggest possible ways outside of the TradingView Screener for you to find additional stocks in these spaces that might also be running, as well as how to look at what an ETF is made up of. You could choose to trade the ETF which is a container of like-themed stocks, or pick the best individual stocks and seek to outperform the ETF.
The video includes examples of some US as well as Australian stocks, but the idea will work for any markets. As always do your own research. None of these should be considered any kind of recommendation, they were just names I pulled out of my memory without having done any research. The whole market could turn upside down and inside out again tomorrow on different news :)
What do you think. Was the timing of the news just lucky coincidence or delayed conspiracy ;)
Hope it's useful. Enjoy.
Demo: SuperTrail - 5 minute candle and 5% trail on a 1500% stockCouple of people have asked if they can use the SuperTrail indicator to day trade and the answer is yes so figured I'd make this video showing how it would work on a smaller time frame on a more volatile stock.
How I look for quick second and third day wins off breakouts.Was going through looking for stocks I'll watch on Monday morning and thought I'd make a video to share how I do it.
These stocks might go up and they might go down so do your own due diligence.
I'm guessing and wont act until I see which way they are going.
Conservative Stock Ideas 21st MarchJust some stock ideas for more conservative type portfolios. Always do your own research. I haven't looked at announcements, news, market depth etc which I would do before I spent any of my money on these. Like everyone else - I am simply guessing :)
Score 1 best, 2 good, 3 watch
BEST
AMI - 1 (might be over extended - be careful)
CHC - 1 (might be over extended - be careful)
GOOD
STO - 2 - Watch resistance area
DXS - 2 - Needs to break above resistance
GPT - 2 - Might have a bit more downside before turn around. Needs to break resistance.
NCM - 2 - Choppy but might be good short to medium term
RIO - 2 - Like to see it break above 98
MGR - 2 - Like to see it close above 2.75
VVR - 2 - Bit choppy. Worth a look
WATCH
GMG - 3 - Good chart but rolling over. Need to watch for resumption of upward movement.
SAR - 3 - Might be recovering.
CWY - 3 - Watch
NST - 3 - Personally I think it might be at the bottom of a swing if it moves back up might be a great time to buy but the TA sites dont like it currently. Have a look on a 5 year chart.
BHP - 3 - Resistance area. Would like to see it above $38.50
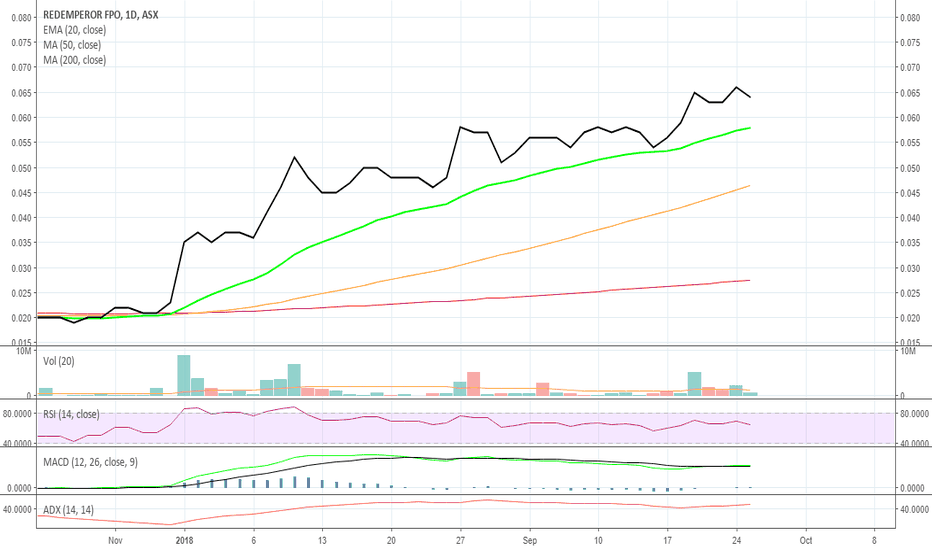
ASX: RMP - Red Emperor ResourcesJust my thoughts on RMP. Might be worth a look. As always see what your own charting says. I'm just guessing :)
If you see something different - please do comment.
Bought today at 0.063
I see support at: 0.061
I set a falling sell at: 0.06 to trigger down to a worst case 0.058 sell.
I'm long momentum trading so I don't set a profit target. I just wait until the trend / momentum looks like it is ending.
Will switch to a 15% trailing sell to ride the trend once its up around 5-10% or sell.
If it spikes > 10-20% in a single day then I tend to put a new falling sell up close at new support levels to keep any profit.
Red Emperor Resources NL is engaged in oil and gas exploration. The Company's principal activities are focused on identifying and exploring oil and gas in South East Asia and the Republic of Georgia. Its segments include Georgian Exploration & Evaluation; Philippines Exploration & Evaluation and Treasury. The Company has projects located in South East Asia and Georgia. The Company in South East Asia has entered into a Farmin Agreement with Otto Energy Philippines Inc. to farm into the prospective offshore Philippines Block, Service Contract 55 (SC55). Its SC55 is located in the southwest Palawan Basin and covers an area of approximately 9,880 square kilometers. Its Georgia project is located in the Republic of Georgia and covers an area of approximately 6,500 square kilometers. Its Philippines operations include Hawkeye-1 exploration well, which is drilled to the depth of approximately 2,920 meters with the reservoir intersected at approximately 2,710 meters.
ASX RNO might be worth a look.After a bit of a sell of after it posted its most resent results it looks like RNO might be recovering and worth a closer look
ASX:FGFQuick video on FGF which is showing some signs of good volume coming through, but it is up against a historical resistance / reversal point. Can it break it ???
