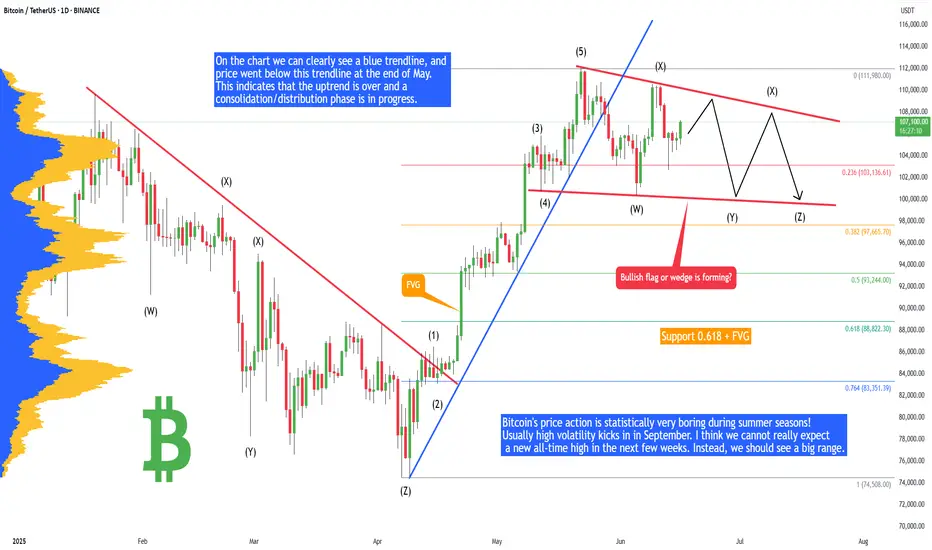
Bitcoin - Plan for summer 2025 (no new ATH, big range!)Bitcoin's price action is statistically very boring during summer seasons! Usually high volatility kicks in in September. I think we cannot really expect a new all-time high in the next few weeks. Instead, we should see a big range. Why? Let's take a look at technical analysis.
On the chart we can clearly see a blue trendline, and price went below this trendline at the end of May. This indicates that the uptrend is over and a consolidation/distribution phase is in progress. This phase is usually represented as a bull flag, triangle, rectangle, or wedge. When we look at the current price action, it looks like a bullish flag consolidation pattern. In this case we will probably see multiple liquidity sweeps below the previous swing lows to kick out early longs.
There are 2 types of traders. The first one they love to trade ranges, and the second they love to trade breakouts and higher volatility environments. Currently I think Bitcoin is creating a range, so do not expect any crazy movements until this range is valid.
Bullish flags are usually bullish patterns, but often they break down and act like bearish patterns. So what would happen if this bullish flag breaks down? That would send the price of Bitcoin to the 0.618 FIB, which is at 88,882 USDT. What is this bullish flag breaks out? That would send the price of Bitcoin to 116,000 to 125,000, but to establish this price we first need to see low of the bull flag, which is not confirmed yet. I will definitely inform you in one of my next analyses, so write a comment with your altcoin + hit the like button, and I will make an analysis for you in response.
At the end of each post, I share my professional trading tips: "If you realize you’ve made a poor trading decision, exit before the stop loss forces you out." Trading is not hard if you have a good coach! This is not a trade setup, as there is no stop-loss or profit target. I share my trades privately. Thank you, and I wish you successful trades!
Community ideas
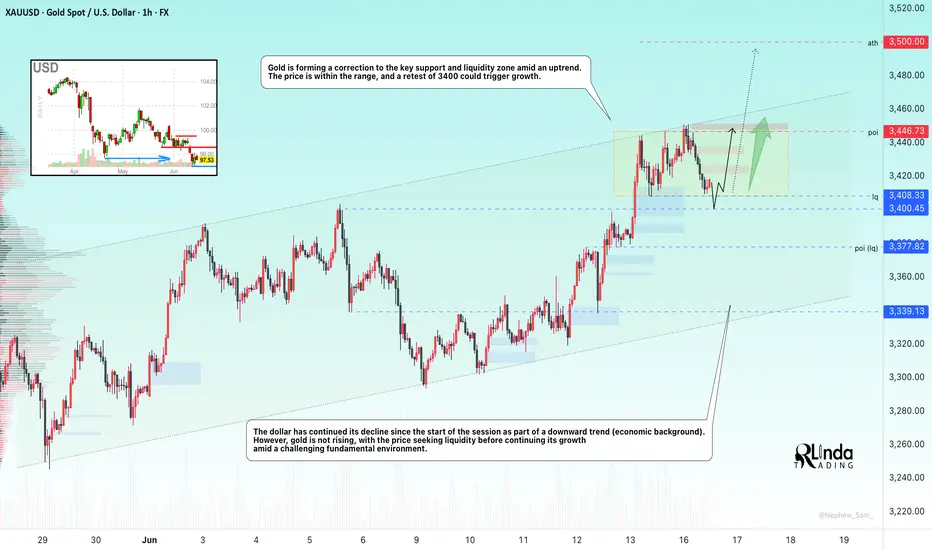
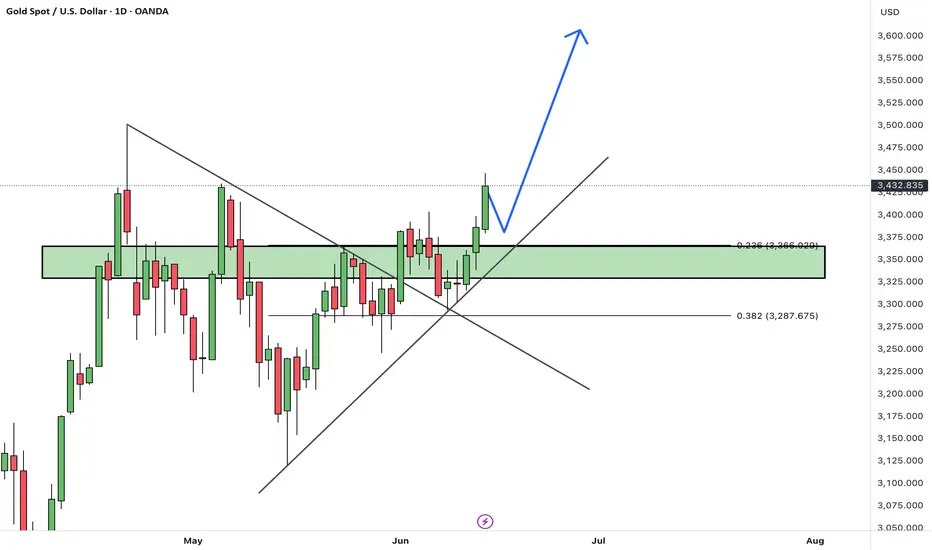
GOLD → Hunting for liquidity before continued growthFX:XAUUSD has been correcting since the start of the session. The fundamental background is complicated due to the escalation of the conflict in the Middle East.
The price of gold briefly retreated from a two-month high above $3,450 amid a recovery in the dollar and investor caution. Escalating tensions between Israel and Iran are dampening risk appetite, while markets await decisions from the Fed and the Bank of Japan. Expectations of a dovish Fed continue to support interest in gold, but fresh impetus is needed for further gains.
Technically, the market is bullish. Gold is forming a correction to the key support and liquidity zone amid an uptrend. The price is within the range, and a retest of 3400 could trigger growth.
Support levels: 3408, 3400
Resistance levels: 3446, 3500
A retest of support and liquidity capture amid the current challenging situation (high interest in the metal) and a bullish trend could support the price, allowing gold to continue its growth.
Best regards, R. Linda!
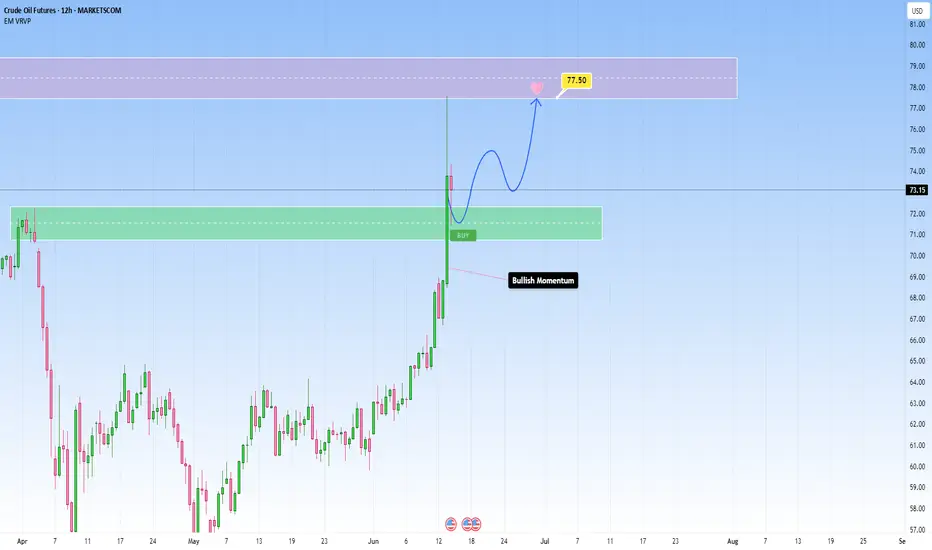
Positive market: OIL rises sharply - Important area to watch forThe recent escalation of tensions in the Middle East has had a strong ripple effect across all commodities market. Just as we observed with Gold, it’s no surprise we’ve seen oil prices climb as well, given this uncertainty.
If you’ve seen my latest Gold analysis, you’ll understand how market sentiment has turned uneasy, and in times like these are what people trust when everything else feels risky. And naturally, with everything going on, Gold is seeing stronger demand again, and I expect the price to steadily climb and reach new highs because the momentum is unmistakable.
On Friday the 13th, oil prices spiked abruptly before pulling back slightly, showing just how sensitive the market is to potential supply disruptions. What’s fueling this rally is obvious, and it’s the fear around supply from such an important oil-producing area. This creates a great opportunity to take a position.
As you can see in my analysis, the price has recently broken above a key resistance zone and may come back for a retest. If this level holds as support, it would really confirm the bullish bias and make the move towards my anticipated target of 77,50 high probability, towards the next resistance zone level at 77,50 and 79,50.
If the price remains over this support zone, my bullish outlook stays the same. But, if it doesn’t hold above this level we could see a slight pullback before another definitve move up.
In such times, it’s important to watch price action closely especially near key technical levels, and let the market show your next move.
GOLD's rise has been steady, decisive move aheadGold is the focus, plain and simple. We’re in an ascending channel, and price is respecting that structure with precision, higher highs, and no major signs of exhaustion yet.
Recently a clear resistance level was just taken out, and now I am watching for the classic retest. That breakout? A big deal, and a strong clue as well. If that zone holds as support, that’s a green light for a potential upmove toward 3,460 which matches the top of the channel.
But if it fails, we could expect a slight pullback, it might mean we could be in for a healthy dip before the next move.
Bottom line: follow the structure, and don’t force trades here without confirmation first

XAUUSD Hello Traders! 👋
What are your thoughts on GOLD?
Gold has broken above a major resistance level, and price has closed firmly above this zone, signaling strong bullish momentum and a shift in market sentiment.
We expect a brief pullback in the short term, followed by a resumption of the upward move toward higher targets and new highs.
As long as price remains above the identified support level, the bullish outlook remains valid.
Is gold ready for its next leg up after the pullback? Share your thoughts below! 🤔👇
Don’t forget to like and share your thoughts in the comments! ❤️
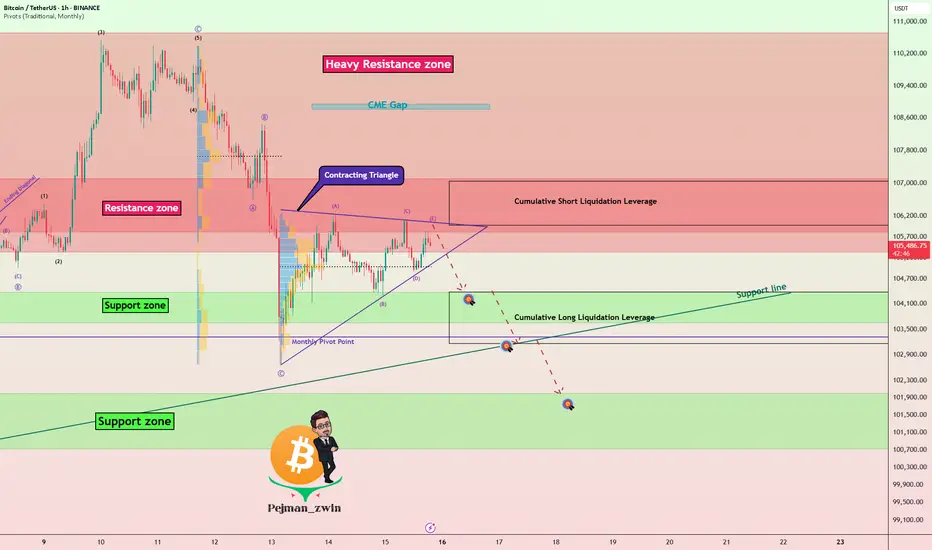
Geopolitical Tensions & Technical Pattern Point to BTC Decline!Bitcoin ( BINANCE:BTCUSDT ) fell about -5% after tensions between Israel and Iran escalated. Unfortunately , these tensions are still escalating, but Bitcoin has managed to recover about +3% so far.
Bitcoin is moving near the Resistance zone($107,120-$105,330) and Cumulative Short Liquidation Leverage .
In terms of Elliott Wave theory , it seems that Bitcoin is completing a corrective wave . The corrective wave structure could be Contracting Triangle . In case of a sharp decline in Bitcoin again, we can consider these waves as five descending waves (if Bitcoin does NOT touch $106,600 ).
I expect Bitcoin to start declining again and at least drop to the Support zone($107,120-$105,330 ). The second Target could be the Support line and Cumulative Long Liquidation Leverage .
Note: If Bitcoin can break the Resistance zone($107,120-$105,330), we can expect further increases in Bitcoin.
Please respect each other's ideas and express them politely if you agree or disagree.
Bitcoin Analyze (BTCUSDT), 1-hour time frame.
Be sure to follow the updated ideas.
Do not forget to put a Stop loss for your positions (For every position you want to open).
Please follow your strategy and updates; this is just my Idea, and I will gladly see your ideas in this post.
Please do not forget the ✅' like '✅ button 🙏😊 & Share it with your friends; thanks, and Trade safe.
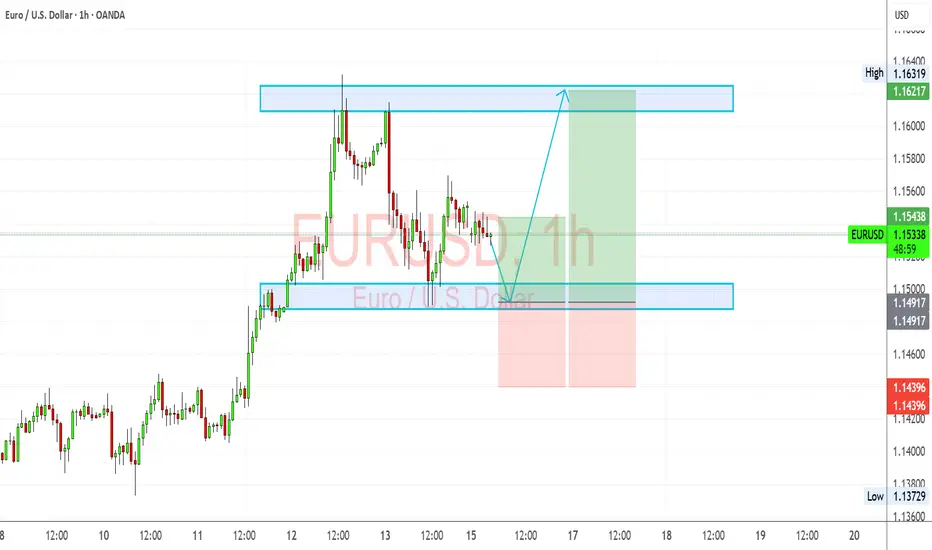
EURUSD Long Setup – Bullish Rejection from Demand ZoneEURUSD remains supported by strong eurozone fundamentals and broad USD softness. The pair has retraced into a key demand zone around 1.1490 and is showing signs of bullish rejection. With the Fed likely to pause further rate hikes and the ECB maintaining a steady tone, the bias favors further upside toward recent highs.
⚠️ Geopolitical tensions in the Middle East (Israel-Iran conflict) have introduced mild safe haven demand, but so far the USD has underperformed versus the euro, suggesting EUR remains relatively insulated.
Watch for confirmation and entries within the blue demand box.
🔍 Technical Analysis:
Structure: Clear uptrend with higher highs and higher lows. Price retraced to a well-defined 1H demand zone between 1.1490–1.1500.
Setup: Anticipating a bounce from the demand zone targeting the recent high near 1.1620–1.1630.
Entry Zone: 1.1490–1.1500 (bullish reaction area)
Target: 1.1620–1.1630 (previous supply zone)
Stop Loss: Below 1.1439 (recent swing low)
Risk-Reward Ratio: Approximately 1:2.5
🧠 Fundamental Context (as of June 16):
EUR Bias: Bullish – ECB has paused cuts; euro is resilient despite geopolitical headwinds.
USD Bias: Bearish – Fed is on pause; soft inflation data and geopolitical risks weigh on dollar strength.
Key Drivers:
Fed dovish tone (FOMC pause, lower CPI)
Strong EU resilience despite global tensions
CHF and JPY attracting safe haven flows over USD
📅 Key Events to Watch:
US Core PCE (next major inflation readout)
FOMC commentary and Fed speakers
Eurozone CPI and sentiment data
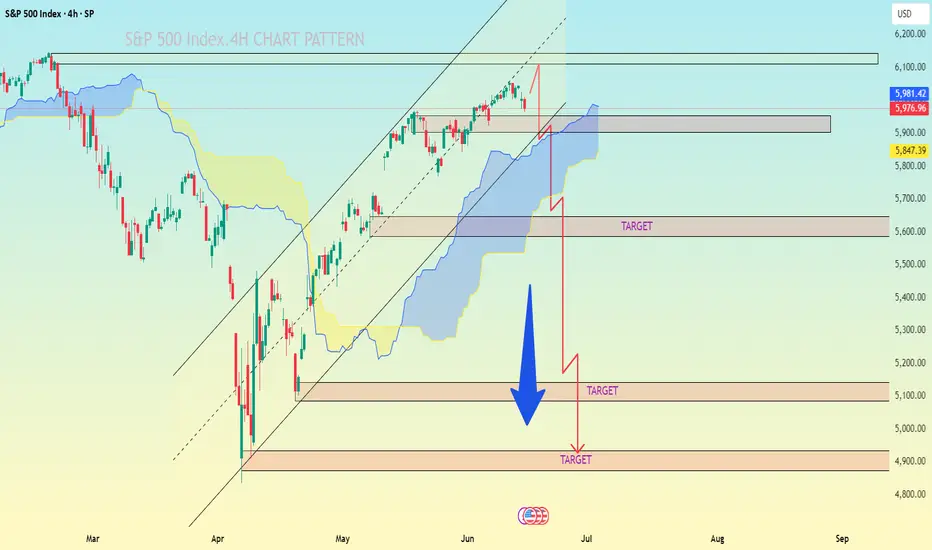
S&P 500 Index.4H CHART PATTERN.the S&P 500 Index (4H timeframe), it appears you're using a combination of Ichimoku Cloud, trend channels, and support/resistance zones to project downside targets. Here's the breakdown of your marked targets:
📉 Bearish Targets:
1. Target 1: Around 5,500
2. Target 2: Around 5,200
3. Target 3: Around 4,950–4,900
---
🔍 Technical Observations:
Price has broken below the upward trend channel.
It's entering the Ichimoku Cloud, signaling potential consolidation or bearish pressure.
The large blue downward arrow indicates a bearish expectation, possibly tied to macro/fundamental concerns or technical reversal patterns.
The grey resistance block near 5,960–6,000 suggests failed breakout/retest.
---
📌 Summary:
If current bearish momentum continues:
✅ Immediate Target: 5,500 (first major support)
⚠ Medium Target: 5,200
🔻 Final Target Zone: 4,900–4,950 (strong previous support and fib zone)
Let me know if you want stop-loss ideas, confluence indicators, or entry strategy breakdowns!
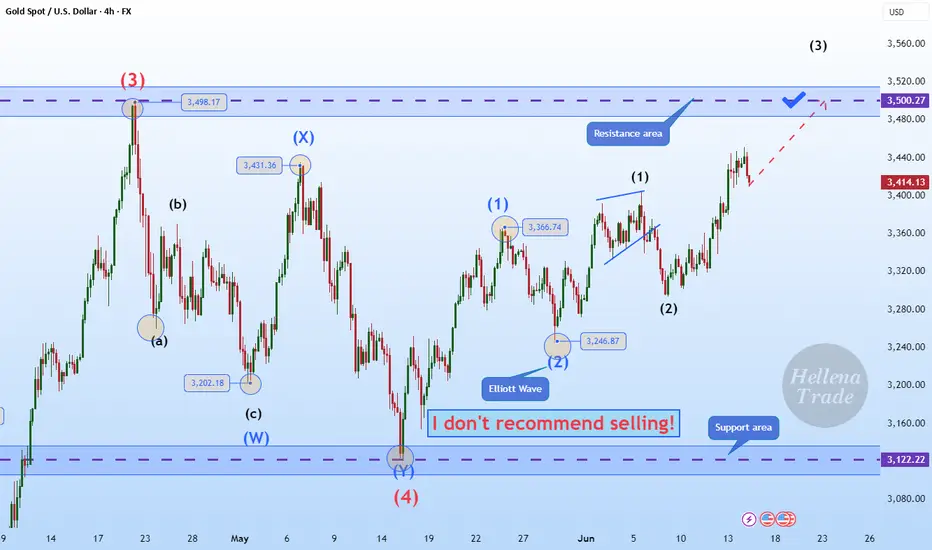
Hellena | GOLD (4H): LONG to resistance area of 3500.Colleagues, I believe that, as with the euro, the upward five-wave impulse is not yet over. At the moment, I see the formation of wave “3” of the lower order and wave ‘3’ of the middle order, which means that the upward movement will continue at least to the resistance area of 3500 — this is the maximum of wave “3” of the higher order, which means that a correction is possible at this level.
Manage your capital correctly and competently! Only enter trades based on reliable patterns!
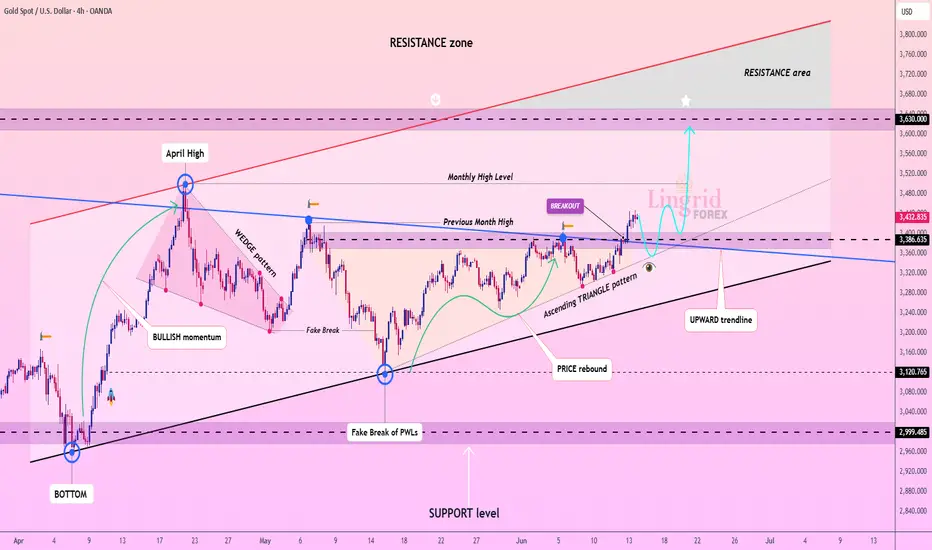
Lingrid | GOLD Weekly Analysis: Geopolitical Safe-Haven RallyOANDA:XAUUSD demonstrated exceptional strength this week as geopolitical tensions from Israeli-Iranian conflicts drove massive safe-haven demand. The metal successfully broke above the critical 3,360 resistance level, confirming the completion of an inverse head and shoulders pattern that has been forming since April.
The 4H chart reveals the market appears to be forming an ascending triangle pattern within a broader upward trendline, suggesting continued bullish momentum. The recent breakout above the monthly high resistance zone indicates strong institutional buying pressure.
The daily chart presents an even more compelling picture with the completion of an inverse head and shoulders pattern, a classic bullish reversal formation. This technical setup, combined with the massive flag pattern completion, projects potential targets toward $3,650-$3,700 levels. The right shoulder formation confirms the pattern's validity, while sustained buying above previous resistance zones validates the upward trajectory.
We should monitor the $3,430-$3,450 resistance area closely, as a decisive break could accelerate momentum toward the projected targets. The combination of geopolitical risk premiums and technically sound chart patterns creates a favorable environment for continued gold appreciation in the mid-term.
Traders, if you liked this idea or if you have your own opinion about it, write in the comments. I will be glad 👩💻
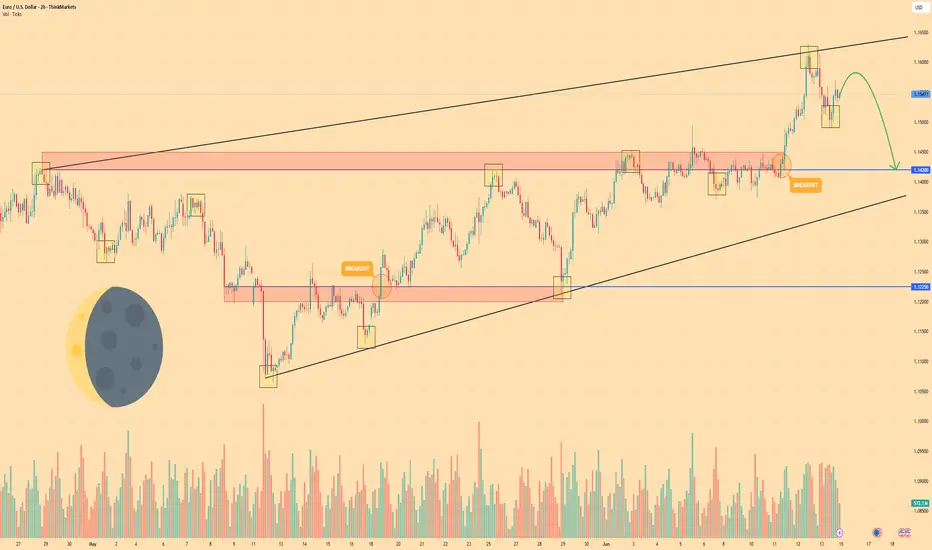
EURO - Pirce can make movement up and then drop to $1.1420Hi guys, this is my overview for EURUSD, feel free to check it and write your feedback in comments👊
After entering the wedge, Euro began to slow down, creating a tightening structure between support and resistance.
Price corrected toward the support line of the wedge, where it briefly paused and bounced with weak momentum.
The bounce triggered a breakout above local resistance, but buyers failed to hold the price at higher levels.
Soon after, the market reversed from the wedge’s upper boundary and began forming a bearish rejection pattern.
Now price trades just below the recent highs, showing fading demand and early signs of short-term reversal.
I expect Euro to move lower and reach the $1.1420 support level — my current target in this scenario.
If this post is useful to you, you can support me with like/boost and advice in comments❤️
Disclaimer: As part of ThinkMarkets’ Influencer Program, I am sponsored to share and publish their charts in my analysis.
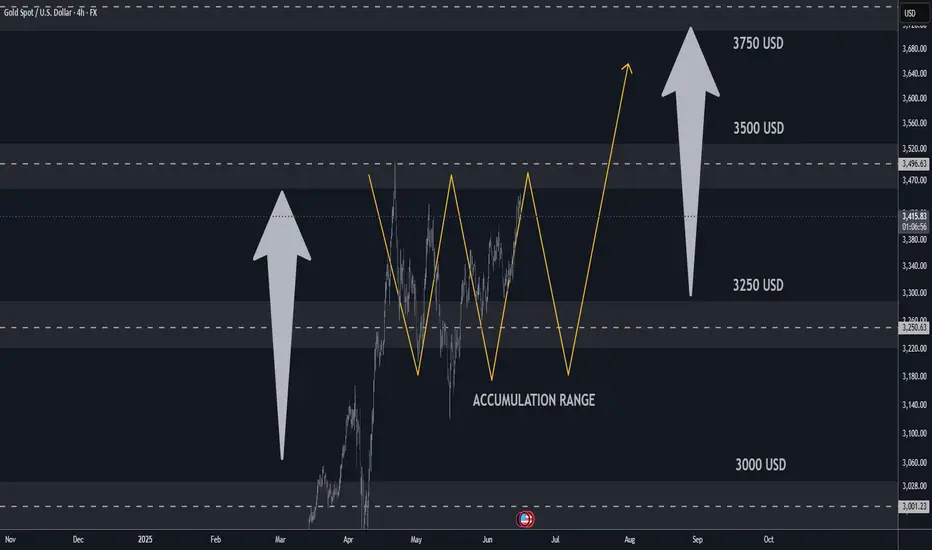
GOLD H4 Update: Bulls will target 3600/3750 USD Market Update🏆 Gold Market Mid-Term Update (June 16, 2025)
📊 Price & Technical Outlook
Current Spot Price: around $3,414
Technical Setup
* Gold consolidating above major support at \~\$3,180–3,200
* Testing resistance at \~\$3,380–3,400; breakout could push toward \$3,600
* Recent price action considered a healthy consolidation with upside potential
🏆 Bull Market Overview
* Pullback likely complete; supported by strong geopolitical and macro tailwinds
* Key price levels: \$3,000 / \$3,200 / \$3,400 (resistance near \$3,400)
* Bullish target: \$3,600, with further upside possible if momentum holds
* Short-term dips remain buying opportunities—“buy the dip” remains favored
⭐ Recommended Strategy
BUY/HOLD: Continue to accumulate on dips, using \$3,200–3,300 as entry zones
Target: Maintain bull target at \$3,600, with breakout opportunity above \$3,400
🏦 Macro & Market Drivers
Fed & Central Bank Outlook
* Investors positioning for possible Fed rate cuts later this year, likely totaling around 75 bps by end of 2025
* Ongoing dollar weakness supports gold
Geopolitical Tensions
* Middle East unrest, U.S.–Iran dynamics, and global evacuations are fueling safe-haven demand for gold
* Continued volatility in global hotspots likely to keep gold elevated
Risk Appetite & Market Behavior
* Both stocks and gold are climbing—an unusual “optimism + fear” scenario
* Central banks, especially in China, India, and Turkey, have been strong gold buyers in 2025
* Speculative positions in gold futures remain high
U.S.–China & Trade Tariffs
* Unresolved U.S.–China tariffs and tensions continue to support gold
* Any easing in trade friction could temper gold’s advance
📰 Latest Market Sentiment
* Wall Street remains bullish on gold for the upcoming week, though some caution persists ahead of the upcoming Fed meeting
* Macro environment is seen as supportive for gold and other precious metals
* Gold’s rally is positively influencing the broader precious metals market
🌏 Demand Themes
* **Asian Buyers**: China may relax gold import quotas to manage currency, while India demand remains strong though can be seasonally slower
* **Central Banks**: Over 240 tonnes of gold added in Q1 by central banks, with China and India as top buyers
⚠️ Risks & Watchpoints
* Fed surprises: A more hawkish tone at the next meeting could push gold back toward \$3,200–3,300
* Geopolitical breakthroughs: Any stable resolutions could reduce safe-haven demand
* Large speculative position unwinds could create short-term volatility
🔎 Mid-Term Outlook Summary
| Scenario | Support | Resistance | Catalysts |
| --------- | ------------- | ---------- | ----------------------------------- |
| Base case | \$3,200–3,300 | \$3,400 | Rate cut expectations + geopolitics |
| Bull case | Above \$3,400 | \$3,600+ | Escalating risk, dovish Fed |
| Bear case | Below \$3,200 | — | Hawkish Fed, easing global tensions |
✔️ Final Take
* Technical and fundamental momentum supports a continued bull phase with key target at \$3,600
* Best strategy: accumulate on dips between \$3,200–3,300
* Key factors to watch: Fed’s next move (June 17), Middle East developments, U.S.–China trade actions, central bank buying
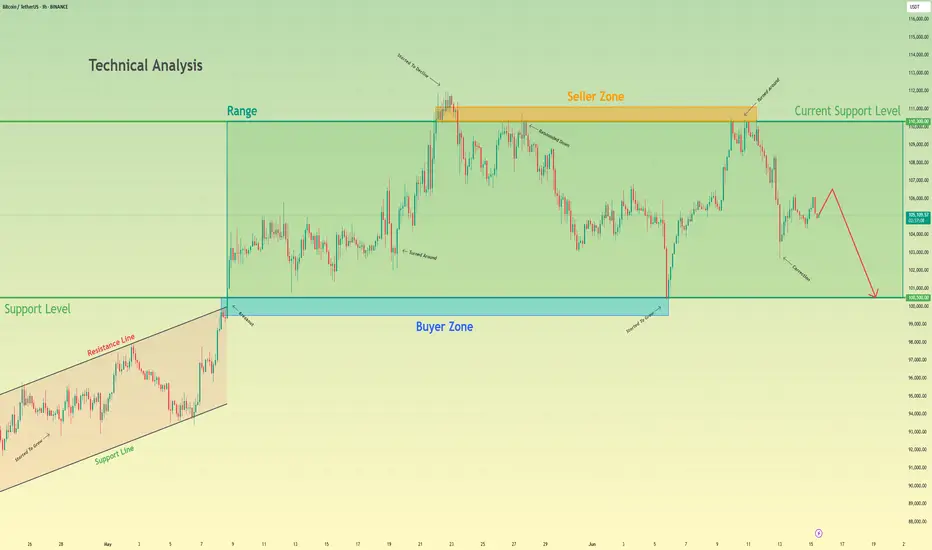
Bitcoin will make a small upward move and then continue to fallHello traders, I want share with you my opinion about Bitcoin. Earlier, the price was confidently growing inside an Upward Wedge, showing a series of higher highs and higher lows. This rising structure was supported by consistent momentum until BTC reached the seller zone between 110300 and 111100, where the growth slowed down and started to fade. From there, the price rejected this resistance and shifted into a Range, bounded by 100500 and 110300. BTC has been fluctuating inside this horizontal structure for some time, unable to break above the seller zone or below the buyer support. Now BTC is showing signs of weakness, forming a minor correction and struggling to reclaim previous highs. Given this structure and rejection from the seller zone, I expect BTC to make a small upward move and then start a decline toward the support level at 100500, which also coincides with the bottom of the range and acts as a strong psychological level. For this reason, I set my TP at 100500 points. Please share this idea with your friends and click Boost 🚀
GOLD ROUTE MAP UPDATEHey Everyone,
Great start to the week with our chart idea playing out to perfection once again!!
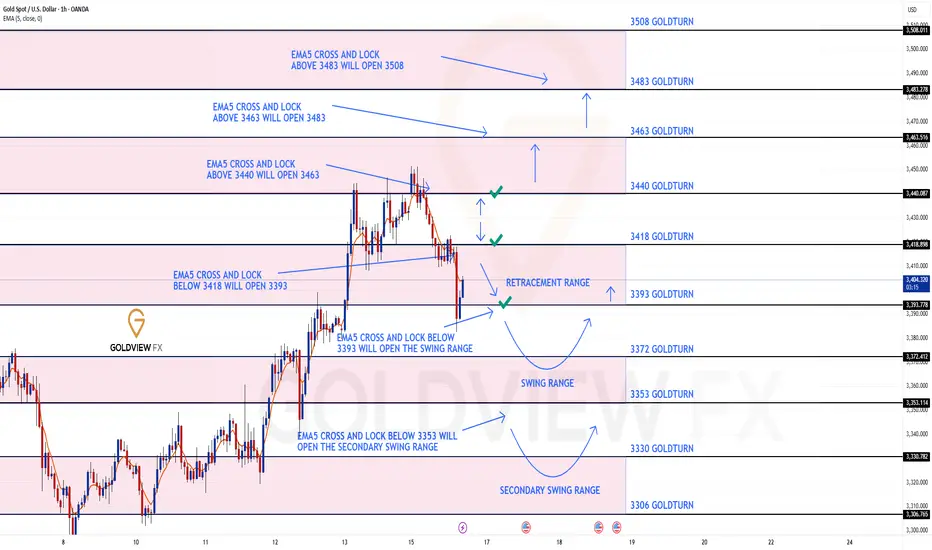
We started with our Bullish target at 3440 hit followed with no ema5 cross and lock confirming the perfect rejection, showcasing the accuracy of our levels. This rejection went onto hitting our Bearish target, followed with ema5 cross and lock opening 3393, which was also hit perfectly.
We will now look for ema5 lock below 3393 to open the swing range or failure to lock below will see the upper Goldturns tested again.
We will see levels tested side by side until one of the weighted levels break and lock to confirm direction for the next range.
We will keep the above in mind when taking buys from dips. Our updated levels and weighted levels will allow us to track the movement down and then catch bounces up.
We will continue to buy dips using our support levels taking 20 to 40 pips. As stated before each of our level structures give 20 to 40 pip bounces, which is enough for a nice entry and exit. If you back test the levels we shared every week for the past 24 months, you can see how effectively they were used to trade with or against short/mid term swings and trends.
The swing range give bigger bounces then our weighted levels that's the difference between weighted levels and swing ranges.
BULLISH TARGET
3440 - DONE
EMA5 CROSS AND LOCK ABOVE 3340 WILL OPEN THE FOLLOWING BULLISH TARGETS
3463
EMA5 CROSS AND LOCK ABOVE 3463 WILL OPEN THE FOLLOWING BULLISH TARGET
3483
EMA5 CROSS AND LOCK ABOVE 3483 WILL OPEN THE FOLLOWING BULLISH TARGET
3508
BEARISH TARGETS
3418 -DONE
EMA5 CROSS AND LOCK BELOW 3418 WILL OPEN THE FOLLOWING BEARISH TARGET
3393 DONE
EMA5 CROSS AND LOCK BELOW 3393 WILL OPEN THE SWING RANGE
3372
3353
EMA5 CROSS AND LOCK BELOW 3353 WILL OPEN THE SECONDARY SWING RANGE
3330
3306
As always, we will keep you all updated with regular updates throughout the week and how we manage the active ideas and setups. Thank you all for your likes, comments and follows, we really appreciate it!
Mr Gold
GoldViewFX
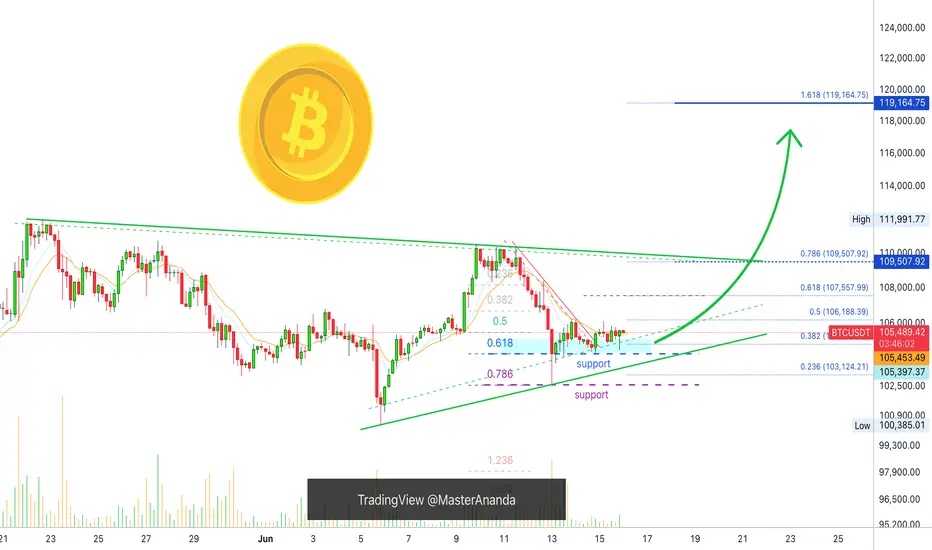
Bitcoin Mid-Term, 4H Timeframe, Bullish ($119,165 Next Target)On the 4H timeframe we have a consolidation pattern with a bullish bias. Bitcoin is aiming higher after a close above EMA8 & 13 with higher lows.
The drop 13-June found support perfectly at 0.786 Fib. retracement on a wick. The session closed above 0.618. The action turned bullish immediately and we are seeing slow but steady growth.
The recent drop was a market reaction due to a geopolitical situation. As soon as the event is priced in, the market seeks balance and goes back to its previous trend.
Bitcoin's bullish bias is not only supported by strong prices, $105,600 is very strong, but also by the altcoins and the cyclical nature of the market.
While Bitcoin already produced several new all-time highs this year the altcoins are yet to do the same. A bull market happens every four years or the year after the halving. For Bitcoin this is already true but this is a marketwide event and the altcoins are yet to go there and this is a bullish factor and soon this will be obvious on the chart.
We are 5-6 days away only from very strong bullish action. Notice that this isn't a long time, it is less than a week. The altcoins will reveal this bullish bias much sooner than Bitcoin but Bitcoin will also grow and hit a new all-time high soon. This new all-time high will be the catalyst for everything to boom.
» Ignore the short-term it is all noise—crypto is going up.
The next target is $107,558, followed by $109,508 on this timeframe. The latter being a mild resistance.
The main target here is $119,165 and this is a good resistance zone. It can be rounded up to $120,000. If this level gets hit it will only confirm additional growth. The target that follows is $130,000 and the minimum for this cycle is $160,000 but we are aiming higher.
Feel free to follow for more.
I will continue to detail Bitcoin on all the timeframes as well as many of the top, mid- and small altcoins.
Thank you for your support.
It is appreciated.
Namaste.
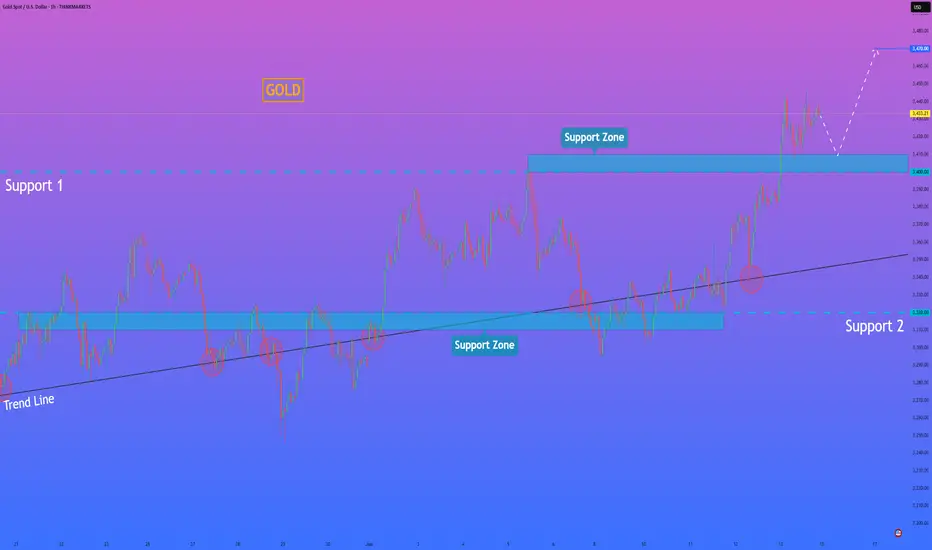
HelenP. I Gold may correct to support zone and then rebound upHi folks today I'm prepared for you Gold analytics. After rebounding from the trend line, XAUUSD began to grow steadily within the rising structure, confidently pushing through local resistance and breaking above the previous support 2 area. This breakout was backed by strong bullish momentum, with the price clearly holding above the broken level, turning it into a support base. Following that surge, the price entered a short-term consolidation, trading within the upper boundary of the chart, just above the 3400 level. This area now acts as a crucial support zone, and the market is currently hovering slightly above it after a local peak. Given the strength of the recent impulse and the confirmation of previous resistance as support, I expect a brief correction to the support zone before a continuation of the bullish move. That’s why I set my current goal at 3470 points — the next potential resistance area where the price may encounter renewed selling pressure after the rally continues. If you like my analytics you may support me with your like/comment ❤️
Disclaimer: As part of ThinkMarkets’ Influencer Program, I am sponsored to share and publish their charts in my analysis.
16.06.25 Morning ForecastPairs on Watch -
FX:NZDUSD
FX:CADJPY
OANDA:XAUUSD
FX:EURCAD
A short overview of the instruments I am looking at for today, multi-timeframe analysis down to what I will be looking at for an entry. Enjoy!

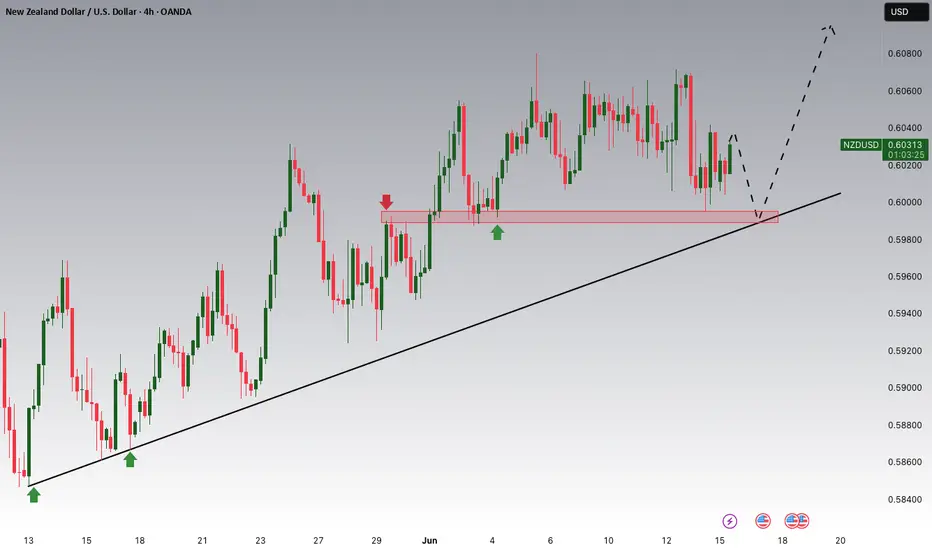
NZDUSD Potential UpsidesHey Traders, in today's trading session we are monitoring NZDUSD for a buying opportunity around 0.60000 zone, NZDUSD is trading in an uptrend and currently is in a correction phase in which it is approaching the trend at 0.600000 support and resistance area.
Trade safe, Joe.
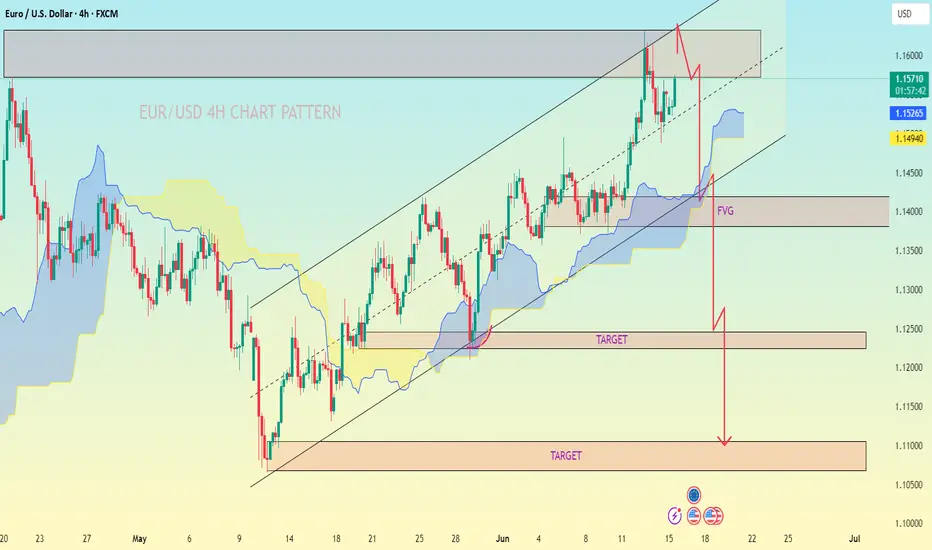
EUR/USD 4H CHART PATTERN.EUR/USD 4H chart, the chart analysis shows a bearish outlook after a potential rising channel breakdown. Here are the key bearish targets as shown:
---
📉 Bearish Targets:
1. First Target Zone (FVG Area)
Price Range: Around 1.1400 – 1.1350
This is marked as the Fair Value Gap (FVG) and could act as the first reaction/support zone.
2. Second Target Zone
Price Range: Around 1.1250 – 1.1200
Clearly labeled as “TARGET” in the middle of the chart.
3. Final Target Zone (Major Support)
Price Range: Around 1.1100 – 1.1050
Also labeled “TARGET” at the bottom. This aligns with a past support level and previous consolidation area.
---
🧭 Summary:
A breakdown from the rising channel is expected.
Price may drop first into the FVG zone (1.1350 area).
Then continue down to 1.1200.
Final support target sits near 1.1050.
Would you like me to help identify bullish invalidation or risk levels as well?
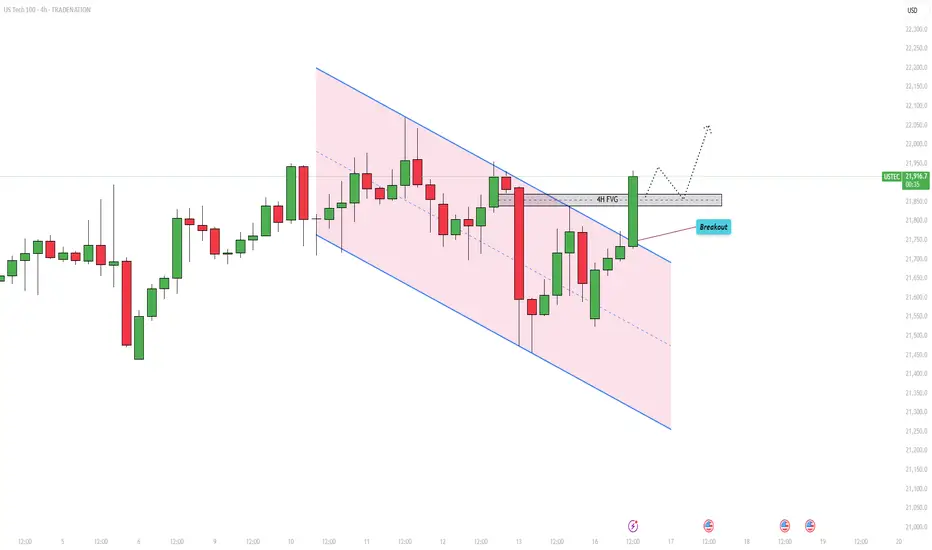
US100 – Eyes on $22,040 as bulls take chargeIntroduction
The US100 is currently showing signs of a bullish breakout, moving above the boundaries of a previously established parallel channel. It is now approaching an important area of imbalance, known as a Fair Value Gap (FVG), on the 4-hour chart. If the index manages to break through this zone, there is a strong potential for continued upward momentum. Let’s take a closer look at the technical setup and what might come next.
Parallel Channel
For some time, the US100 had been trading within a downward-sloping parallel channel, consistently making lower highs and lower lows. However, today's price action has changed that narrative. The index has broken out of the channel to the upside and is currently pushing towards new short-term highs, which could mark the beginning of a bullish trend reversal.
4-Hour Fair Value Gap (FVG)
The current focus is on an open 4-hour FVG that ranges from approximately 21,840 to 21,870. This zone could serve as a significant resistance level, potentially rejecting further upward movement. However, if the US100 breaks decisively above this range, it could open the door for a rapid push toward previous highs. Such a move would signal strong bullish momentum and confirm the breakout as legitimate.
Possibility of a False Breakout
There is always the risk that this breakout could turn out to be a false move. If the US100 fails to hold above the 4-hour FVG and reverses back below the channel breakout point, it could indicate a bull trap. In that case, the index may resume its downward trend. Still, based on the current momentum and market structure, this scenario seems less likely at the moment.
Upside Target
If the breakout above the FVG is successful, the next significant target lies at the recent highs near 22,040. This level is expected to act as strong resistance. Should the US100 manage to break through it, we could see a test of the all-time high in the near future. However, it’s important to approach the market with patience and let each level confirm itself before expecting further upside.
Conclusion
While the US100 has successfully broken out of its parallel channel, it is now facing a key test at the 4-hour FVG. A clean break above this zone would likely shift market sentiment to bullish and set the stage for a move toward 22,040 and potentially beyond. Until then, traders should watch closely for confirmation and be mindful of the possibility of a pullback.
Disclosure: I am part of Trade Nation's Influencer program and receive a monthly fee for using their TradingView charts in my analysis.
Thanks for your support.
- Make sure to follow me so you don't miss out on the next analysis!
- Drop a like and leave a comment!
The "True Close" Institutions Don't Talk About — But Trade On█ My Story from the Inside
I worked at a hedge fund in Europe, where I served as a Risk Advisor. One thing I never expected before joining the institutional side of the market was this:
They didn’t treat the current day’s close as the "true" close of the market.
Instead, they looked at the first hour of the next day — once all pending flows had settled, rebalancing was done, and execution dust had cleared — that was the true close in their eyes.
Here’s why that changed everything I knew about trading:
█ Institutional Reality vs Retail Fantasy
⚪ Retail traders are taught:
“The daily close is the most important price of the day.” But institutions operate under constraints that most retail traders are never exposed to:
Orders too large to fill before the bell
Internal compliance and execution delays
Batch algorithms and VWAP/TWAP systems that extend into the next session
So while the market might close on paper at 17:30 CET, the real trading — the stuff that matters to funds — might not wrap up until 09:30 or 10:00 the next morning.
Although the official “close” prints here, institutional volume ends quickly. It drops off sharply, almost immediately. Once the books are closed and final prints are done, big players exit — and what's left is thin, passive flow or noise.
The first hour of the New York session reveals structured flows, not random volatility. This is where institutions finalize yesterday’s unfinished business, which is why many consider this the “true” close.
And that’s the price risk managers, portfolio managers, and execution teams internally treat as the reference point.
█ Example: The Rebalance Spillover
Let’s say a fund needs to offload €100 million worth of tech stocks before month-end. They start into the close, but liquidity is thin. Slippage mounts. They pause execution. Next morning, their algo resumes — quietly but aggressively — in the first 30 minutes of trade.
You see a sharp spike. Then a reversal. Then another surge.
That’s not noise. That’s structure. It’s the result of unfinished business from yesterday.
█ Why the First Hour is a War Zone
You’ve probably seen it:
Prices whip back and forth at the open
Yesterday’s key levels are revisited, sometimes violently
Big moves happen without any overnight news
Here’s what’s happening under the hood:
Rebalancing spillovers from the day before
Late-position adjustments from inflows/outflows
Risk parity or vol-targeting models triggering trades based on overnight data
The market’s not reacting to fresh news — it’s completing its old to-do list.
█ What the Research Really Says About Morning Volatility
The idea that "the true close happens the next morning" isn’t just insider intuition — it’s backed by market microstructure research that highlights how institutional behaviors disrupt the clean narrative of the official close.
Here’s what the literature reveals:
█ Heston, Korajczyk & Sadka (2010)
Their study on intraday return patterns shows that returns continue at predictable 30-minute intervals, especially around the open.
The key driver? Institutional order flow imbalances.
When big funds can’t complete trades at the close, they spill into the next session, creating mechanical, non-informational momentum during the first hour. These delayed executions are visible as persistent price drifts after the open, not random volatility.
█ Wei Li & Steven Wang (SSRN 2010)
This paper dives into the asymmetric impact of institutional trades. It shows that when institutions are forced to adjust positions — often due to risk limits, inflows/outflows, or model-based triggers — the market reacts most violently in the early hours of the day.
When funds lag behind the clock, the next morning becomes a catch-up window, and price volatility spikes accordingly.
█ Lars Nordén (Doctoral Thesis, Swedish Stock Exchange)
In his microstructure research, Nordén found that the variance of returns is highest in the early part of the session, not at the close. This is especially true on days following macro events or at the end/start of reporting periods.
The data implies that institutions “price in” what they couldn’t execute the day before, making the next morning more informative than the actual close.
█ Bottom Line from the Research:
The first hour isn’t wild because it’s full of emotion.
It’s wild because it’s full of unfinished business.
These studies reinforce that price discovery is a rolling process, and for institutional flows, the official close is just a checkpoint, not a final destination.
█ How to Use This as a Trader
⚪ Don't assume the official close is final
Treat it as a temporary bookmark. Watch what happens in the first hour of the next day — that’s when intentions are revealed.
⚪ Volume in the first 30–60 minutes matters
It’s not noise — it’s flow completion. Often non-price-sensitive. Often mechanical.
⚪ Design strategies around “true close” logic
Test fade setups after the first hour’s range is established. That’s often the real “settled” level.
⚪ Use the first-hour VWAP or midpoint as a reference
Institutions may anchor to that — not the official close — for mean reversion or risk metrics.
█ Final Thought
The first hour is not the start of something new.
It’s the conclusion of yesterday’s market.
And unless you understand how institutions truly close their books — and how long that takes — you’ll always be a step behind.
So next time you see chaos at the open, stop calling it random.
👉 It’s just the market putting yesterday to bed — late.
-----------------
Disclaimer
The content provided in my scripts, indicators, ideas, algorithms, and systems is for educational and informational purposes only. It does not constitute financial advice, investment recommendations, or a solicitation to buy or sell any financial instruments. I will not accept liability for any loss or damage, including without limitation any loss of profit, which may arise directly or indirectly from the use of or reliance on such information.
All investments involve risk, and the past performance of a security, industry, sector, market, financial product, trading strategy, backtest, or individual's trading does not guarantee future results or returns. Investors are fully responsible for any investment decisions they make. Such decisions should be based solely on an evaluation of their financial circumstances, investment objectives, risk tolerance, and liquidity needs.
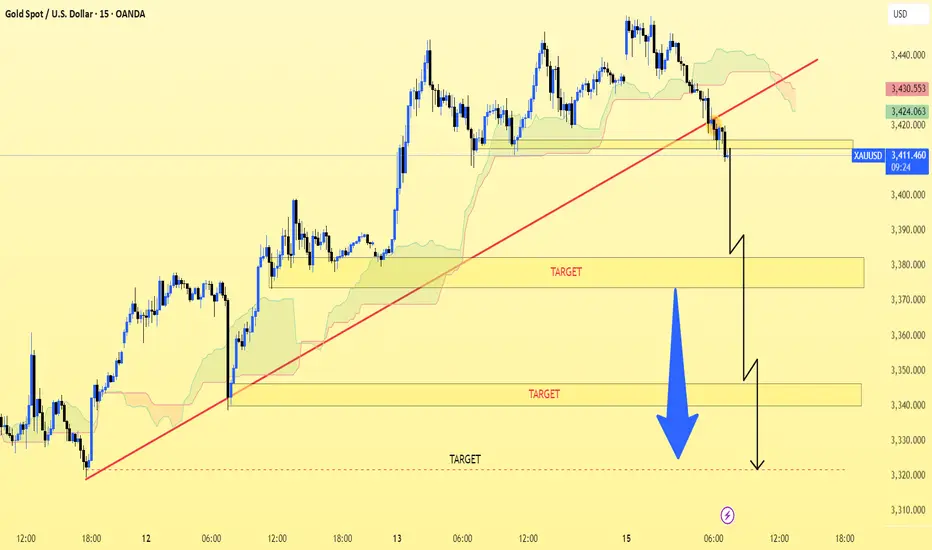
XAU/USD,15M CHART PATTERN.gold at 3412, and im listed the following targets:
Target 3482 → This is above your entry price, so it looks like a mistake if you're in a sell position.
Target 3340 → Logical downside target.
Target 3320 → Another lower target, continuation of bearish momentum.
Corrected View (Assuming SELL from 3412):
Type Level
Entry 3412
TP1 3340
TP2 3320
SL (suggested) 3445–3450 (above recent highs)
Let me know if the 3482 was meant to be your stop loss instead — that would make more sense in this context.
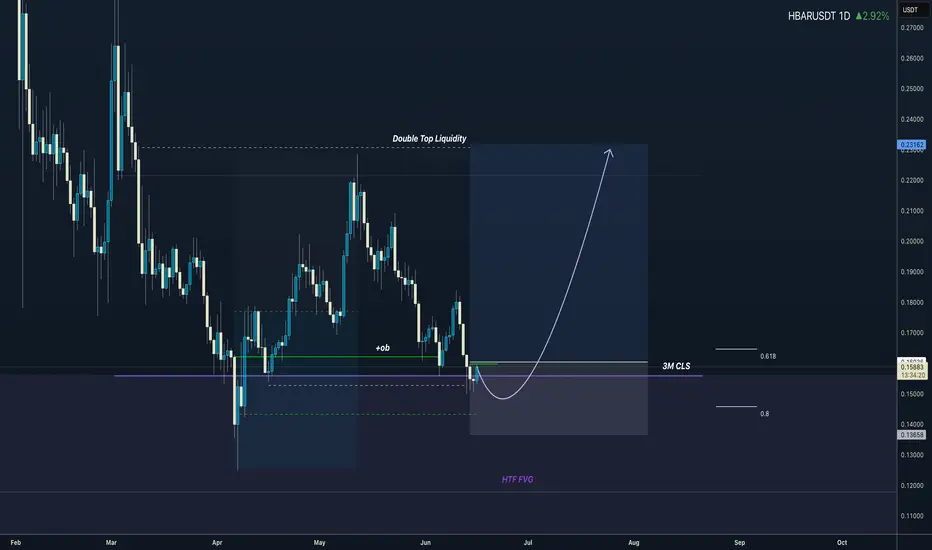
3M CLS I KL - FVG I Model 2 I Target 50% CLSHey, Market Warriors, here is another outlook on this instrument
If you’ve been following me, you already know every setup you see is built around a CLS Footprint, a Key Level, Liquidity and a specific execution model.
If you haven't followed me yet, start now.
My trading system is completely mechanical — designed to remove emotions, opinions, and impulsive decisions. No messy diagonal lines. No random drawings. Just clarity, structure, and execution.
🧩 What is CLS?
CLS is real smart money — the combined power of major investment banks and central banks moving over 6.5 trillion dollars a day. Understanding their operations is key to markets.
✅ Understanding the behavior of CLS allows you to position yourself with the giants during the market manipulations — leading to buying lows and selling highs - cleaner entries, clearer exits, and consistent profits.
📍 Model 1
is right after the manipulation of the CLS candle when CIOD occurs, and we are targeting 50% of the CLS range. H4 CLS ranges supported by HTF go straight to the opposing range.
"Adapt what is useful, reject what is useless, and add what is specifically your own."
— David Perk aka Dave FX Hunter ⚔️
👍 Hit like if you find this analysis helpful, and don't hesitate to comment with your opinions, charts or any questions.