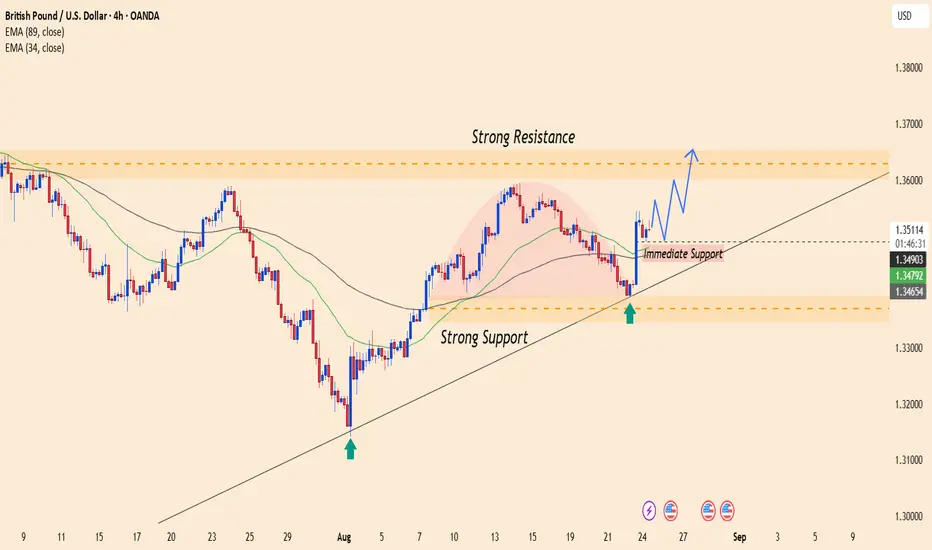
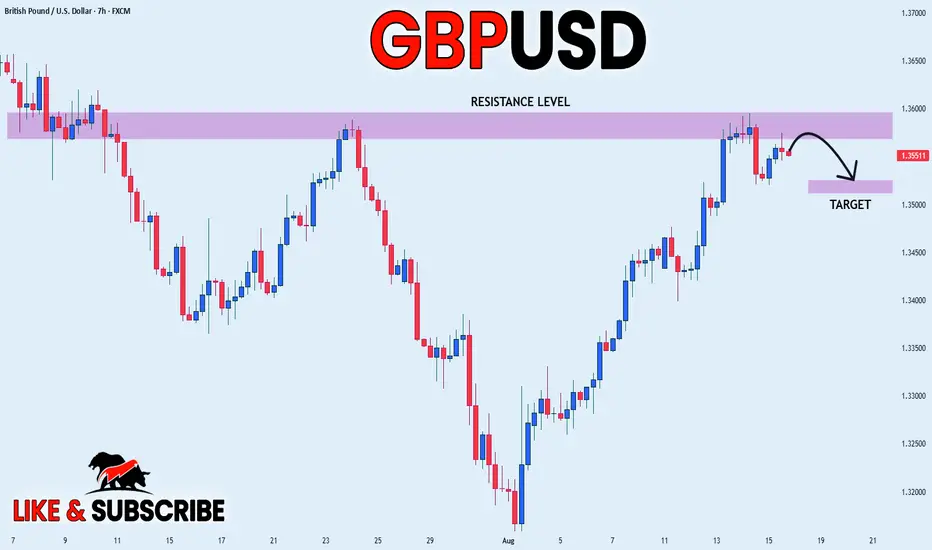
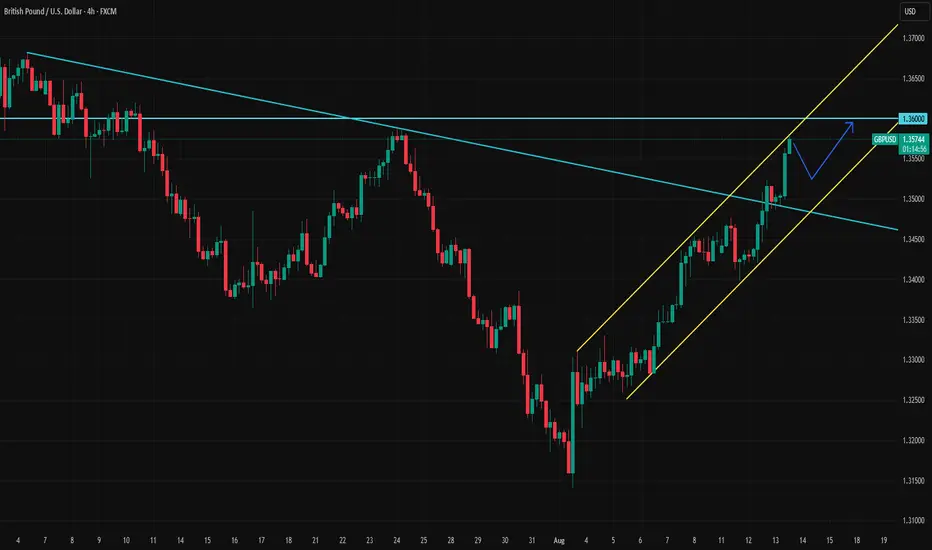
GBP/USD Growth – Breakout on News MomentumGBP/USD has strongly rebounded from the immediate support at 1.3490, holding above the trendline. This momentum is driving price action closer to the key resistance at 1.3650, where profit-taking pressure may emerge. A clear breakout above this level would confirm and extend the short-term bullish trend.
On the news side, the dovish remarks from Fed Chair Jerome Powell at Jackson Hole weakened the USD, providing a strong push for GBP/USD to break above 1.3500. In addition, markets are awaiting U.S. PMI data and the Fed’s upcoming policy direction, both of which could further support the pound’s upward momentum.
Suggested strategy: Traders may consider buying near the immediate support zone, setting a short-term target at 1.3650, with a further extension to 1.3720 if the breakout holds. A stop-loss should be placed below 1.3390 to limit risks in case of a trend reversal.
#gbpusd#forex
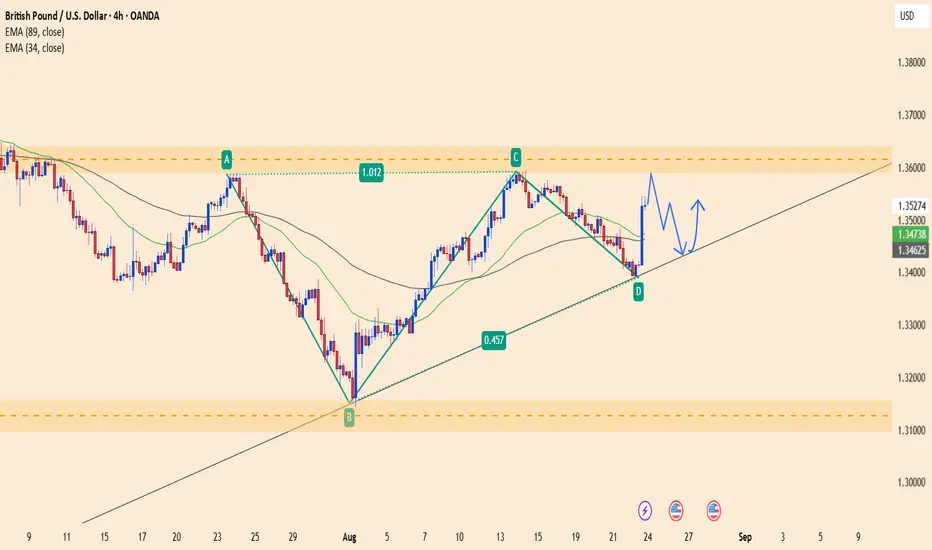
GBP/USD Soars Sharply: Can This Breakout Hold?Technical Analysis:
Price Pattern: GBP/USD is currently in an uptrend with strong support at 1.34300 and resistance near 1.35900.
EMA: The 34-period EMA has crossed above the 89-period EMA, indicating the strength of the uptrend.
Signal: Price has just broken through the 1.35200 resistance zone, suggesting that the strong uptrend may continue.
News:
After remarks from Fed officials at the Jackson Hole Symposium, the USD weakened, allowing GBP/USD to benefit and providing an opportunity for further gains.
Trading Strategy:
Uptrend: If price stays above 1.35200, the pair could continue rising, targeting 1.35900 and potentially 1.36500.
Support Levels: If price pulls back and holds above 1.34300, the uptrend will be further confirmed.
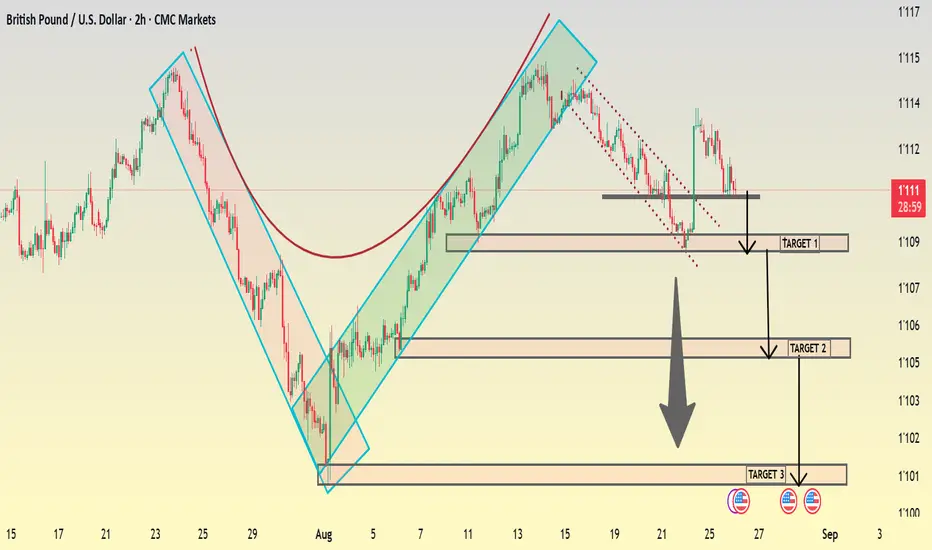
GBP/USD Bearish Chart Pattern on 2H ......GBPUSD (2H) Bearish Analysis
1. Chart Structure
The chart shows a bearish channel (blue box) – price is respecting the downward slope.
The red arc highlights a rounded top pattern, a strong reversal signal.
Recent candles show failure to hold higher levels, confirming sellers are in control.
---
2. Entry & Current Zone
Entry Zone: Around 1.1110 – 1.1120 (bearish rejection area).
Price failed to break higher and is now trending back inside the bearish structure.
---
3. Bearish Targets
Target 1: 1.1070 → First demand zone & short-term liquidity grab.
Target 2: 1.1045 → Stronger support & midpoint of the structure.
Target 3: 1.1010 → Final major support & completion of full channel move.
---
4. Stop-loss & Invalidation
Stop-loss: Above 1.1145 – 1.1150
Reason: A breakout above this zone would invalidate the bearish channel and shift structure back bullish.
---
5. Risk–Reward Setup
Entry: 1.1110
SL: 1.1150 (40 pips risk)
TP1: 1.1070 (+40 pips → R:R = 1:1)
TP2: 1.1045 (+65 pips → R:R ≈ 1.6)
TP3: 1.1010 (+100 pips → R:R = 2.5)
---
6. Professional View
GBPUSD is in a bearish channel continuation.
Rounded top + rejection from channel resistance confirm further downside pressure.
Best strategy: Short from 1.1110 zone, scale out profits at TP1 & TP2, and hold remainder for TP3.
✅ Summary (Pro Signal)
GBPUSD short from 1.1110, SL above 1.1150, targets 1.1070 / 1.1045 / 1.1010.
Bearish channel + rounded top + resistance rejection = strong downside continuation.
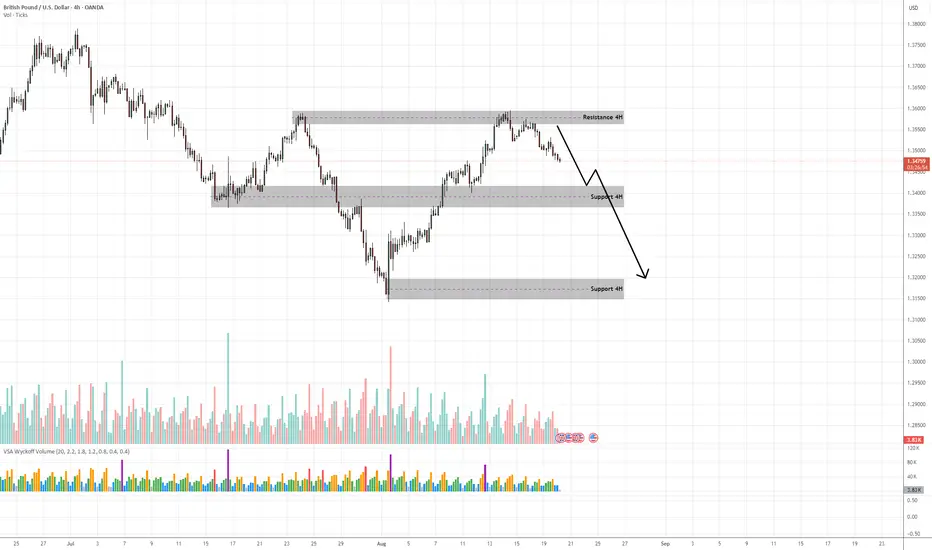
GBP/USD – VSA Signals Supply Emerging at 4H Resistance💡 Idea:
GBP/USD recently tested the 1.37–1.3750 resistance zone and showed clear supply signals in VSA terms. The price is rolling over with wide down-bars on increasing volume, confirming professional selling pressure. The pair is likely entering a markdown phase toward deeper 4H support levels.
📍 Trade Setup
Entry: 1.3470–1.3500 (pullback into broken support / minor supply test)
Stop Loss: 1.3575 (above last supply zone)
Target 1: 1.3340 (next 4H support)
Target 2: 1.3180 (major 4H support base)
R:R Ratio: ~1:3
📊 VSA & Technical Reasoning
Supply Bar at Resistance
At 1.37+, wide spread down-bars closed near the lows on ultra-high volume → classical VSA supply bar, confirming professional selling.
Upthrust / Trap Move
The wick above resistance acted as an Upthrust, luring breakout buyers before reversing sharply — a typical Wyckoff distribution signature.
No Demand Rally
Recent small up-bars into resistance came with narrow spread + low volume, showing lack of demand and confirming sellers are in control.
Lower Highs + Breakdown
Market structure has shifted into a downtrend sequence (lower highs & lower lows) aligning with VSA weakness.
Volume Confirmation
Volume on down-bars remains elevated vs. up-bars, validating that supply > demand. This suggests further downside continuation.
📌 Trading Plan
Look to short retracements into 1.3470–1.3500.
Expect price to break 1.34 support on increased supply.
Trail stop aggressively once 1.3340 is tested, targeting 1.3180 as the larger markdown objective.
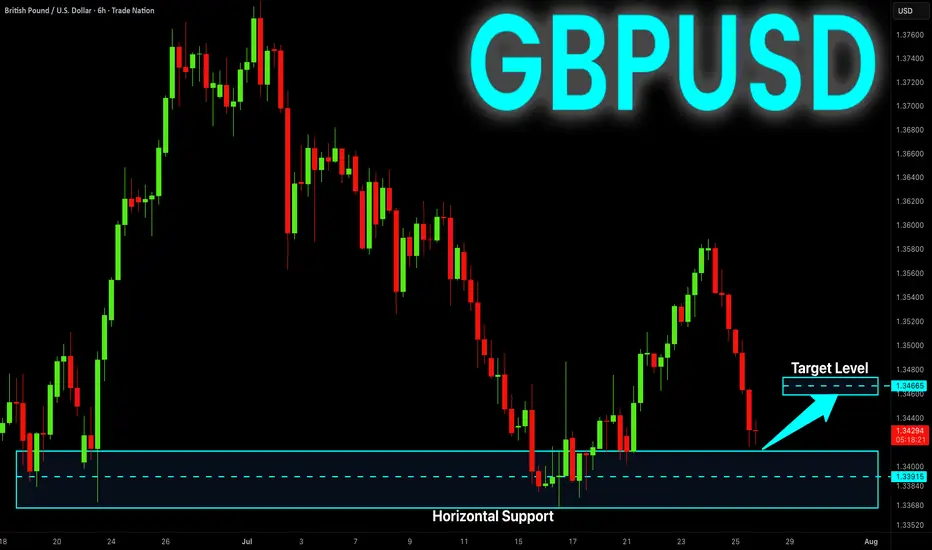
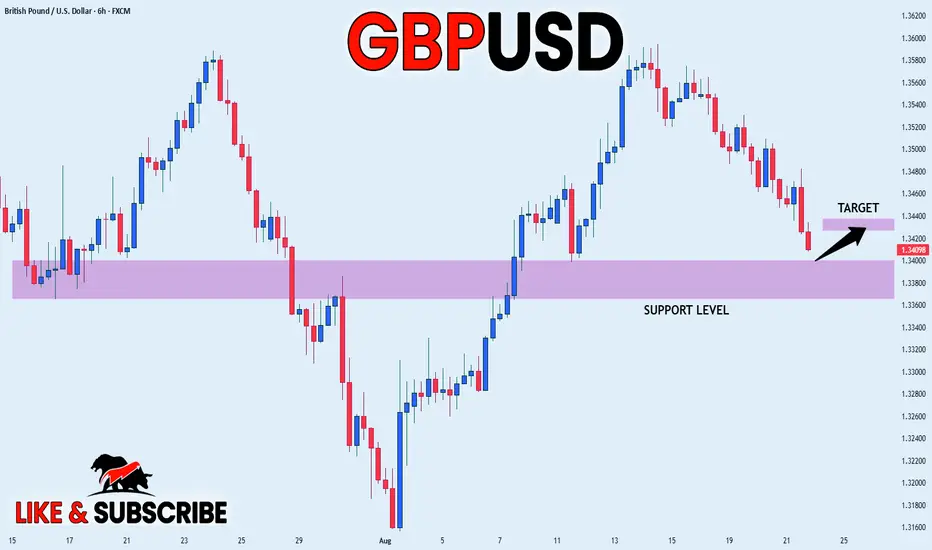
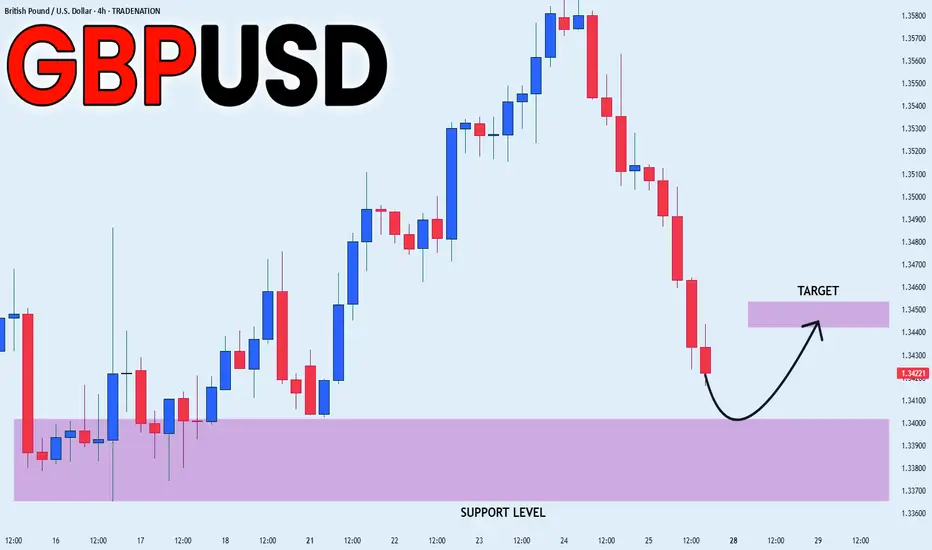
GBP_USD SUPPORT AHEAD|LONG|
✅GBP_USD is set to retest a
Strong support level below at 1.3380
After trading in a local downtrend for some time
Which makes a bullish rebound a likely scenario
With the target being a local resistance above at 1.3429
LONG🚀
✅Like and subscribe to never miss a new idea!✅
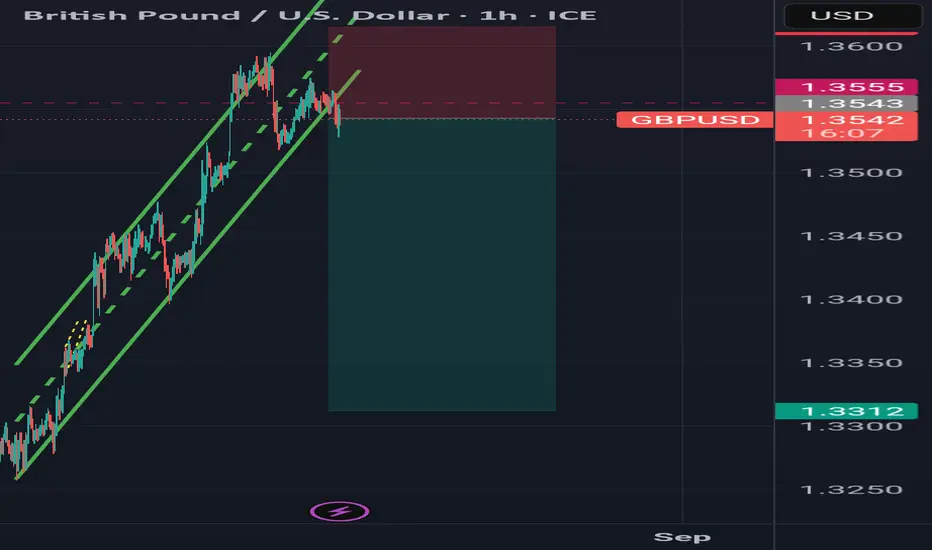
Short gbpusd and short eurusdI've been expecting Gbpusd to sell for some days now. Sl was hit in previous trade but breakout from Channel is clear now and I'm expecting price to move further down
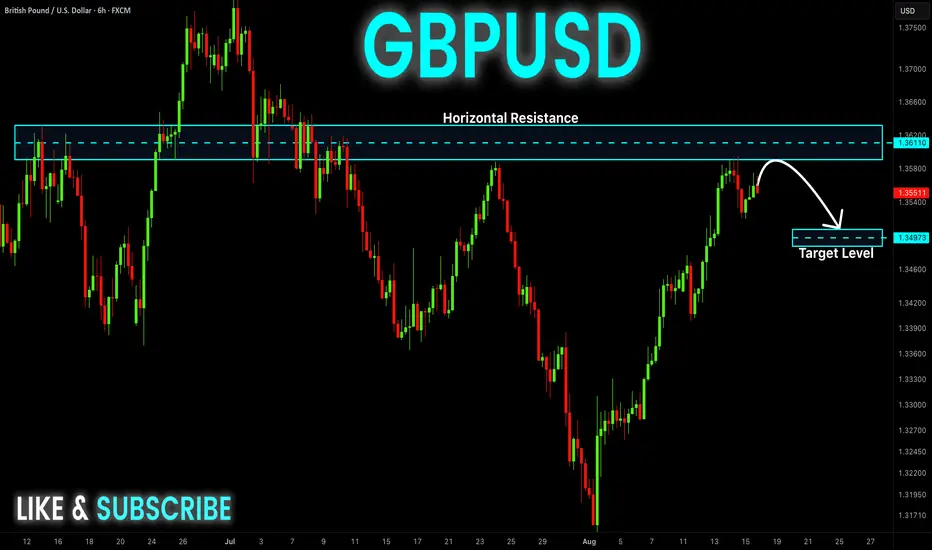
GBP-USD Resistance Ahead! Sell!
Hello,Traders!
GBP-USD is already making
A local pullback from the
Horizontal resistance
Of 1.3612 so we are locally
Bearish biased and we will
Be expecting a further
Bearish move down
Sell!
Comment and subscribe to help us grow!
Check out other forecasts below too!
Disclosure: I am part of Trade Nation's Influencer program and receive a monthly fee for using their TradingView charts in my analysis.
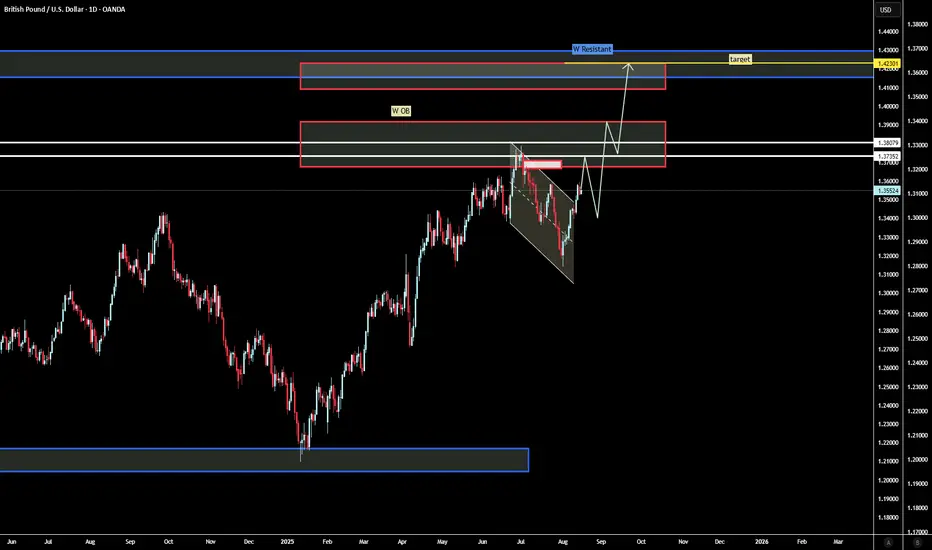
GBP/USD Forecast – Bullish Continuation SetupGBP/USD has broken out of the descending channel and is maintaining bullish momentum. I expect the price to move toward the 1.3725–1.3807 resistance zone, where we may see a corrective pullback. If this zone holds and structure remains bullish, the next target sits at the weekly order block near 1.4230, aligning with higher-timeframe supply.
Bias remains bullish unless price closes back below recent lows and re-enters the channel, which would invalidate the setup. For now, market structure favours continuation to the upside.
Targets:
Short-term: 1.3725–1.3807
Long-term: 1.4230
Invalidation: Break and close back below channel lows.
GBP_USD LOCAL SHORT|
✅GBP_USD has retested a key resistance level of 1.3596
And as the pair is already making a bearish pullback
A move down to retest the demand level below at 1.3525 is likely
SHORT🔥
✅Like and subscribe to never miss a new idea!✅
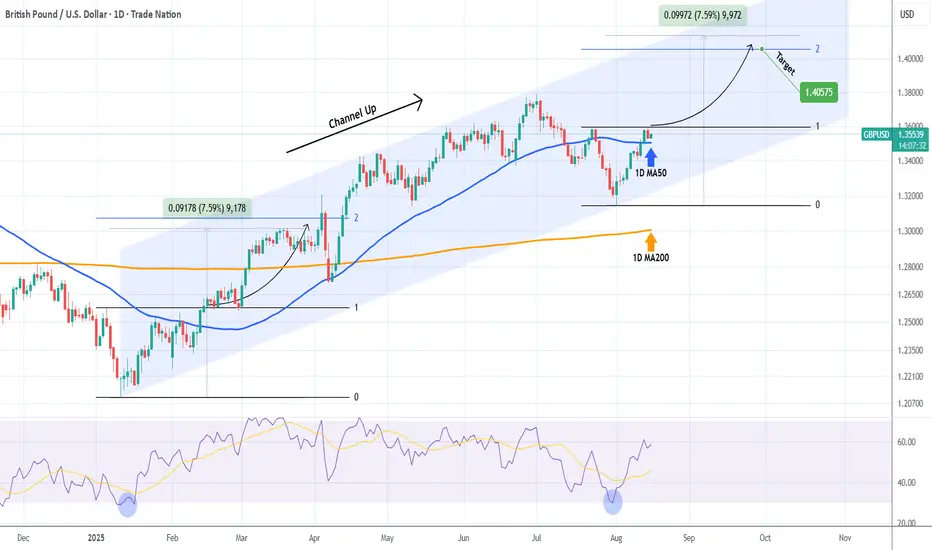
GBPUSD Channel Up started a new Bullish LegThe GBPUSD pair has been trading within a Channel Up since the January 13 2025 bottom. Right now, the pattern has already initiated the new Bullish Leg.
With the 1D RSI having rebounded on the 30.00 oversold level, it draws comparisons to the first Bullish Leg o the Channel Up. That made a +7.59% rise to hit its 2.0 Fibonacci extension.
As a result, our medium-term Target is set a 1.40575.
-------------------------------------------------------------------------------
** Please LIKE 👍, FOLLOW ✅, SHARE 🙌 and COMMENT ✍ if you enjoy this idea! Also share your ideas and charts in the comments section below! This is best way to keep it relevant, support us, keep the content here free and allow the idea to reach as many people as possible. **
-------------------------------------------------------------------------------
Disclosure: I am part of Trade Nation's Influencer program and receive a monthly fee for using their TradingView charts in my analysis.
💸💸💸💸💸💸
👇 👇 👇 👇 👇 👇
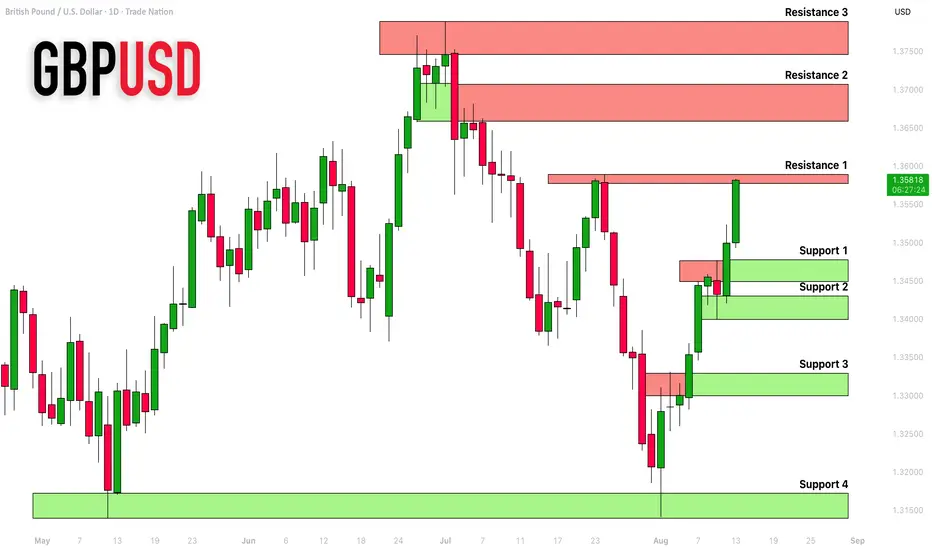
GBPUSD: Complete Support & Resistance Analysis 🇬🇧🇺🇸
Here is my latest structure analysis for GBPUSD.
Resistance 1: 1.3577 - 1.3590 area
Resistance 2: 1.3657 - 1.3705 area
Resistance 3: 1.3745 - 1.3790 area
Support 1: 1.3450 - 1.3480 area
Support 2: 1.3400 - 1.3430 area
Support 3: 1.3300 - 1.3330 area
Support 4: 1.3140 - 1.3174 area
Consider these structures for pullback/breakout trading.
❤️Please, support my work with like, thank you!❤️
I am part of Trade Nation's Influencer program and receive a monthly fee for using their TradingView charts in my analysis.
GBPUSD Tests Upper Line of the ChannelGBPUSD has reached the upper boundary of its trend channel. Intraday price action may turn negative as the U.S. session approaches, but the broader direction remains upward, supported by the latest strong UK job numbers.
If GBPUSD faces short-term selling pressure from the upper line, any downward move could present a buying opportunity, unless the trend ends prematurely. The next upward wave could target the 1.36 level.
GBPUSD SELL IDEA After seeing the daily timeframe reject the moving average in addition to resistance at1.33125 and also a break of 4hr structure support and also trendline area of support, we could be expecting a push into new lows.

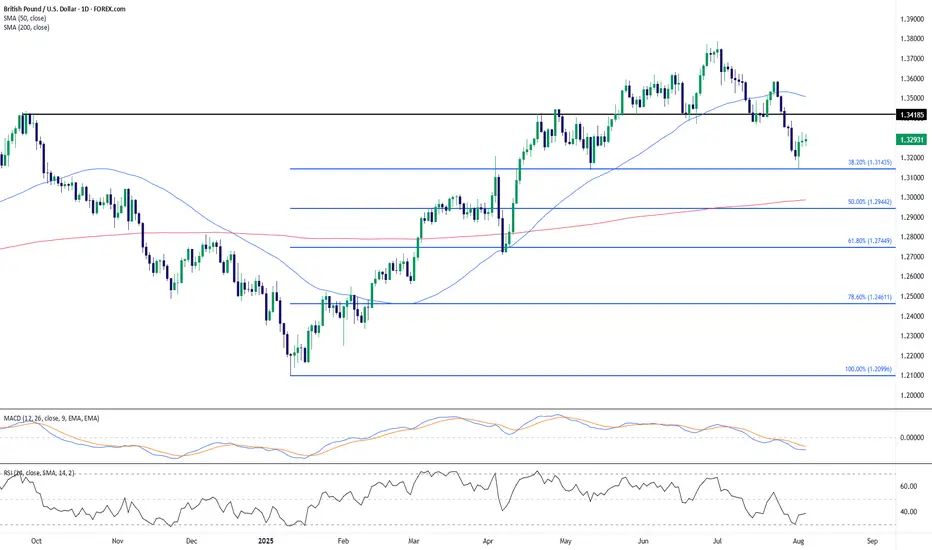
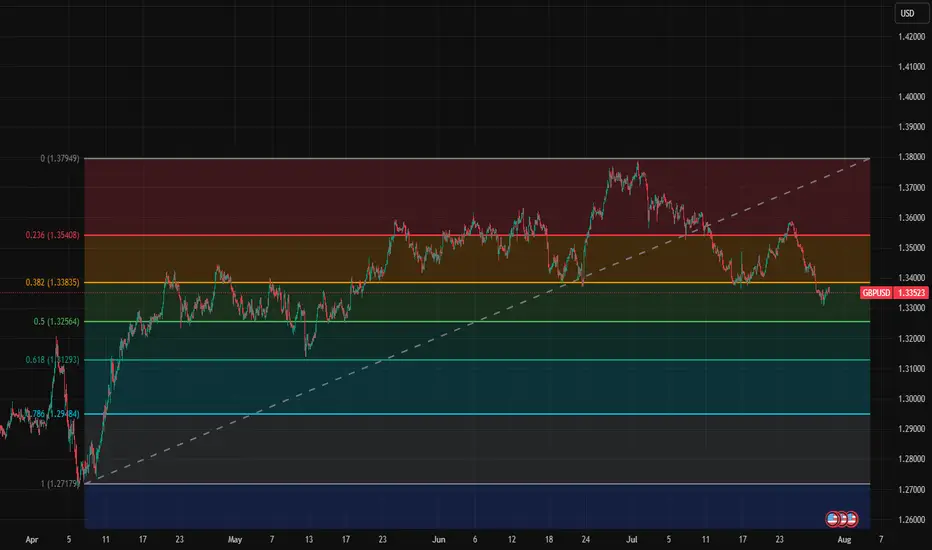
GBP/USD: Bullish Bounce from Fibonacci SupportCable has recently rebounded off the 38.2% Fibonacci retracement level around 1.3145, suggesting initial downside momentum is losing steam after the July high near 1.38. This bounce comes as RSI begins turning up from oversold territory (38.70), potentially hinting at early bullish divergence. Meanwhile, the MACD remains bearish, though its histogram shows signs of contraction.
Price action has slipped below the 50-day SMA (1.3508), but is still well above the 200-day SMA (1.2986), keeping the broader bullish structure intact. The area between 1.3145 and the 1.2940 (50% retracement) remains key support, while 1.3418 – a prior support now turned resistance – may act as a ceiling for any rebound attempts.
Key Takeaways:
Price has reacted positively to the 38.2% Fib level.
MACD remains weak but shows early signs of slowing downside.
RSI is attempting to reverse from near-oversold conditions.
1.3418 is the level to beat for bulls; below 1.3145 could open room to 1.2940.
Until we see a daily close above the prior support at 1.3418, upside may be limited to a corrective phase within a broader pullback. Short-term bullish attempts are likely to remain fragile unless supported by improving momentum and a reclaim of the 50-day SMA.
-MW
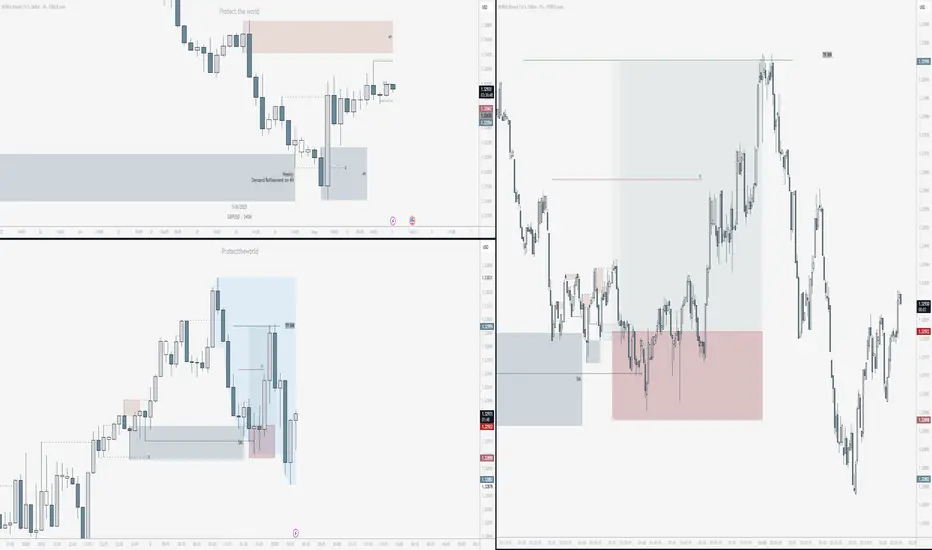
GBPUSD LONG4H supply still holding, but I expect a bullish move this week if possible.
Demand was in control on the 5M, creating a clean demand zone with a liquidity sweep.
That gave clear reason for higher prices. Dropped down to the 15s for entry.
Tapped out after 3RR was achieved.
Same system. Same pair. Same outcome.
Zero emotion. Just posting what works.
GBP/USD Professional Analysis – “Trap Trigger at Support”GBP/USD Professional Analysis – “Trap Trigger at Support”
📈 Market Overview:
• Pair: GBP/USD
• Timeframe: Likely 1H or 2H based on candle spacing
• Date: July 28, 2025
• Current Price: 1.33529
⸻
🔍 Technical Breakdown
🔴 Resistance Zone: 1.35800 – 1.36200
• Strong supply area where the last bullish impulse failed.
• Price got rejected hard, initiating a new downtrend.
• Sell-side pressure was confirmed with Supertrend turning red.
🟤 Support Zone: 1.32860 – 1.33400
• Major demand area where price previously reversed sharply.
• Currently being tested again after a clean sweep into the Trap Trigger zone.
⚠ Trap Trigger Zone (Liquidity Sweep Area):
• Price wicked just below support, tapping into a low-volume/high-liquidity area.
• This wick likely cleared sell-side liquidity and trapped breakout sellers.
• Followed by a bullish rejection wick, implying smart money accumulation.
⸻
🛠 Indicators & Tools:
• Supertrend (10,3): Currently red, indicating short-term bearish momentum.
• However, if price closes above 1.34032 (Supertrend level), it could flip bullish.
• Volume Profile (VRVP):
• Low-volume node under support suggests a quick “stop hunt” move, not genuine selling.
• High-volume acceptance area sits higher, near 1.34500–1.35000.
⸻
🎯 Forecast:
🔴 Bearish Invalidations:
• Price closing below 1.32860 with volume would invalidate this setup.
• That could signal continuation to deeper liquidity (1.32500 or below).
⸻
🧠 Smart Money Perspective:
• Liquidity engineered beneath support
• Trap Trigger activated — ideal for institutional reversal setups
• This is a classic “Stop Hunt → Reclaim → Expand” model

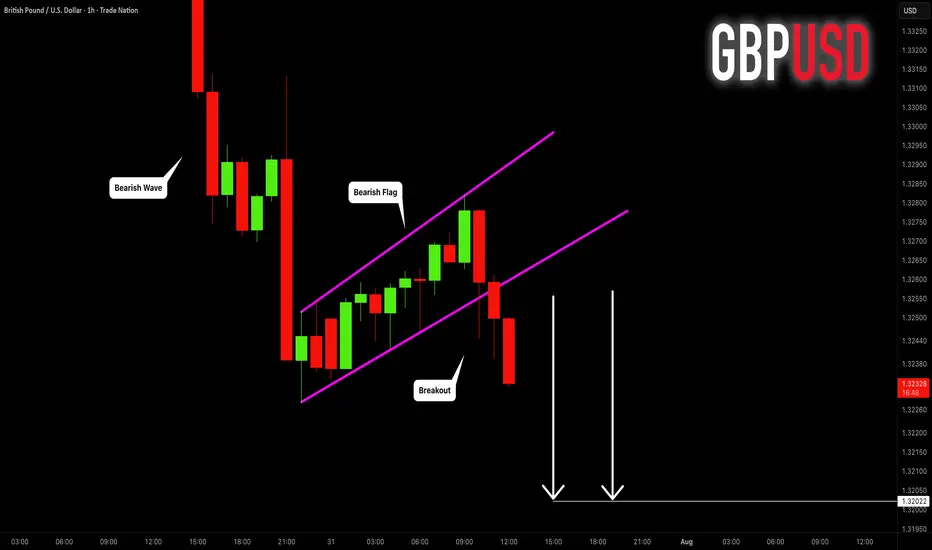
GBPUSD: Strong Trend-Following Pattern 🇬🇧🇺🇸
GBPUSD is going to drop lower.
The market has completed a correctional movement within
a bearish flag.
Its support violation provides a strong bearish confirmation.
I expect a drop to 1.3202 level.
❤️Please, support my work with like, thank you!❤️
I am part of Trade Nation's Influencer program and receive a monthly fee for using their TradingView charts in my analysis.
GBPUSD short term key levelsThese are short term key levels for intra day and swing trading on 1h chart.
1.3795
1.3541
1.3384
1.3264
1.3129
1.2948
1.2718
GBPUSD Week 31 Swing Zone/LevelsPEPPERSTONE:GBPUSD keeps giving and simply does.
Strategy for this week is highlighted; sell at the zone and look for buy around 33683.
Zones/Levels are calculated based previous Week X's difference High & Low (dHL)
Trade Parameters:
sl: 10-15pips
dTP: dynamic TP means because momentum can push fast past say 33683, TP is a soft target. However typically 5-10x
As always price action determines trades.

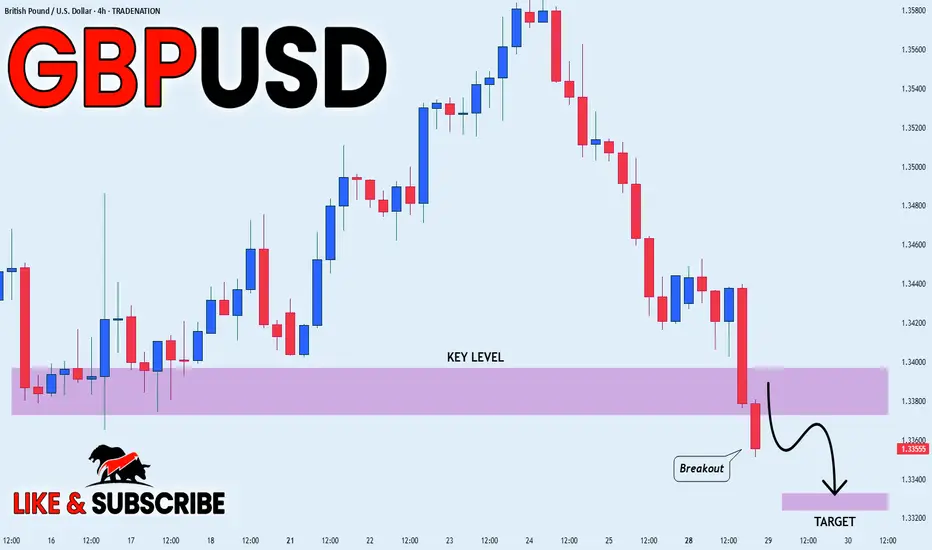
GBP_USD BEARISH BREAKOUT|SHORT|
✅GBP_USD is going down currently
As the pair broke the key structure level of 1.3380
Which is now a resistance, and after the pullback
And retest, I think the price will go further down
SHORT🔥
✅Like and subscribe to never miss a new idea!✅
Disclosure: I am part of Trade Nation's Influencer program and receive a monthly fee for using their TradingView charts in my analysis.
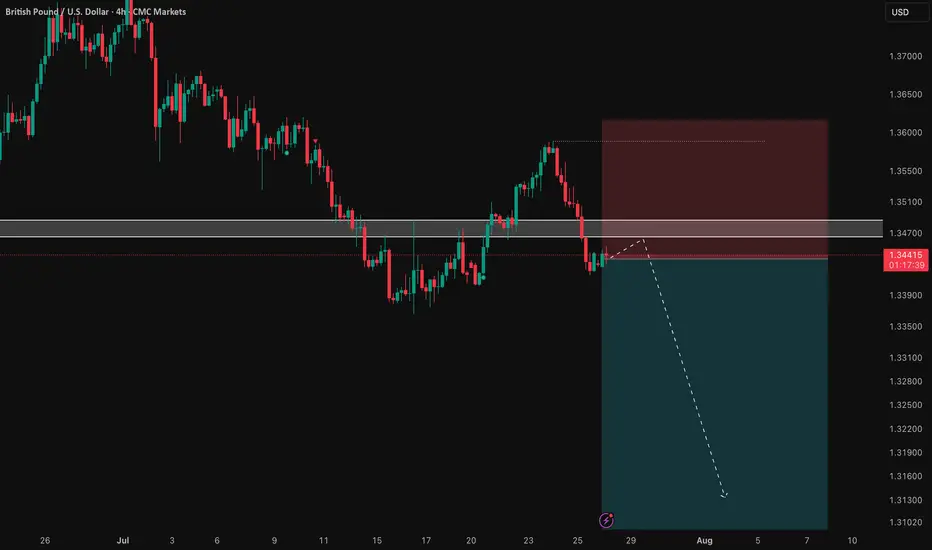
GBP/USD: Following the Bearish Trend to a Key LevelSharing my perspective on a potential short setup in GBP/USD.
This view is based on a combination of weakening UK fundamentals and a clear bearish technical structure.
📰 The Fundamental View
The main driver here is the growing difference in monetary policy. The Bank of England is signaling a more dovish stance due to recent soft economic data out of the UK. In contrast, the US economy is showing more resilience, which may keep the Federal Reserve on a less aggressive easing path. This fundamental divergence puts downward pressure on the Pound versus the Dollar.
📊 The Technical Picture
The chart supports this bearish bias. We can see a clear downtrend in place, defined by a series of lower highs and lower lows. Price is currently trading below its key moving averages, which often act as dynamic resistance. The critical level to watch is the 1.34377 price zone, which was a previous area of support and could now be tested as resistance.
🎯 The Strategy
The plan is to watch for bearish price action as we approach the 1.34377 key level. A rejection from this zone would provide a good opportunity to enter a short position, aiming to ride the next leg of the established downtrend.
As always, this is my own perspective. Manage your risk carefully and trade safe.
GBP_USD LONG FROM SUPPORT|
✅GBP_USD has been falling recently
And the pair seems locally oversold
So as the pair is approaching
A horizontal support of 1.3399
Price growth is to be expected
LONG🚀
✅Like and subscribe to never miss a new idea!✅
Disclosure: I am part of Trade Nation's Influencer program and receive a monthly fee for using their TradingView charts in my analysis.
GBP-USD Support Ahead! Buy!
Hello,Traders!
GBP-USD went down but
The pair will soon hit a
Horizontal support level
Of 1.3400 from where we
Will be expecting a local
Rebound and a move up
Buy!
Comment and subscribe to help us grow!
Check out other forecasts below too!
Disclosure: I am part of Trade Nation's Influencer program and receive a monthly fee for using their TradingView charts in my analysis.