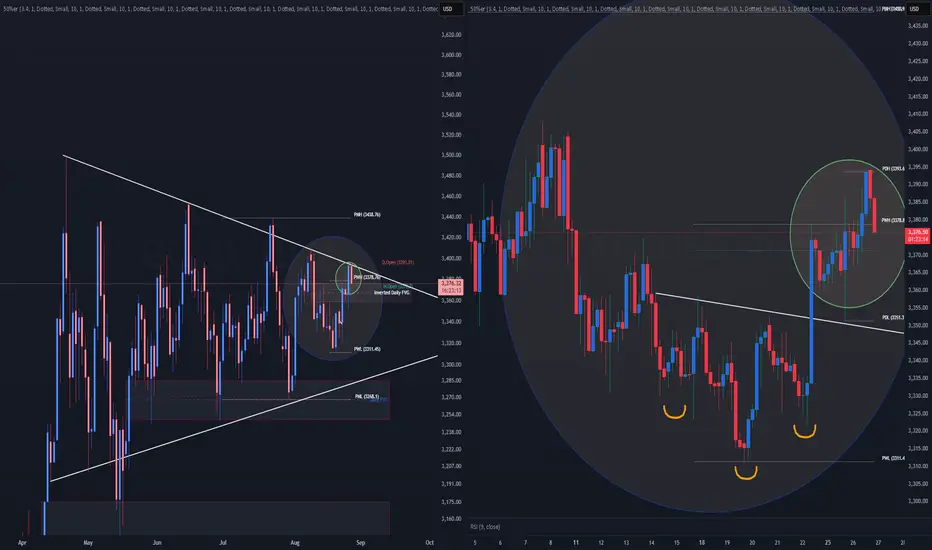
XAUUSD - Daily and 4hr | Charts are bullish Daily:
Gold is back in the upper range of this consolidation zone. You can see the high of the range is 3440, and the low is 3250 roughly.
Gold is clearly making a bullish pennant pattern. When gold reached the top trend line, we expected a breakout. Once again, we are finding resistance. (as of now)
4-Hour
Inverted Head and Shoulders - Simple trading
Gold broke out of an inverted head and shoulders pattern and just hit the target at 3395. Gold is now finding resistance and failing to find support.
Bulls:
Gold is pulling back into an Inverted FVG on the Daily. If the price is bullish, then we should reject the gap with ease. (Gap is from 3360-3376) Gold is on the brink of a daily breakout or another rejection back down to support.
Bears:
If Gold continues to fall with clean displacement through support. We can say the news from last week was false, and gold is still trending bearish. expect a fall back down to 3320
#gold#commodities
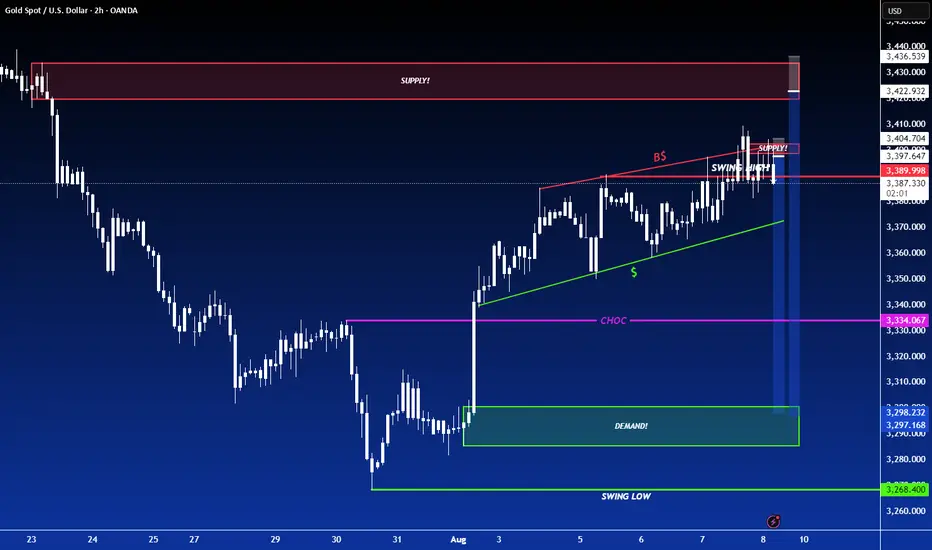
SHORT ON GOLD (XAU/USD)GOLD has a nice rising channel which is a (BEARISH) reversal pattern with plenty of sell side liquidity to be captured to the downside.
I sold GOLD at 3397 and expect Gold to fall over $80-$100 which is 800-1000 pips.
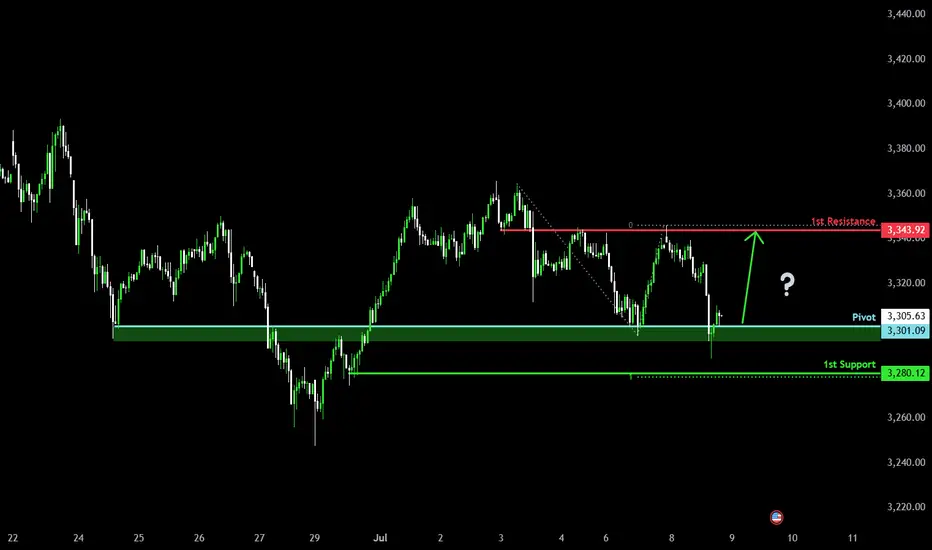
Bullish reversal off major support?The Gold (XAU/USD) has bounced off the pivot and could rise to the 1st resistance which is an overlap resistance.
Pivot: 3,301.09
1st Support: 3,280.12
1st Resistance: 3,343.92
Risk Warning:
Trading Forex and CFDs carries a high level of risk to your capital and you should only trade with money you can afford to lose. Trading Forex and CFDs may not be suitable for all investors, so please ensure that you fully understand the risks involved and seek independent advice if necessary.
Disclaimer:
The above opinions given constitute general market commentary, and do not constitute the opinion or advice of IC Markets or any form of personal or investment advice.
Any opinions, news, research, analyses, prices, other information, or links to third-party sites contained on this website are provided on an "as-is" basis, are intended only to be informative, is not an advice nor a recommendation, nor research, or a record of our trading prices, or an offer of, or solicitation for a transaction in any financial instrument and thus should not be treated as such. The information provided does not involve any specific investment objectives, financial situation and needs of any specific person who may receive it. Please be aware, that past performance is not a reliable indicator of future performance and/or results. Past Performance or Forward-looking scenarios based upon the reasonable beliefs of the third-party provider are not a guarantee of future performance. Actual results may differ materially from those anticipated in forward-looking or past performance statements. IC Markets makes no representation or warranty and assumes no liability as to the accuracy or completeness of the information provided, nor any loss arising from any investment based on a recommendation, forecast or any information supplied by any third-party.
Bullish reversal off 50% Fibonacci support?The Gold (XAU?USD) has bounced off the pivot and could rise to the 1st resistance which acts as a pullback resistance.
Pivot: 3,374.04
1st Support: 3,348.45
1st Resistance: 3,444.62
Risk Warning:
Trading Forex and CFDs carries a high level of risk to your capital and you should only trade with money you can afford to lose. Trading Forex and CFDs may not be suitable for all investors, so please ensure that you fully understand the risks involved and seek independent advice if necessary.
Disclaimer:
The above opinions given constitute general market commentary, and do not constitute the opinion or advice of IC Markets or any form of personal or investment advice.
Any opinions, news, research, analyses, prices, other information, or links to third-party sites contained on this website are provided on an "as-is" basis, are intended only to be informative, is not an advice nor a recommendation, nor research, or a record of our trading prices, or an offer of, or solicitation for a transaction in any financial instrument and thus should not be treated as such. The information provided does not involve any specific investment objectives, financial situation and needs of any specific person who may receive it. Please be aware, that past performance is not a reliable indicator of future performance and/or results. Past Performance or Forward-looking scenarios based upon the reasonable beliefs of the third-party provider are not a guarantee of future performance. Actual results may differ materially from those anticipated in forward-looking or past performance statements. IC Markets makes no representation or warranty and assumes no liability as to the accuracy or completeness of the information provided, nor any loss arising from any investment based on a recommendation, forecast or any information supplied by any third-party.

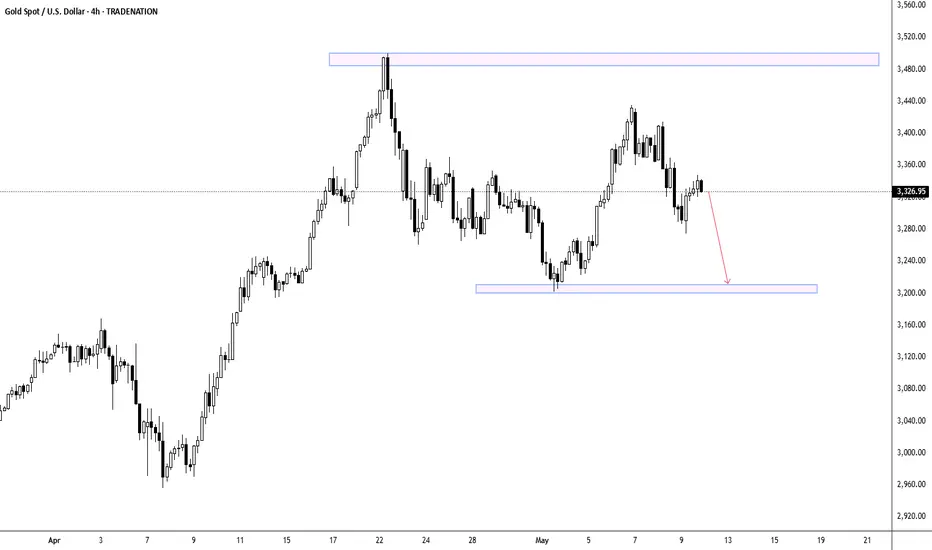
XAUUSD - $3,260 Support Level to Determine Next Directional MoveLooking at this Gold 4-hour chart, the precious metal is approaching a critical inflection point as it tests the key support zone around $3,260, which represents a confluence of previous swing lows and represents the lower boundary of the recent consolidation range. Two distinct scenarios emerge from this technical setup: first, gold could find buyers at this support level and stage a bounce back toward the $3,400 resistance area, particularly if broader market conditions favor safe-haven assets or if dollar weakness provides additional tailwinds for the metal. Alternatively, a decisive break below the $3,260 support could trigger further selling pressure and open the door for a deeper correction toward the $3,180-$3,160 zone, especially if risk appetite improves or if stronger economic data reduces demand for defensive assets. The outcome will largely depend on how price action unfolds at this crucial support level, with volume and momentum providing key clues about which scenario is more likely to play out in the near term.
Disclosure: I am part of Trade Nation's Influencer program and receive a monthly fee for using their TradingView charts in my analysis.
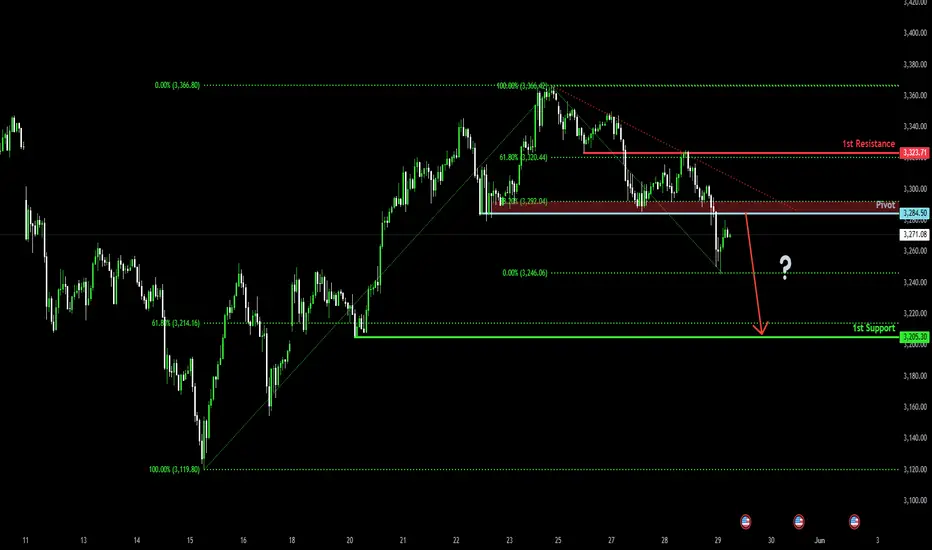
Bearish reversal off pullback resistance?The Gold (XAU/USD) is rising towards the pivot, which acts as a pullback resistance and could reverse to the 1st support, which has been identified as a pullback support.
Pivot: 3,284.50
1st Support: 3,205.30
1st Resistance: 3,232.71
Risk Warning:
Trading Forex and CFDs carries a high level of risk to your capital and you should only trade with money you can afford to lose. Trading Forex and CFDs may not be suitable for all investors, so please ensure that you fully understand the risks involved and seek independent advice if necessary.
Disclaimer:
The above opinions given constitute general market commentary, and do not constitute the opinion or advice of IC Markets or any form of personal or investment advice.
Any opinions, news, research, analyses, prices, other information, or links to third-party sites contained on this website are provided on an "as-is" basis, are intended only to be informative, is not an advice nor a recommendation, nor research, or a record of our trading prices, or an offer of, or solicitation for a transaction in any financial instrument and thus should not be treated as such. The information provided does not involve any specific investment objectives, financial situation and needs of any specific person who may receive it. Please be aware, that past performance is not a reliable indicator of future performance and/or results. Past Performance or Forward-looking scenarios based upon the reasonable beliefs of the third-party provider are not a guarantee of future performance. Actual results may differ materially from those anticipated in forward-looking or past performance statements. IC Markets makes no representation or warranty and assumes no liability as to the accuracy or completeness of the information provided, nor any loss arising from any investment based on a recommendation, forecast or any information supplied by any third-party.
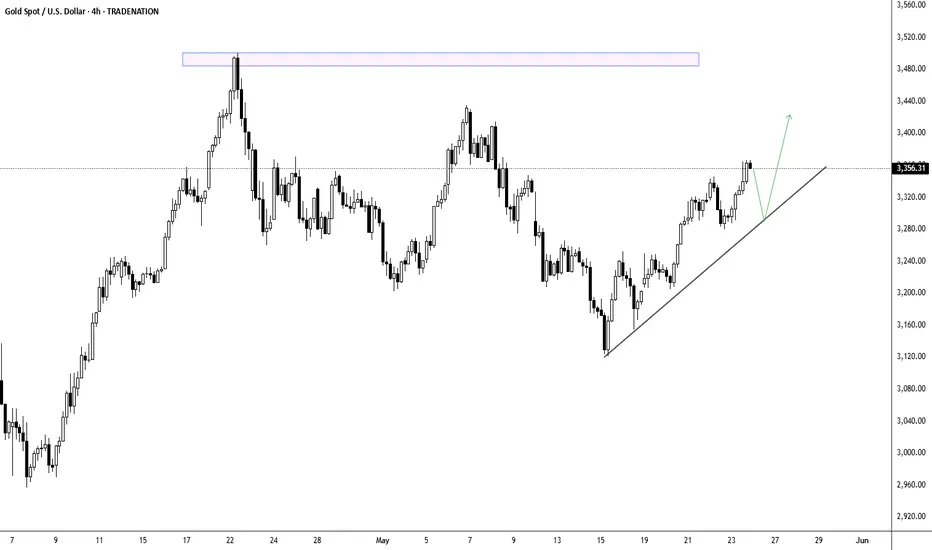
XAUUSD - Poised for Fresh Highs After Healthy Correction?Looking at this gold (XAU/USD) 4-hour chart, the precious metal appears to be in a strong bullish trend that has carried it from around $2,960 in early April to current levels near $3,356. After reaching a significant peak around $3,480 in mid-April, gold has undergone a healthy correction and consolidation phase, which is typical behavior in strong uptrends as markets digest gains and reset momentum indicators. The recent price action shows gold has found support around the $3,120 level and has begun to recover, with the current move higher suggesting the correction may be nearing completion. The overall chart structure, characterized by higher highs and higher lows, remains intact despite the recent pullback. Given the strong underlying uptrend, the successful defense of key support levels, and the recent renewed buying interest, the higher probability scenario appears to favor a continuation of the bullish momentum toward new highs, potentially targeting the previous peak around $3,480 and possibly extending toward the resistance zone highlighted in the blue rectangle near $3,500.
Disclosure: I am part of Trade Nation's Influencer program and receive a monthly fee for using their TradingView charts in my analysis.
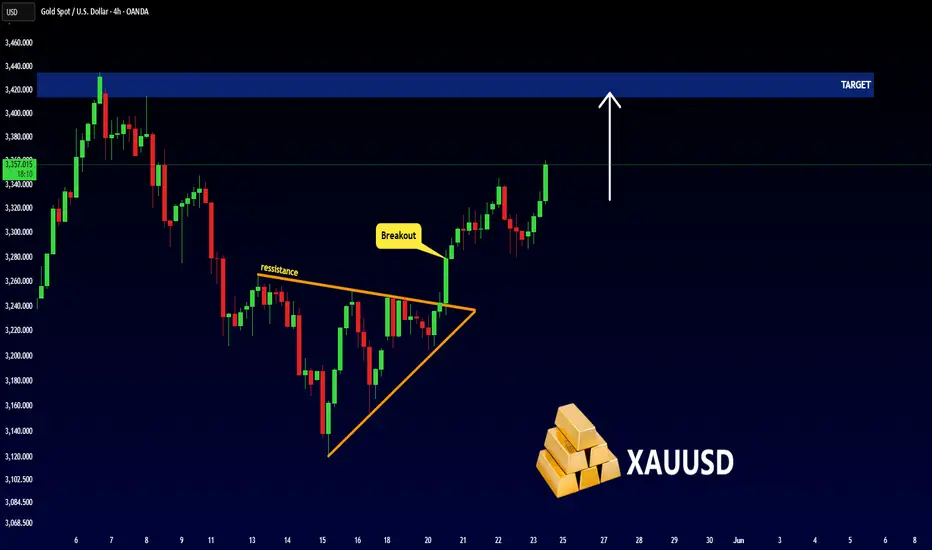
GOLD - BULLISH MOVEHello Traders !
The Gold price formed a symmetrical triangle pattern.
The resistance line is broken !
So, I expect a bullish move🚀
_______________
TARGET: 3414🎯
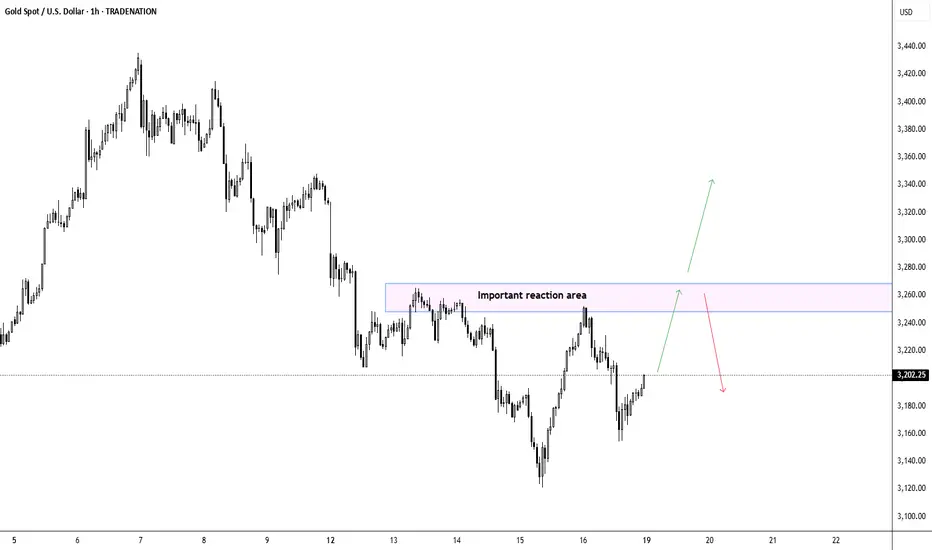
XAUUSD - Critical Reaction Zone to Determine Next Major MoveGold is currently trading at $3,202.25, showing recovery momentum after forming a recent bottom near $3,120. The price action suggests a continued upward movement toward the highlighted "important reaction area" around $3,240-3,260, which previously served as both support and resistance in mid-May. There is a high probability that price will reach this critical zone given the current bullish momentum and the established pattern of higher lows. Once gold reaches this reaction area, traders should exercise patience and closely observe how price behaves – a decisive break above could trigger an extended rally toward $3,360 as indicated by the upper green arrow, while rejection might initiate a significant correction toward $3,140 as marked by the red arrow. The market's response at this important reaction area will likely determine gold's directional bias for the next trading period, making it essential to watch for specific candlestick patterns, volume spikes, or momentum shifts before establishing new positions.
Disclosure: I am part of Trade Nation's Influencer program and receive a monthly fee for using their TradingView charts in my analysis.
GOLD - Bearish Double TOPHello Traders !
The GOLD failed to create a new higher high !
The price formed a double top pattern.
Currently, The neckline is broken !
So, I expect a bearish move📉
________________
TARGET: 3022🎯
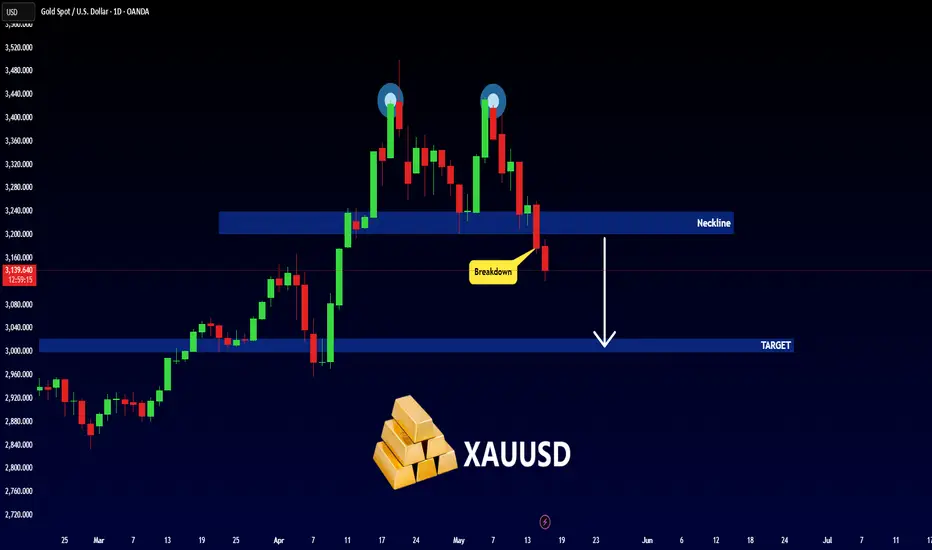
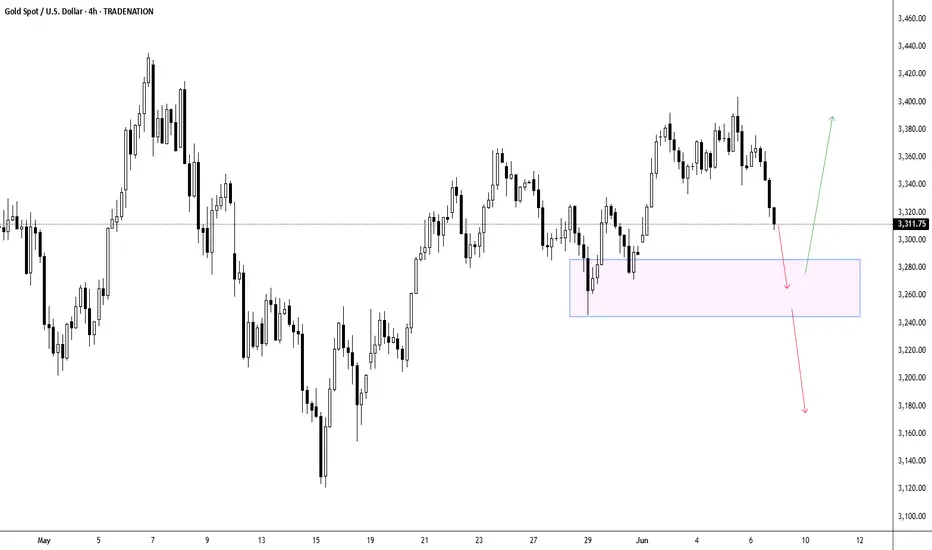
XAUUSD - Could we see $3,200?Gold appears to be showing signs of exhaustion after its impressive rally to record highs near $3,500 per ounce, with recent price action forming a potential double top pattern. The downward-pointing arrow on the chart suggests bearish momentum is building, and with the price currently hovering around $3,326, we may be witnessing the early stages of a deeper pullback toward the lower support box around $3,200. This correction would represent a healthy consolidation within gold's long-term uptrend, allowing overextended technical indicators to reset before the next potential leg higher. Fundamental factors including potential profit-taking, a temporary strengthening in the US dollar, and positioning adjustments ahead of upcoming economic data could accelerate this move toward the $3,200 target in the coming weeks.
Disclosure: I am part of Trade Nation's Influencer program and receive a monthly fee for using their TradingView charts in my analysis.
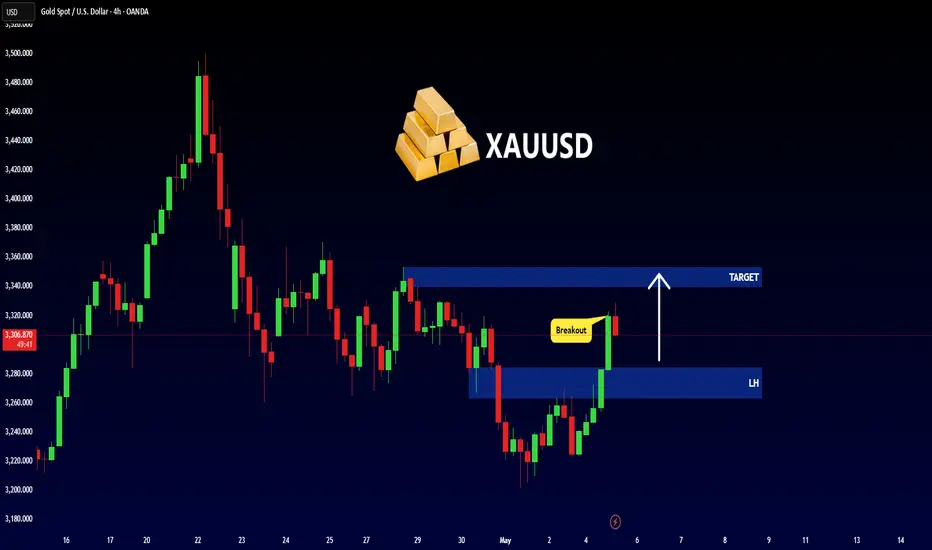
GOLD - NEW BREAKOUT !Hello Traders !
The Gold price failed to create a new lower low.
The Last lower high is broken (change of character).
So, I expect a bullish move🚀
______________
TARGET: 3340.000🎯
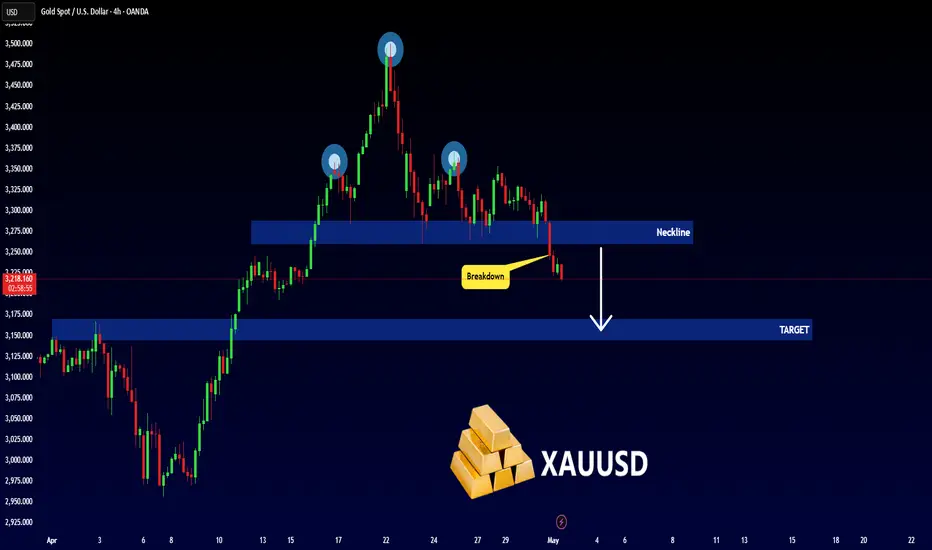
GOLD - Bearish Head and ShouldersHello Traders !
The GOLD price formed a head and shoulders pattern.
Currently, The neckline is broken !
So, I expect a bearish move📉
_______________
TARGET: 3170🎯
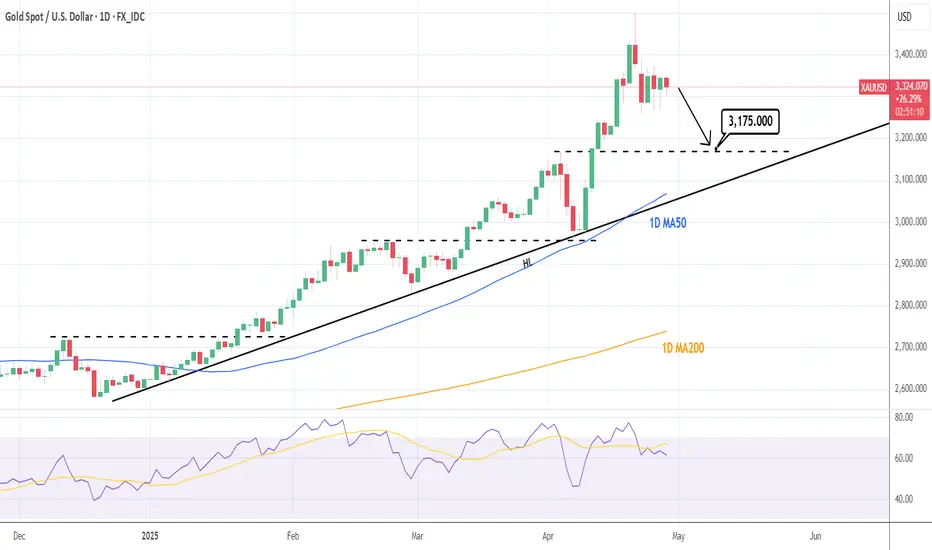
XAUUSD: Bearish towards the previous High.Gold is bullish on its 1D technical outlook (RSI = 61.142, MACD = 87.300, ADX = 39.603) but has found itself on a short term correction since last week's High. All prior short term pullbacks have tested the High that preceded them. This gives a clear bearish TP = 3,175. It is possible for the market to also make contact with the 1D MA50 there, which has been intact as a Support since January 7th.
See how our prior idea has worked out:
## If you like our free content follow our profile to get more daily ideas. ##
## Comments and likes are greatly appreciated. ##
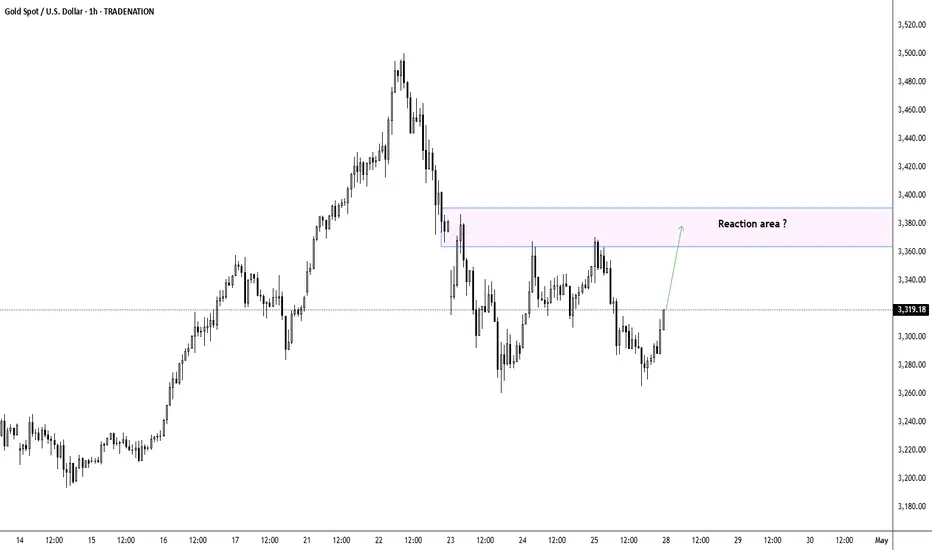
XAUUSD - All Eyes on the Reaction Zone for Directional ClarityThe Gold Spot price chart shows a clear potential for price movement toward the highlighted reaction area between approximately $3,360 and $3,380. After reaching highs around $3,500 on April 22, gold has experienced a significant correction, forming a series of lower highs and lows. The current price action suggests that gold may be preparing for a rebound toward this critical reaction zone, as indicated by the upward green arrow. Once gold reaches this reaction area, traders will need to closely monitor price behavior for confirmation of whether this represents a temporary bounce in a larger downtrend or the beginning of a new push toward previous highs. Key technical indicators at this level will determine if gold has enough momentum to break through resistance and potentially retest recent highs, or if sellers will emerge again, forcing another leg down toward recent support levels around $3,270-$3,280.
Disclosure: I am part of Trade Nation's Influencer program and receive a monthly fee for using their TradingView charts in my analysis.
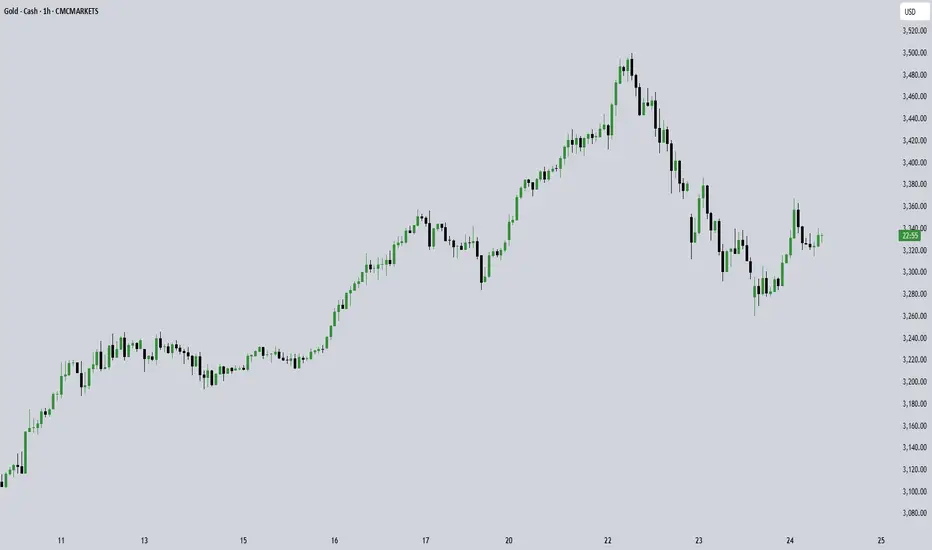
Gold’s upside seems limited given overbought conditionsGold appears to be showing signs of finally cracking after an impressive run higher, with the excitement surrounding its rally potentially approaching a crescendo. The precious metal experienced a sharp intraday reversal on 22 April, a decline that continued into 23 April. Since the recent uptrend began in mid-March, gold has consistently found support at its 10-day exponential moving average (EMA).
For now, gold continues to hold just above this key support level; a break below the 10-day EMA could signal a heightened risk of further declines, potentially targeting $3,280 per troy ounce.
Gold remains extremely overbought on the weekly chart, trading above the upper Bollinger Band, with the relative strength index (RSI) above 80. This suggests that gold could be due for a sideways consolidation or pullback towards the 10-week moving average at $3,100.
Gold also remains overbought on the monthly chart, trading above the upper Bollinger band and with an RSI above 85. In this scenario, a break below $2,900 may lead to a decline towards the 10-month moving average of $2,800.
It is not often that an asset class trades at such extreme levels, and this suggests that gold may be overdue for a period of consolidation, either by trading sideways and marking time or by pulling back to retest some of the moving averages situated at lower levels. It continues to indicate that overall gold’s upside may be limited.
Written by Michael J Kramer, founder of Mott Capital Management
Disclaimer: CMC Markets is an execution-only service provider. The material (whether or not it states any opinions) is for general information purposes only and does not take into account your personal circumstances or objectives. Nothing in this material is (or should considered to be) financial, investment or other advice on which reliance should be placed.
No opinion given in the material constitutes a recommendation by CMC Markets or the author that any particular investment, security, transaction, or investment strategy is suitable for any specific person. The material has not been prepared in accordance with legal requirements designed to promote the independence of investment research. Although we are not specifically prevented from dealing before providing this material, we do not seek to take advantage of the material prior to its dissemination.
CVVUF-Odds Favor a Resolution to the Upside Barring an imminent or protracted recession, CVVUF looks ready to confirm a close out and above this massive bullish pattern

XAUUSD: 1H Channel Up bottomed and is rebounding for the new HHGold is neutral on its 1H technical outlook (RSI = 52.820, MACD = 3.110, ADX = 23.525) and as it just crossed under its 1H MA50 and rebounded, we have the conditions for the new bullish wave of the short term Channel Up. We are aiming for another +4.45% rise (TP = 3,425).
## If you like our free content follow our profile to get more daily ideas. ##
## Comments and likes are greatly appreciated. ##

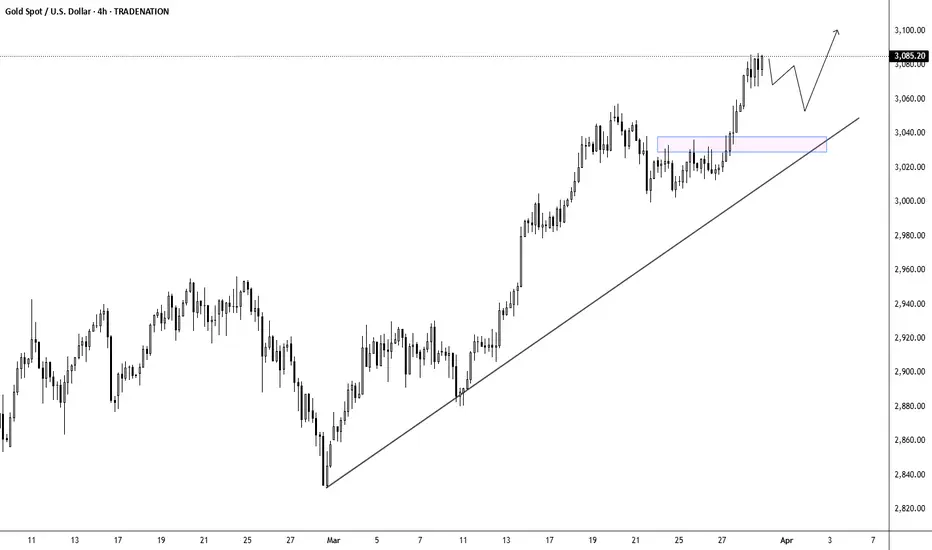
XAUUSD - Uptrend is strong, pullback for buysThe gold market is displaying remarkable strength, with the XAU/USD pair recently breaking above the $3,085 level to establish new historical highs. The upward trajectory has been supported by a robust ascending trendline dating back to late February, indicating persistent bullish momentum. While the immediate trend remains decidedly positive, technical indicators suggest a potential short-term correction may be forthcoming, which would likely present advantageous buying opportunities for traders. The highlighted support zone around $3,030-$3,040 could serve as an ideal entry point for those looking to establish long positions, with the expectation that after this healthy pullback, gold will resume its upward march toward the projected target of $3,100 and potentially beyond.
Disclosure: I am part of Trade Nation's Influencer program and receive a monthly fee for using their TradingView charts in my analysis.
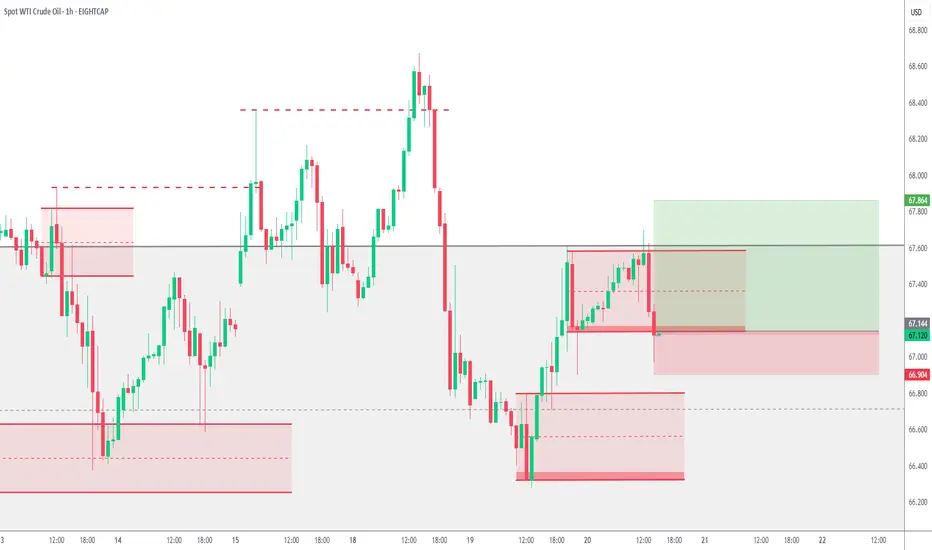
USoil Buy USOUSD buy signal on H1 chart. Price is on the top of daily resistance but h1 chart is bullish , we can try to catch this bullish move. Risk reward 1/3
XAUUSD One more push to 3100 to price the Top.Gold (XAUUSD) continues to trade within its 2025 Channel Up, in fact the uptrend started a little bit sooner on the November 14 2024 bottom. As we've mentioned before and you can see again today, this is a recurring pattern which has been in effect since October 2022, the bottom of the Inflation Crisis.
This involves the market forming Channel Up patterns of around +20% price increase, which are supported by the 1D MA50 (blue trend-line) and when that breaks, they bottom around the 0.382 Fibonacci retracement level and then turn into a buy opportunity for the next Channel Up.
The 1D RSI Double Tops and signals the price (Channel Up) High. It's first Top is where Gold is right now, typically within the 0.5 - 0.382 Fib Zone. The only time it was above the 0.382 Fib, was when it rose by +22%. As a result, we expect a similar course and a price peak around $3100 but the most effective sell signal remains when the 1D RSI Double Tops.
-------------------------------------------------------------------------------
** Please LIKE 👍, FOLLOW ✅, SHARE 🙌 and COMMENT ✍ if you enjoy this idea! Also share your ideas and charts in the comments section below! This is best way to keep it relevant, support us, keep the content here free and allow the idea to reach as many people as possible. **
-------------------------------------------------------------------------------
Disclosure: I am part of Trade Nation's Influencer program and receive a monthly fee for using their TradingView charts in my analysis.
💸💸💸💸💸💸
👇 👇 👇 👇 👇 👇

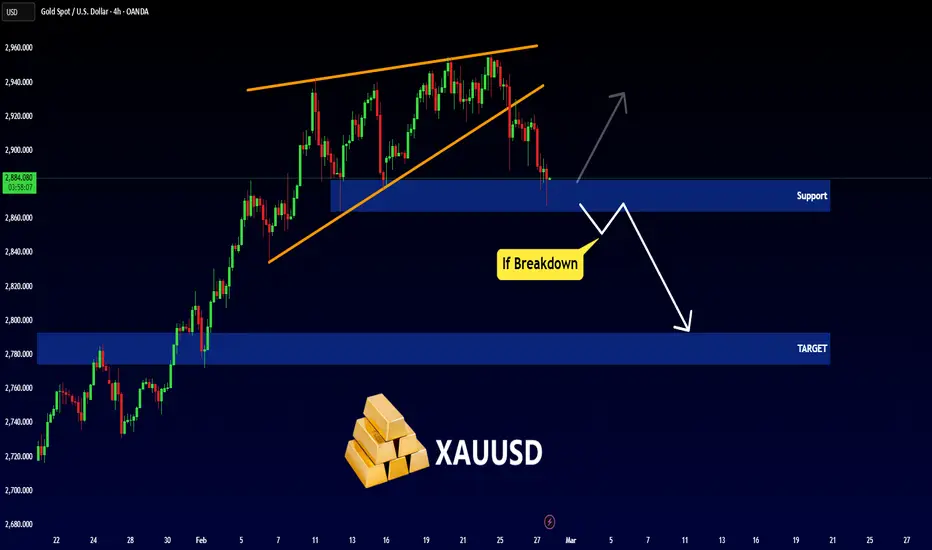
GOLD - BEARISH SCENARIOHello Traders !
The GOLD price formed a falling rising wedge.
So, Let's expect the Bearish Scenario📉
if the market breaks the support level (2864 - 2882) and closes below that,
We will see a huge bearish move📉
__
TARGET: 2793🎯
Uranium is Ready to begin its Easy PhaseUranium has been correcting and frustrating traders for 14 months. The sentiment levels should be reset now after correcting and the easy money phase of maybe a year is near.
