ASX 200 Looks Set to BounceThe ASX 200 has drifted lower since its latest record high was set six days ago. 8500 held as support before doji formed on Tuesday to mark a false break of this key level. ASX 200 futures also tried but failed to break beneath it overnight.
Given the bullish divergence on the 1-hour RSI (14) and RSI (2), the bias is to seek dips towards 8500 for a cheeky long towards the December high.
Matt Simpson, Market Analyst at City Index and Forexc.com
#spoos

SPX500 Shorts From Yesterdays Idea, this played out taking out BSL. Now looking for RTO to GCF & FVG to enter & take this down to low of Daily FVG like I mentioned yesterday. Will be taking partials along the way. May go 2% & then leave 0.75% running.
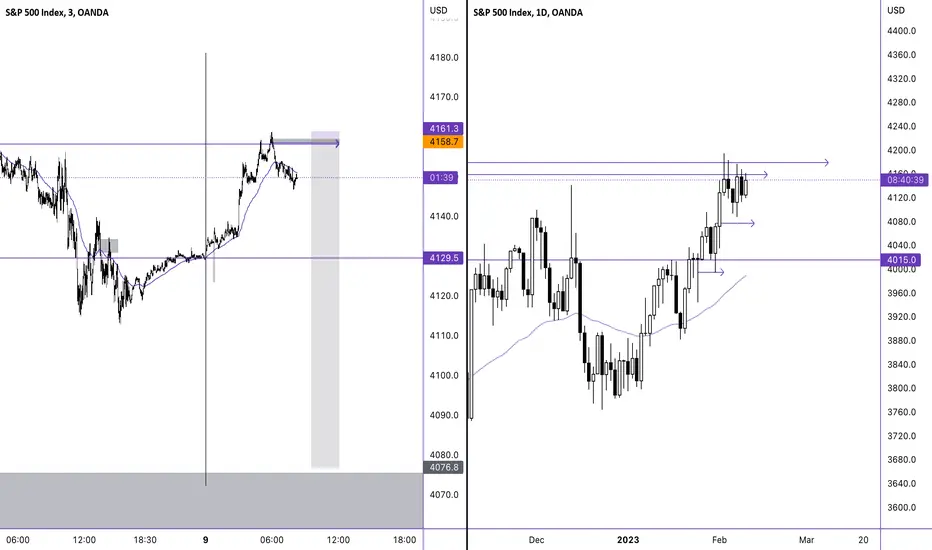
$ES maybe exhausted here. hung on daily POC here.would like to see retest of 85,00s tbh but would be > happy w/a close under 72,50. when in doubt, zoooooom out!

$SPX - What's next?$SPX - What's next?
Important data coming out this week out of US as well as Powell tonight it would be a surprise if he's dovish I'd personally like a pull back in US indices and to get back in long, this principle is validated with metals as well, let's not forget NFP...
As the market is forward looking, we have seen DXY decline as rates will be declining in the future as the recession heads further, the data is establishing weaker in certain areas. However, technically we are at a key area, do we pull back or do we extend further to the downside. AUD as china may open may benefit AUD - Keep a key eye as well as confluence of Indices and precious metals.
The key pairs I am looking into going overall:
DXY
EUR
YEN
AUD
XAU
SPX
DAX
Looking for pull backs to go back into the trend at suitable levels matching my trade plan! Medium term positioning.
All the best,
Trade Journal
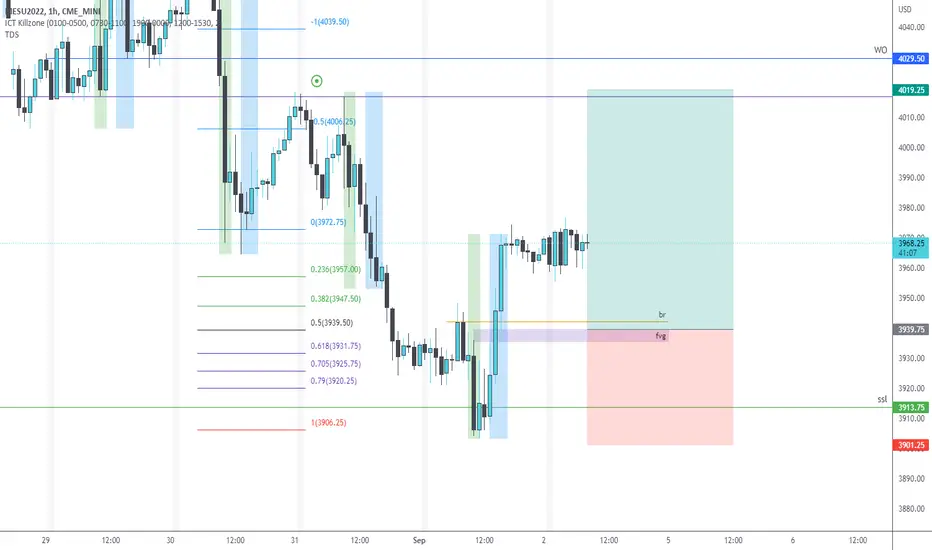
MESU LongCME_MINI:MESU2022
Current market structure, sell-side was taken with a displacement to the upside. Entering long after 8:30am on a return to a discount relative to the current trading range. Stop placement below 3903.25, targeting previous day high. Keeping the risk low because of non-farm payroll. Anything can happen!
S&P500 Bullish Setup - To run This week - TP to be hit by FRIDAYS&P500 Bullish Setup - To run This week - TP to be hit by FRIDAY
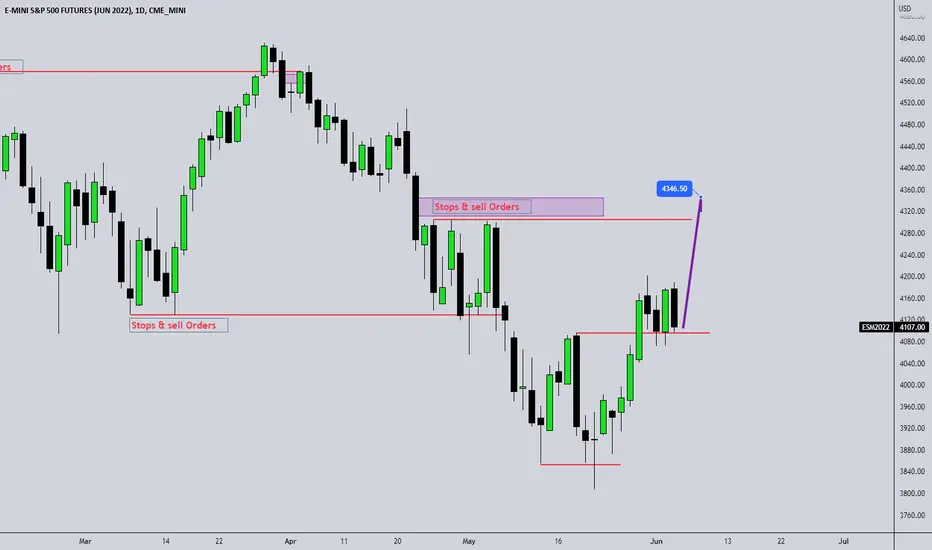
SP500 path and directionHello everyone
This is my SP500 idea for daily time frame
watch key notes for more detail on chart
for any question feel free to ask :) good luck
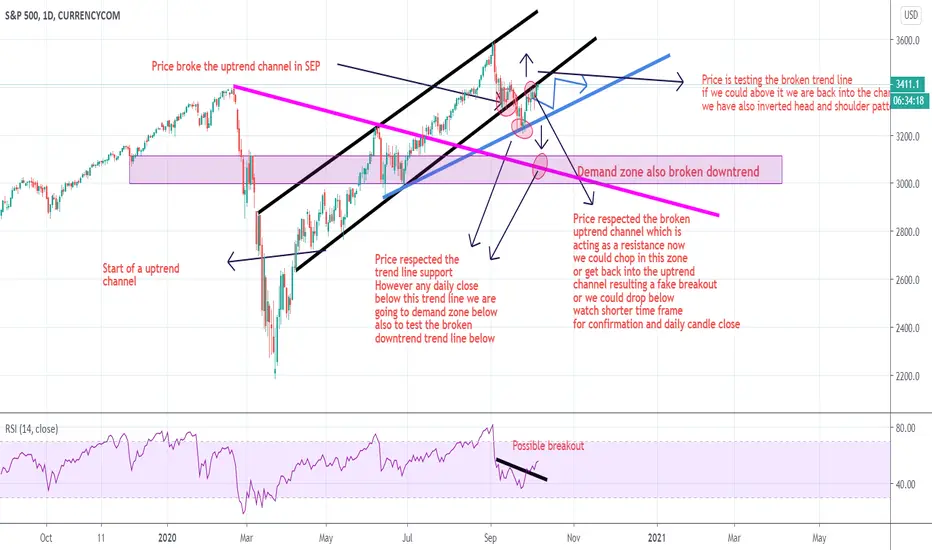
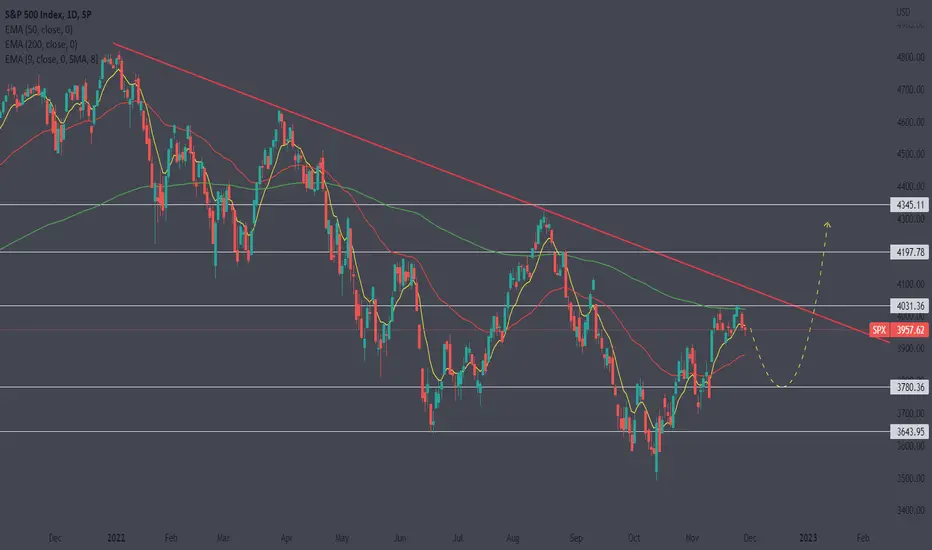
SP500 path and directionHello everyone
Sp500 started a uptrend channel in April however in SEP we broke this uptrend channel but
SP500 found support on the blue trend line and price went back to test the previous Uptrend channel
Price respected the uptrend channel resulting a doji candle that means the previous channel is acting as resistance now
Or price could get back into the channel
Or we could chop in this zone between blue trend line and previous uptrend channel
However any close below this blue trend line we are heading to demand zone below and also to test the purple broken downtrend line
feel free to ask me anything :) and good luck
Note :I see a inverted head and shoulder so far

S&P 500 Short-Term Long Setup. S&P 500 is signaling to me the formation of a short-term long setup. This is against my HTF stance of looking for 3200. For this short-term setup, I will look for 3330 and then 3370.

MeanderingSPY closed up 0.92% yesterday.
With no conviction.
SPY up bias but bulls resolve wanting.
SPOOS are giving up most of yesterday's gain, down -21 handles as of now.
Banks (BAC, MS) earnings reaction is indicated negative pre-open.
Weak XLF sure to pressure SPY to the down side in the early going.
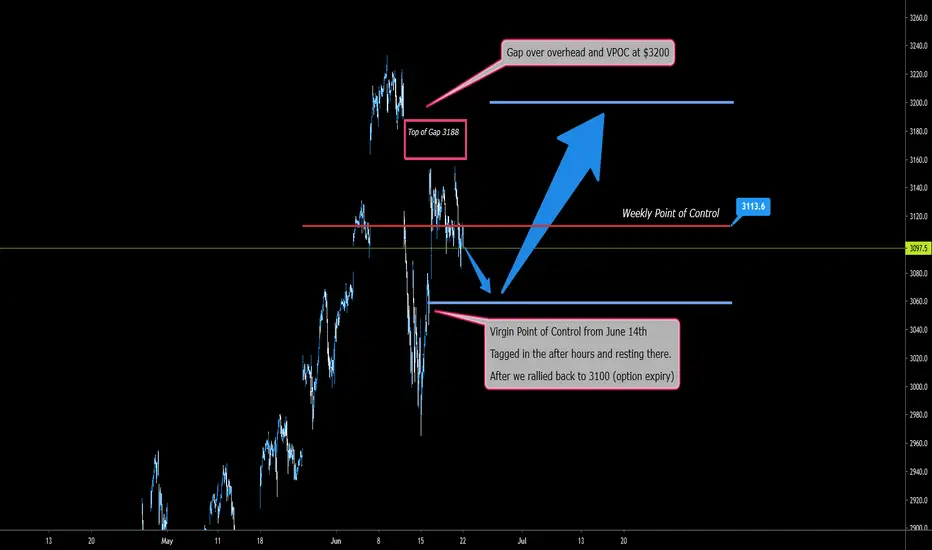
Gaps to Fill and the week ahead TVC:SPX
So the futures market after moving up from almost touching a vPOC moved back up to the 3100 range on option expiration Friday.
After hours they moved back down to touch the vPOC at 3057. This now opens 3200 as untouched vPOC, as well finishing business at 3188 to fill the gap.
Market action was weak towards the end of the week - but don't bet against another rally.
SPX Short Setup. 1:3 Risk to rewardWe can easily see that some patterns completed in SPX daiy chart. So I'm planning to go short.
PATTERNS:
1. AB=CD
2. Butterfly
3. Breakdown previous swing low
Risk-to-reward ratio: 1:3
Note: I will cover half of my position at 1:1
Disclaimer: This is not financial or investment advice
Trade safe,
Atilla Yurtseven
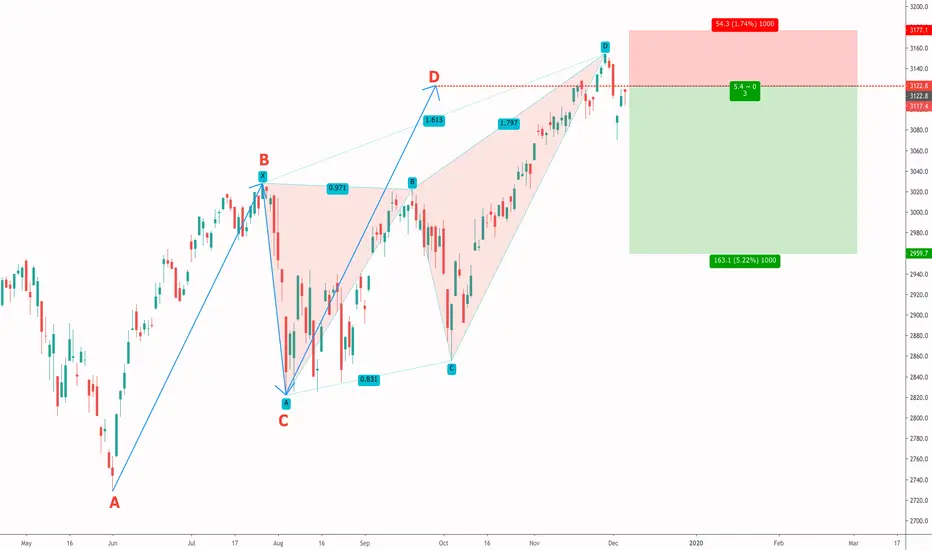
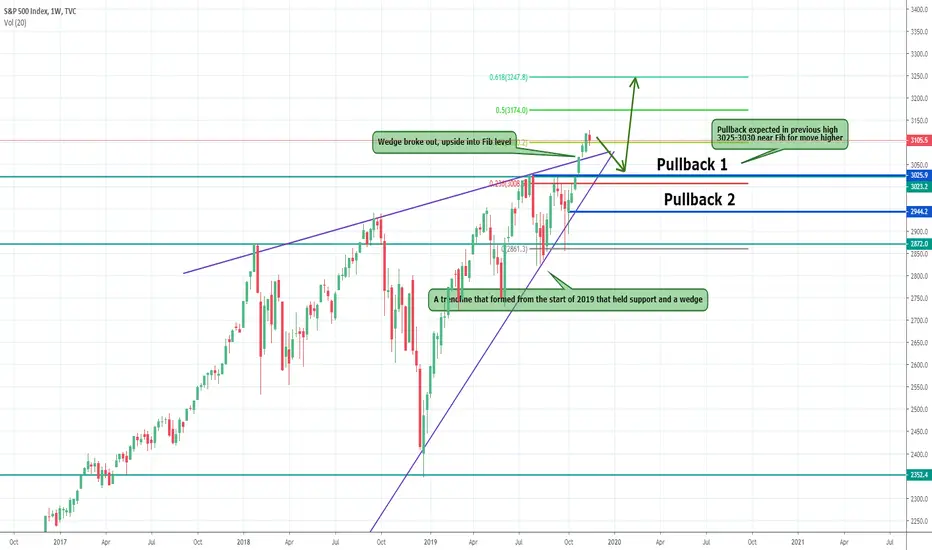
SPX pulling back for an all time high. Target 3250+ The S&P500 has had high after high over the past few weeks after breaking out of the 3025-3030 all-time high. The index has moved nearly 4% off the new highs. From here we've seen the beginning of the first red week or reversal in 6 weeks of straight gains. It's healthy for the market to pull back slightly before breaking higher. No one wants to buy a top and that is why the volume died out near the top, which caused a sell-off. There is big money waiting below for another rally.
Low-interest rates allow cheaper borrowing, stock buybacks helped assets rally and the new Quantitative Easing 4 from the Fed will all help the market continue to chug along for the next few months. However, before that we can expect a retrace.
The Fib level extension is based on the impulse that brought the price to a new high. We expect the broken all-time high at 3030 or so to hold support before we get a new all-time move into 3250.
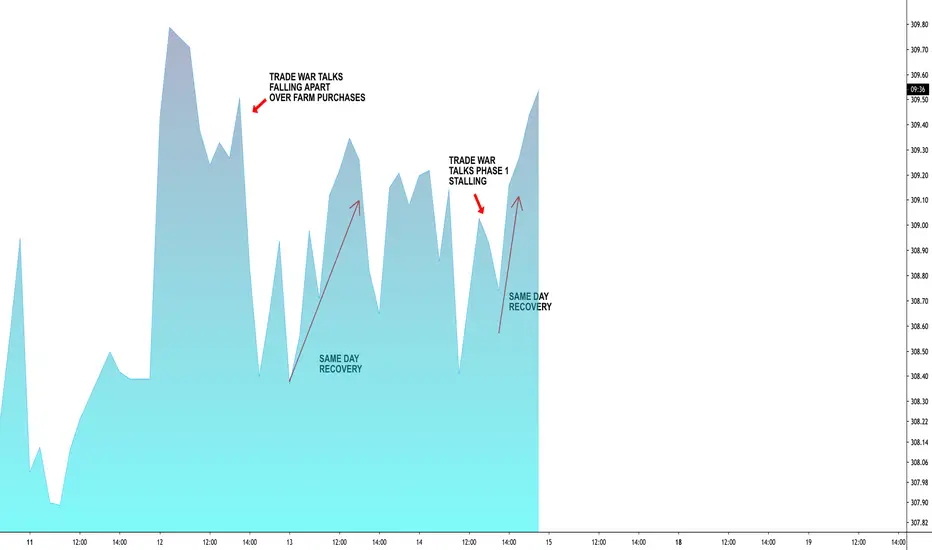
Trade War headlines waning?The days of Trade War headlines viciously bringing down markets may be over.
"Listen here grandson, back in my day a headline about the Trade War could drop spoos 1% or 2%"
Two days of headlines. Both recoveries. Also my thoughts on why: twitter.com
Spoos: Volume profile forecasts a big dropAn interesting correlation to say the least. Uncertain if chart is based on anything significant or simply an odd coincidence.


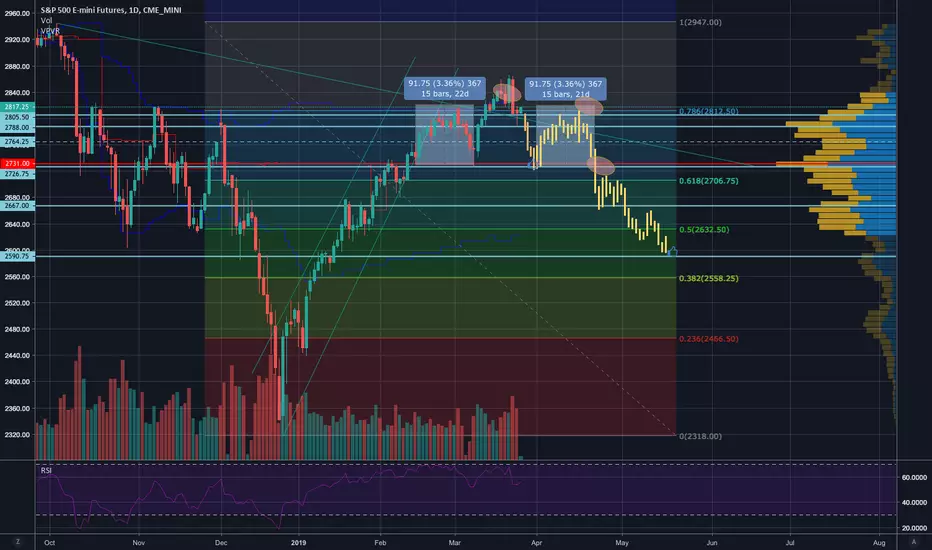
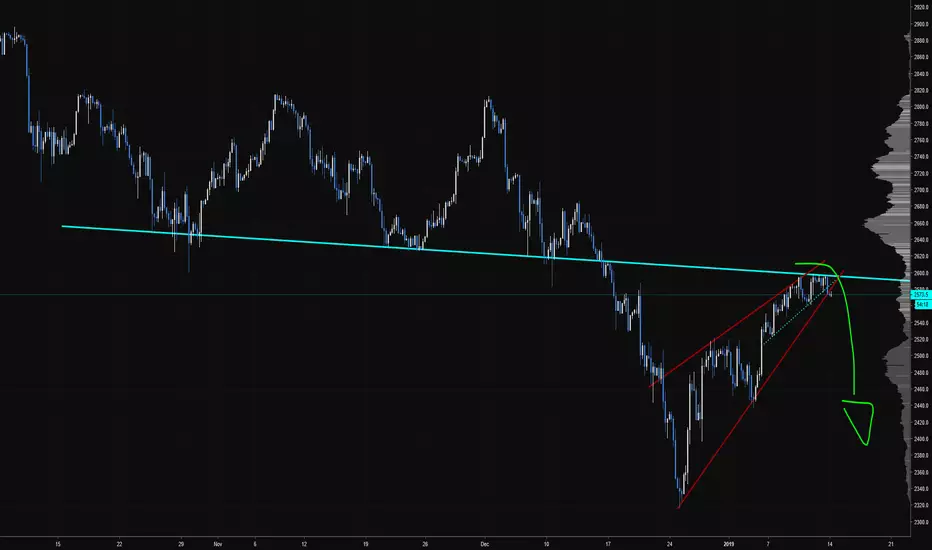
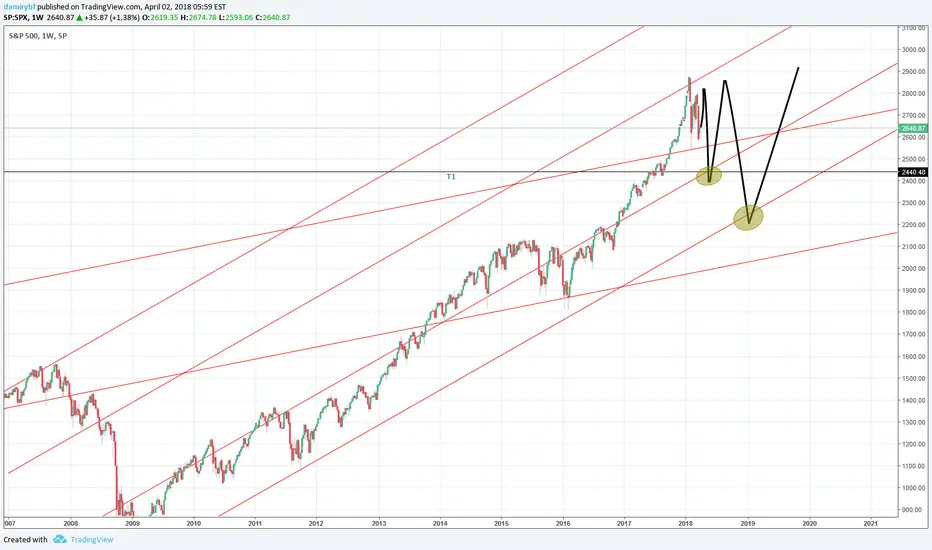
ES_F idea3 short setups I'm watching (red circles are indicative),
First one is currently in play. Looking to cover ±2730 around April 1st. Stop out when 2828-2830 is reclaimed on 1d close TF.
Let's see how the market develops. The middle part might take some extra bars, in that case will update at later stage.
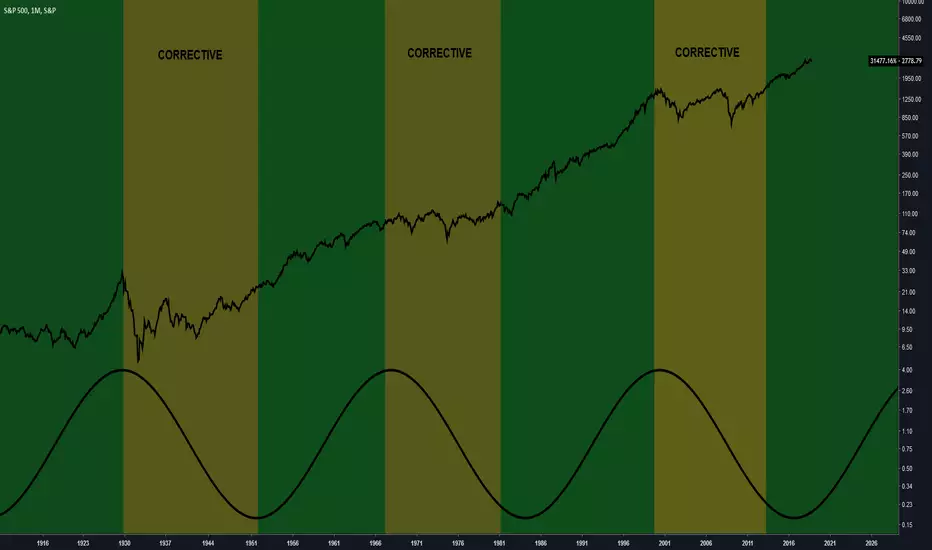
sp500 Time cycle boom-bustUnpopular opinion, but based on time cycles we may just be at a bump in the road as we apporach 30k rather than some sort of dooms day melt down.
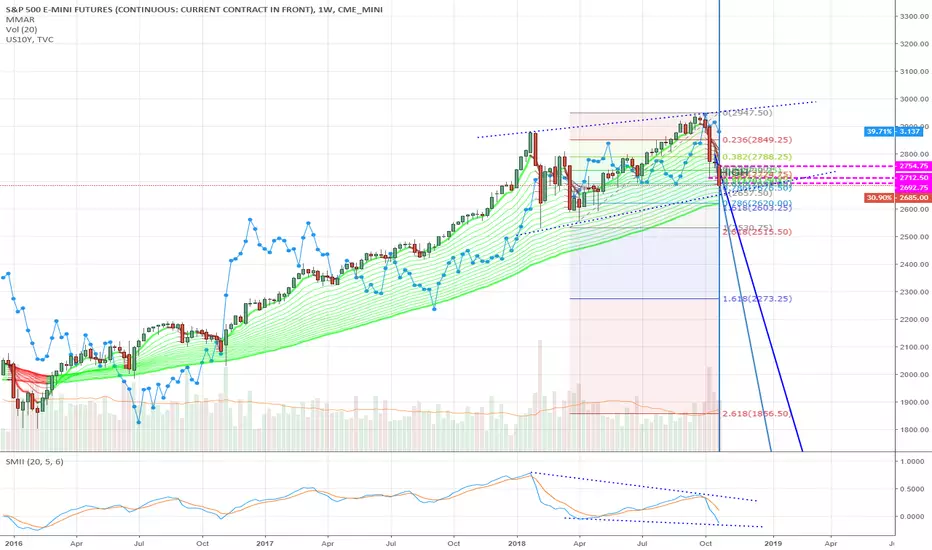
SPX (SP500) Short-Mid Term Range - Ideal CaseSP:SPX
Prior Spoos analysis avail here:
www.yellowblackflag.com
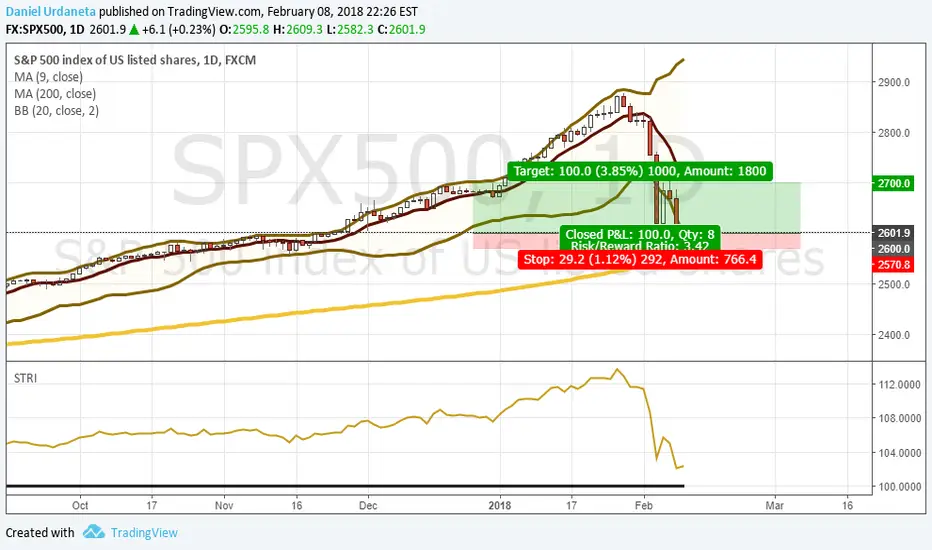
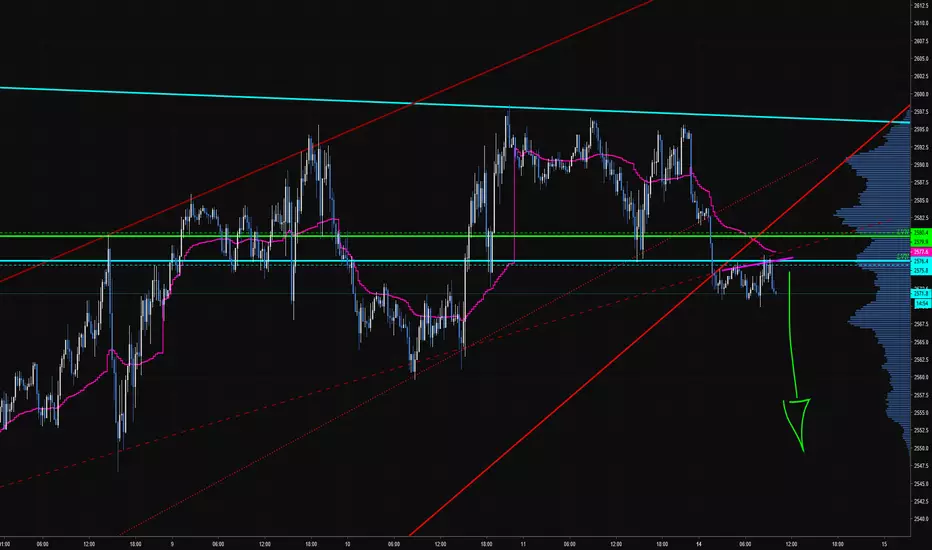
1 ES to play this bounce - All or nothingEntered with 1 ES contract today after market close. Initiated at 2600, stop 2571, target 2700. Playing for a 5-day bounce hoping that selling exhasted on the NY session.
Fundamentals: Good macro data all over the place, earnings beats, steady investor inflows, and a nice reset to P/E ratios courtesy of the -10% correction we've just experienced.
Technicals: Daily oversold (RSI) and daily lower BB. 200-day MA was tagged and a strong bid (buybacks, allegedly) emerged from there. I'm playing game theory and guessing that the smart money thinks the same and it's holding; just need retail to take a dip and the algos to ignite momo and here we gooo to 2700!
Riskiest trade to date. God help me. Feedback is welcome.