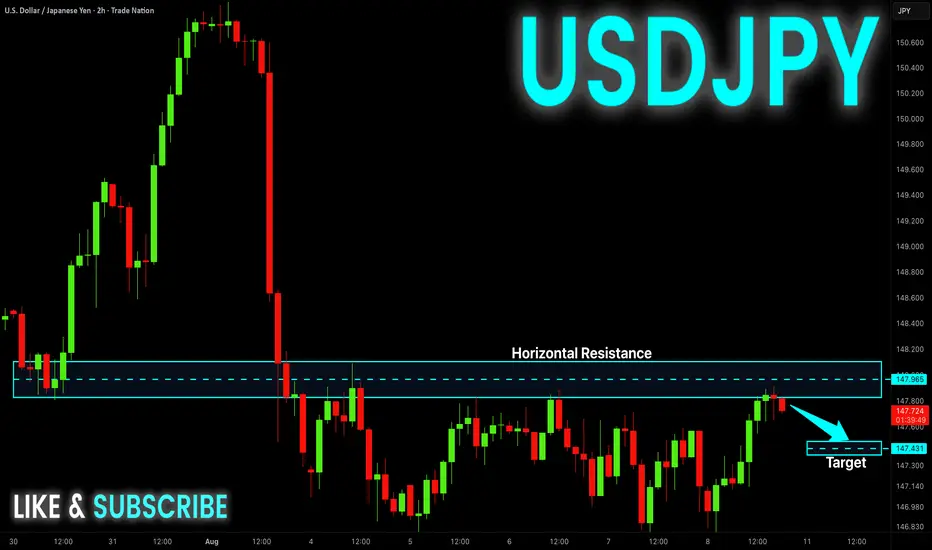
USD-JPY Local Short! Sell!
Hello,Traders!
USD-JPY made a retest
Of the horizontal resistance
Of 148.101 from where we
Are already seeing a bearish
Reaction so we will be
Expecting a further
Bearish move down
Sell!
Comment and subscribe to help us grow!
Check out other forecasts below too!
Disclosure: I am part of Trade Nation's Influencer program and receive a monthly fee for using their TradingView charts in my analysis.
#usdjpy#forex
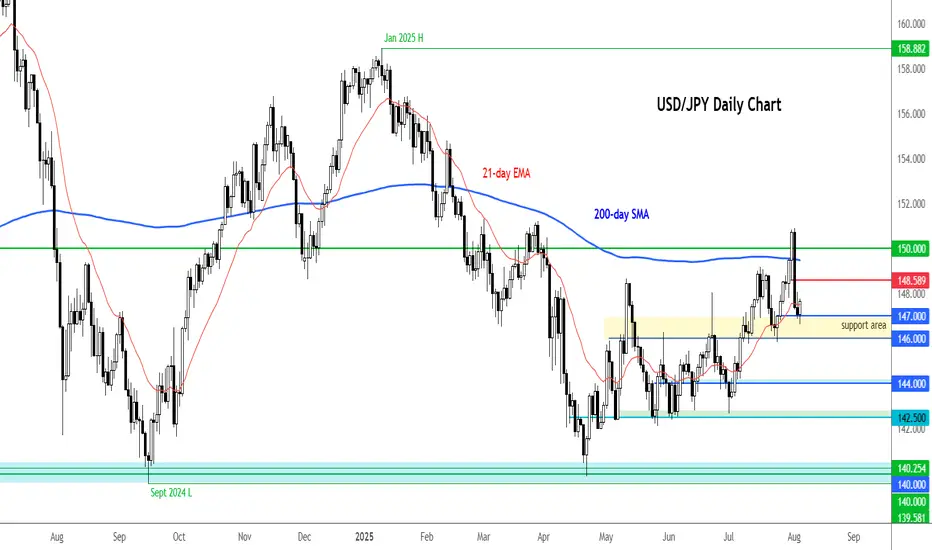
USD/JPY bounced off key support ahead of ISM surveyAfter Friday's weak jobs report and the downward revisions to prior readings, the mood shifted towards the dollar, with markets leaning towards the Fed delivering more than a couple of rate cuts this year. But we have seen a bit of a recovery in the USD since, suggesting investors are either expecting employment to pick up again or inflation to remain sticky amid higher tariffs.
Today’s attention turns to the ISM services report for July, where a modest uptick is expected. Should that materialise, it could give the dollar some further support following Friday’s wobble. We’ll also be hearing from Fed officials Susan Collins and Lisa Cook on Wednesday – and their comments may well shape expectations heading into the autumn.
Ahead of these events, the USD/JPY has bounced off the key support range we highlighted yesterday, between 146.00-147.00 area. A close below this zone would be a bearish outcome, but while it continues to hold we would favour looking for bullish trades than bearish ones. 148.60 then 150.00 are the next key levels to watch on the upside.
By Fawad Razaqzada, market analyst with FOREX.com
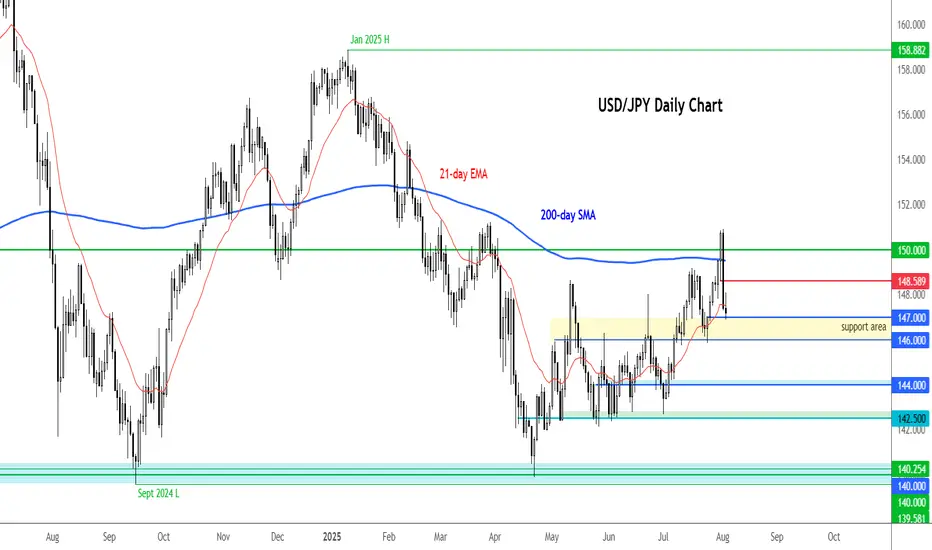
USD/JPY testing key support after Friday's dropThe USD/JPY fell sharply Friday in reaction to the weak US jobs data. But it is now testing the upside of a massive short-term support area, between 146.00-147.00. Can we see a bounce here towards 148.60 zone initially?
By Fawad Razaqzada, market analyst with FOREX.com
USDJPY My Opinion! BUY!
My dear friends,
My technical analysis for USDJPY is below:
The market is trading on 147.23 pivot level.
Bias - Bullish
Technical Indicators: Both Super Trend & Pivot HL indicate a highly probable Bullish continuation.
Target - 148.77
About Used Indicators:
A pivot point is a technical analysis indicator, or calculations, used to determine the overall trend of the market over different time frames.
Disclosure: I am part of Trade Nation's Influencer program and receive a monthly fee for using their TradingView charts in my analysis.
———————————
WISH YOU ALL LUCK

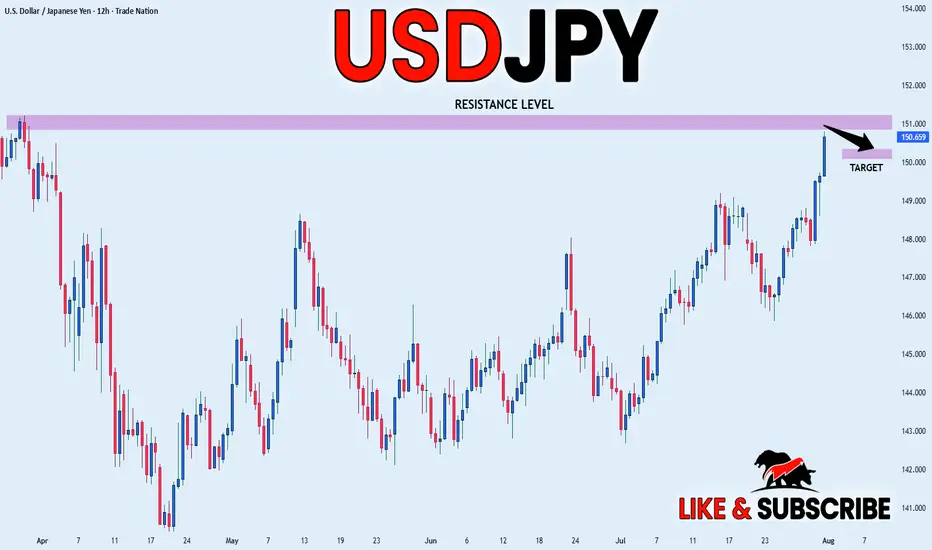
USD_JPY RESISTANCE AHEAD|SHORT|
✅USD_JPY is going up now
But a strong resistance level is ahead at 151.232
Thus I am expecting a pullback
And a move down towards the target of 150.368
SHORT🔥
✅Like and subscribe to never miss a new idea!✅
Disclosure: I am part of Trade Nation's Influencer program and receive a monthly fee for using their TradingView charts in my analysis.
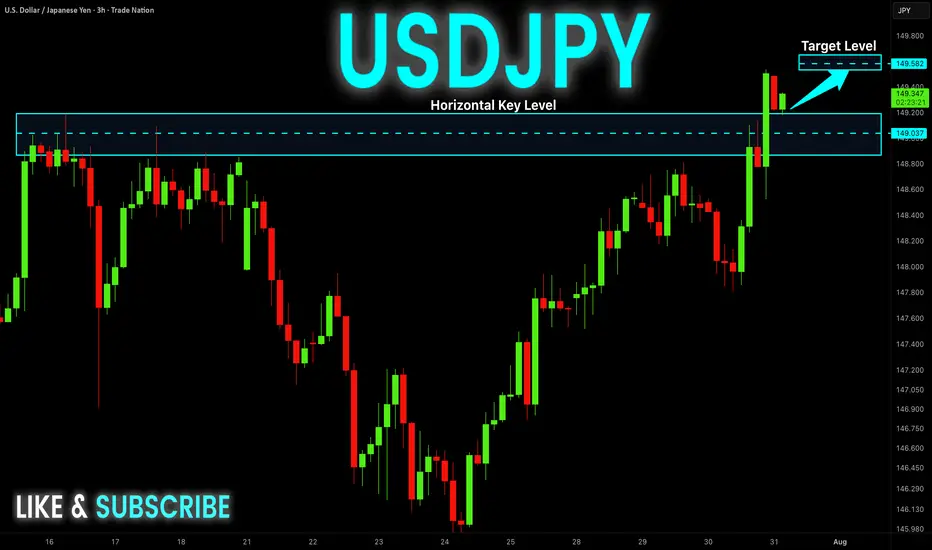
USD-JPY Will Keep Growing! Buy!
Hello,Traders!
USD-JPY keep growing and
The pair made a bullish breakout
Of the key horizontal level
Of 149.181 and the pair is
Already retesting the new
Support and we will be
Expecting a further
Bullish move up
Sell!
Comment and subscribe to help us grow!
Check out other forecasts below too!
Disclosure: I am part of Trade Nation's Influencer program and receive a monthly fee for using their TradingView charts in my analysis.
USDJPY short term key levelsThese are short term key levels on 1h chart for intra day and swing trading.
139.91
142.33
144.23
145.57
146.91
148.56
151.233

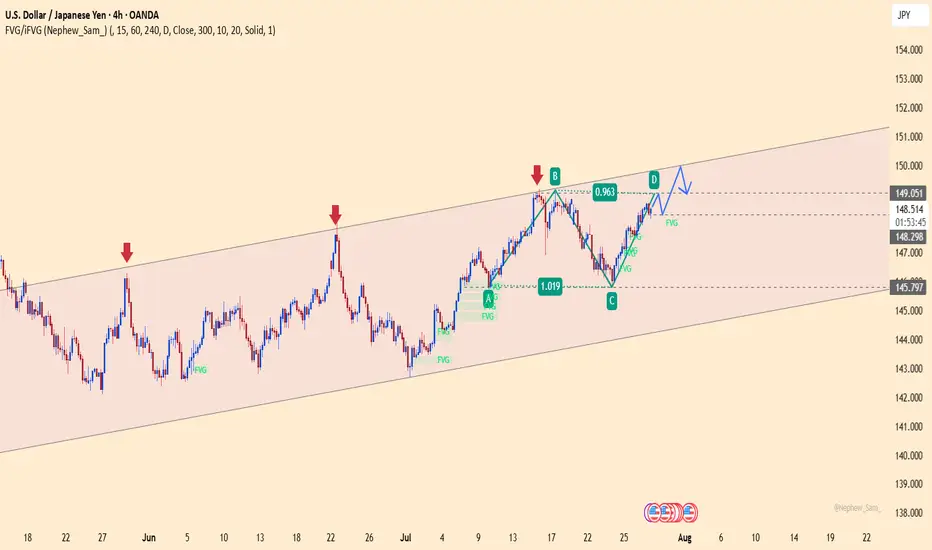
USDJPY – Bearish Pressure Builds Near Channel TopUSDJPY is approaching strong resistance around 149.900, a level that has repeatedly triggered price rejections. The ABCD structure suggests the current bullish correction may be nearing completion. If price fails to break above this zone, selling pressure could emerge.
On the news front, Japan’s core inflation remains elevated, reinforcing expectations that the BOJ will maintain its current stance. Meanwhile, the U.S. dollar is losing momentum after a series of mixed economic data releases.
Strategy: Consider SELL opportunities if clear reversal signals appear near 149.900. A short-term target lies around the 148.200 support zone. A confirmed break below this level could signal the start of a deeper bearish move.
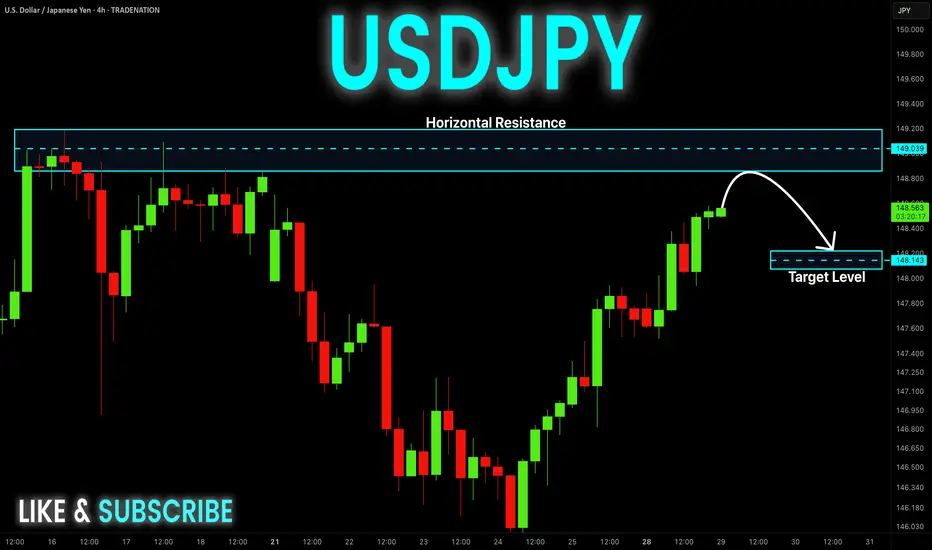
USD-JPY Is Overbought! Sell!
Hello,Traders!
USD-JPY is trading in a
Strong uptrend and the pair
Will soon hit a horizontal
Resistance of 149.200
So after the retest a
Local bearish pullback
Is to be expected
Sell!
Comment and subscribe to help us grow!
Check out other forecasts below too!
Disclosure: I am part of Trade Nation's Influencer program and receive a monthly fee for using their TradingView charts in my analysis.
USDJPY SELL
USD/JPY
Editorial Tools Latest
USD/JPY Forecast and News
share
Join
NEW
Japanese Yen hangs near multi-month low against USD ahead of Japan election on Sunday
The Japanese Yen drifts lower against its American counterpart for the second straight day on Friday and remains within striking distance of an over three-month low touched earlier this week. Investors now seem convinced that the Bank of Japan (BoJ) would forgo raising interest rates this year amid worries about the economic fallout from higher US tariffs
From a technical perspective, the USD/JPY pair showed some resilience below the 100-hour Simple Moving Average (SMA) earlier this week, and the subsequent move up favors bullish traders. Moreover, oscillators are holding comfortably in positive territory and are still away from being in the overbought zone. However, the overnight failure to build on the momentum beyond the 149.00 mark warrants some caution. Hence, it will be prudent to wait for some follow-through buying beyond the 149.15-149.20 region, or a multi-month peak, before positioning for a move towards reclaiming the 150.00 psychological mark.
On the flip side, the 148.20-148.25 region, or the 100-hour SMA, could offer immediate support ahead of the 148.00 mark. Some follow-through selling, leading to a slide below the 147.70 area, could make the USD/JPY pair vulnerable to accelerate the fall towards testing sub-147.00 levels. Acceptance below the latter might shift the bias in favor of bearish trades and drag spot prices to the 146.60 intermediate support en route to the 146.20 area, the 146.00 mark, and the 100-day SMA, currently pegged near the 145.80 region
1 SUPPORT147.642
2 SUPPORT 147.311
3 SUPPORT 146917
1 RESISTANCE 148.206
2 RESISTANCE 147.972

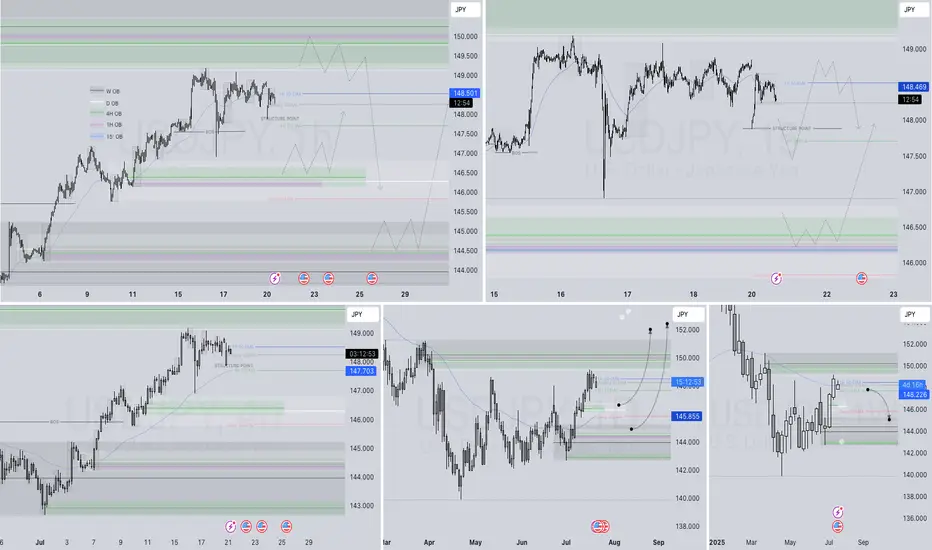
USDJPY Q3 | D21 | W30 | Y25📊USDJPY Q3 | D21 | W30 | Y25
Daily Forecast 🔍📅
Here’s a short diagnosis of the current chart setup 🧠📈
Higher time frame order blocks have been identified — these are our patient points of interest 🎯🧭.
It’s crucial to wait for a confirmed break of structure 🧱✅ before forming a directional bias.
This keeps us disciplined and aligned with what price action is truly telling us.
📈 Risk Management Protocols
🔑 Core principles:
Max 1% risk per trade
Only execute at pre-identified levels
Use alerts, not emotion
Stick to your RR plan — minimum 1:2
🧠 You’re not paid for how many trades you take, you’re paid for how well you manage risk.
🧠 Weekly FRGNT Insight
"Trade what the market gives, not what your ego wants."
Stay mechanical. Stay focused. Let the probabilities work.
FRGNT 📊
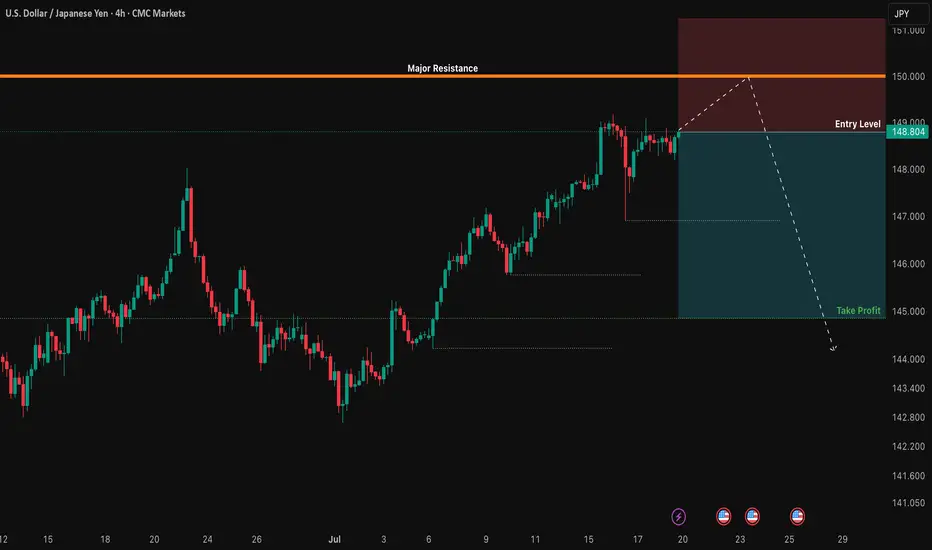
USD/JPY: The 150.00 Rejection SignalThe chart for USD/JPY looks like a simple one-way street going up. But underneath the surface, my quantitative models are in a state of conflict, and that's a high-clarity signal that something is about to change.
This isn't a signal to short right now. This is a signal to be patient and watch for a very specific setup that the "smart money" models are anticipating.
The Quant Conflict 🤖
My analysis involves several different mathematical models. Here's the situation:
One model, which is great at tracking trends, is still signaling BUY , following the obvious upward momentum.
However, two other, more complex models that analyze the relationships between economic data are now flashing a SELL signal. They are detecting underlying weakness that the price chart isn't showing yet.
When the simple trend model and the complex structural models disagree, it often means a major turning point is near. We are siding with the smarter models, but we need price action to confirm their warning.
The Game Plan 📊
We will use the 150.00 level as our "line in the sand." We are waiting for the market to fail at this level and then break down, which would confirm the bearish quant signal. This is our high-probability entry trigger.
Here is the exact setup we are waiting for:
📉 THE SETUP: A patient short position, waiting for confirmation of a breakdown.
👉 ENTRY: We enter only on a confirmed daily close below 148.00.
⛔️ STOP LOSS: Place the stop just above the psychological wall at 150.25.
🎯 TAKE PROFIT: Our primary target is the major support level at 145.00.
This is a setup where patience pays. We are letting the market do the hard work and show its hand before we commit. Let's watch this one closely.
USD_JPY STRONG UPTREND|LONG|
✅USD_JPY is in a strong
Long-term uptrend now
And the pair is accumulating
For the next leg up so we will
Be expecting a bullish continuation
On Monday!
LONG🚀
✅Like and subscribe to never miss a new idea!✅
Disclosure: I am part of Trade Nation's Influencer program and receive a monthly fee for using their TradingView charts in my analysis.
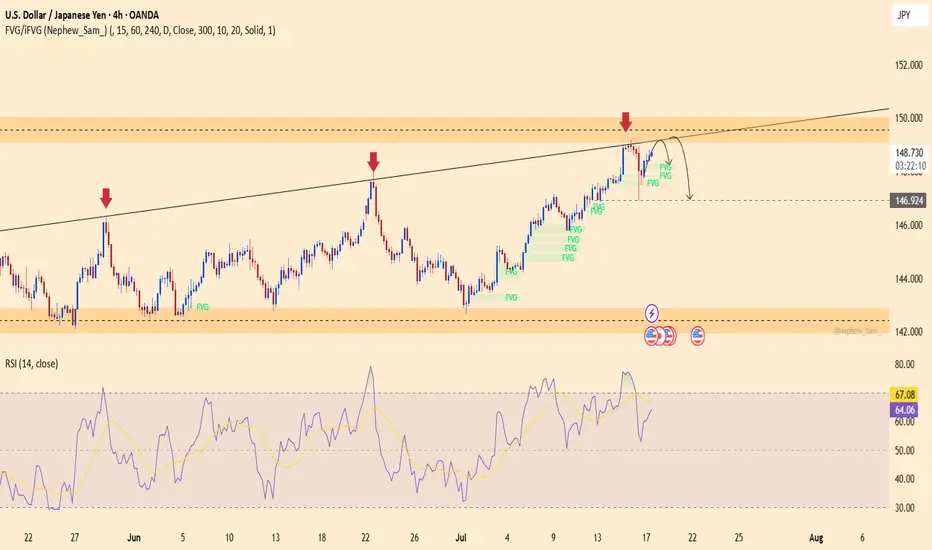
USDJPY – Rejection Pressure Builds, Is a Reversal on the HorizonUSDJPY has been rejected for the third time at the diagonal resistance line, forming a potential lower-high pattern that suggests a reversal could be underway. The RSI is dropping from the overbought zone, clearly indicating weakening bullish momentum. If the price breaks below 146.900, a bearish trend may be confirmed, with a possible move toward the lower support area.
On the news front, U.S. Treasury yields have stalled after a strong rally, and jobless claims have ticked up slightly—dampening expectations for further Fed rate hikes. This puts pressure on the USD while favoring the safe-haven JPY.
Traders should closely monitor the price action around the 149.300 level. Continued rejection could offer a prime shorting opportunity!
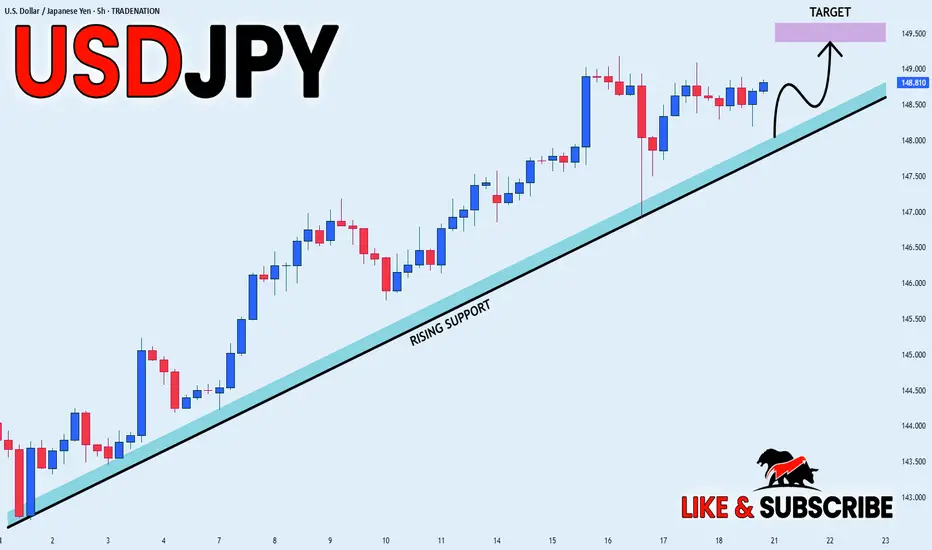
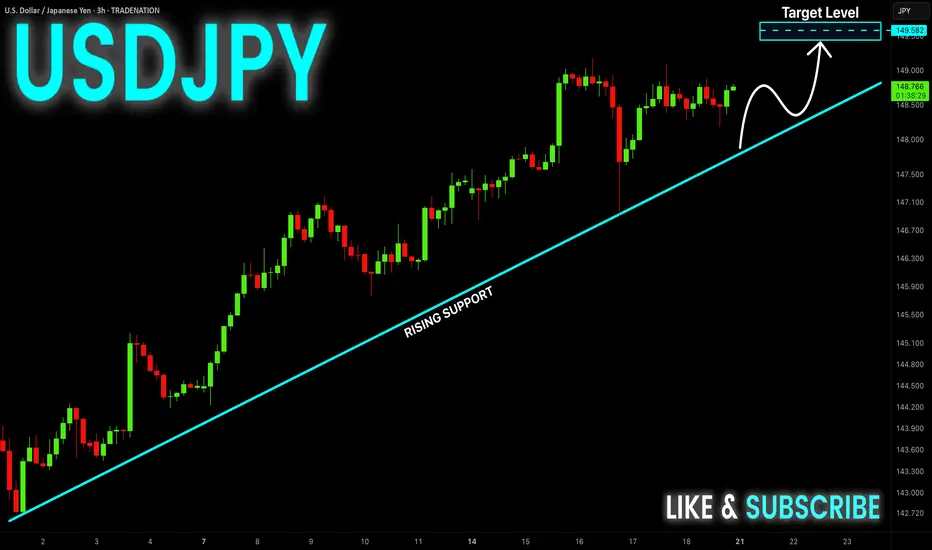
USD-JPY Will Keep Growing! Buy!
Hello,Traders!
USD-JPY is trading in an
Uptrend along the rising
Support line and the pair
Already made a bullish
Rebound and is consolidating
In a local range so as we
Are bullish biased we will
Be expecting a further
Bullish move up
Buy!
Comment and subscribe to help us grow!
Check out other forecasts below too!
Disclosure: I am part of Trade Nation's Influencer program and receive a monthly fee for using their TradingView charts in my analysis.
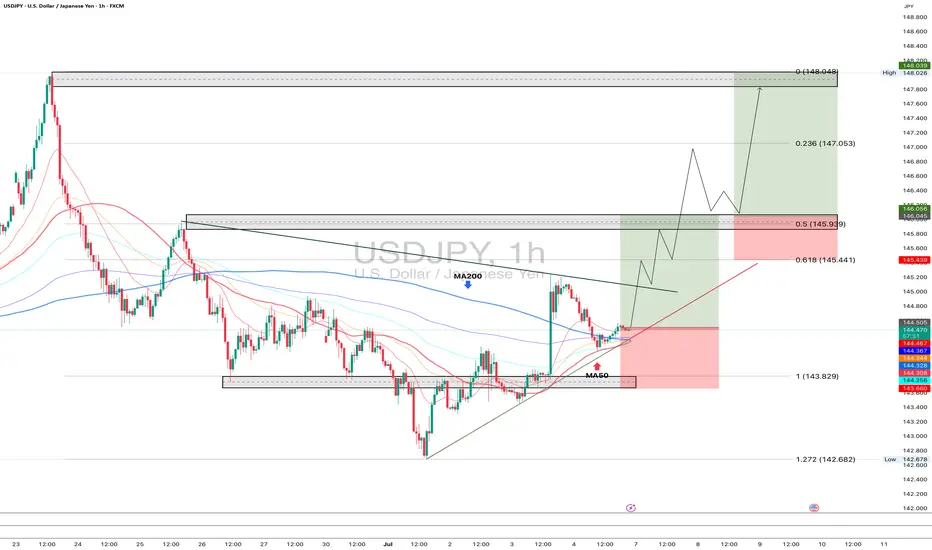
USDJPY 1H - market buy with a confirmed structureThe price has bounced from a key support zone and is showing early signs of recovery. A clear base has formed, and the MA50 is starting to turn upward, indicating a shift in short-term momentum. While the MA200 remains above the price, the overall structure suggests a potential continuation of the bullish move.
Trade #1 — entry at market, target: 145.939, stop below recent local low.
Trade #2 — entry after breakout and retest of 145.939, target: 148.000, stop below the retest zone.
Volume has stabilized, and the reaction from support is clear. As long as price holds above the last swing low, buying remains the preferred strategy.
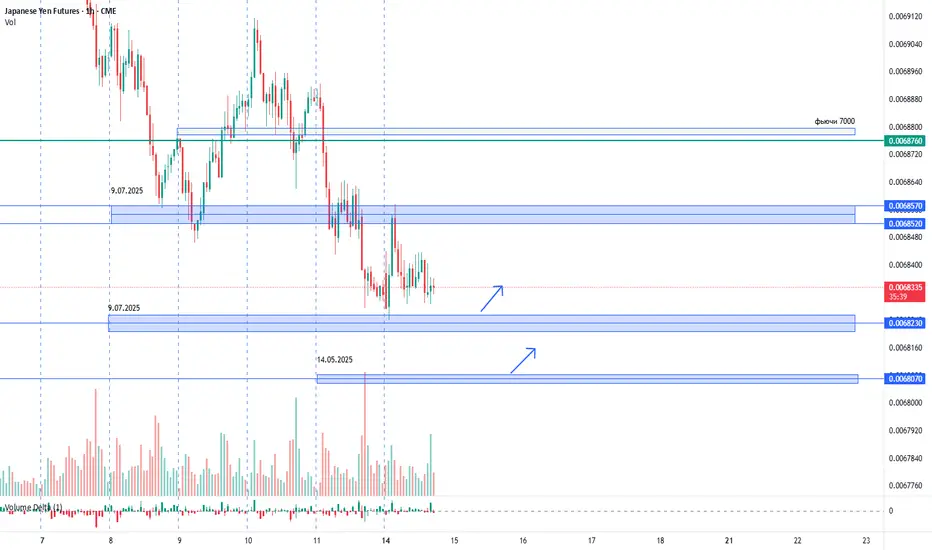
USDJPY. 14.07.2025. The plan for the next few days.The nearest interesting resistance zones have already been worked out at night and have given a good reaction. Let's mark the others where we can expect a reaction. It's not certain that there will be a major reversal, but I believe we will see a correction that can be monetized. We are waiting for a reaction and looking for an entry point.
The post will be adjusted based on changes.
Don't forget to click on the Rocket! =)
USD-JPY Short From Resistance! Sell!
Hello,Traders!
USD-JPY keeps growing but
A strong horizontal resistance
Is ahead around 148.500
So after the retest we will
Be expecting a local
Bearish correction on Monday!
Sell!
Comment and subscribe to help us grow!
Check out other forecasts below too!
Disclosure: I am part of Trade Nation's Influencer program and receive a monthly fee for using their TradingView charts in my analysis.

USD/JPY bears getting trapToday's main data release was the weekly jobless claims figures, which came out better than expected at 227K vs. 236K eyed, down from 232K the week before.
In response, the dollar extended its rebound, and the USD/JPY has turned positive on the day after yesterday's reversal.
In recent days the UJ has been pushing higher, thanks to a weakening JPY amid threats of tariffs from the US. But we have also seen some support for the dollar owing to expectations that the tariffs will prove inflationary and that could limit Fed rate cuts.
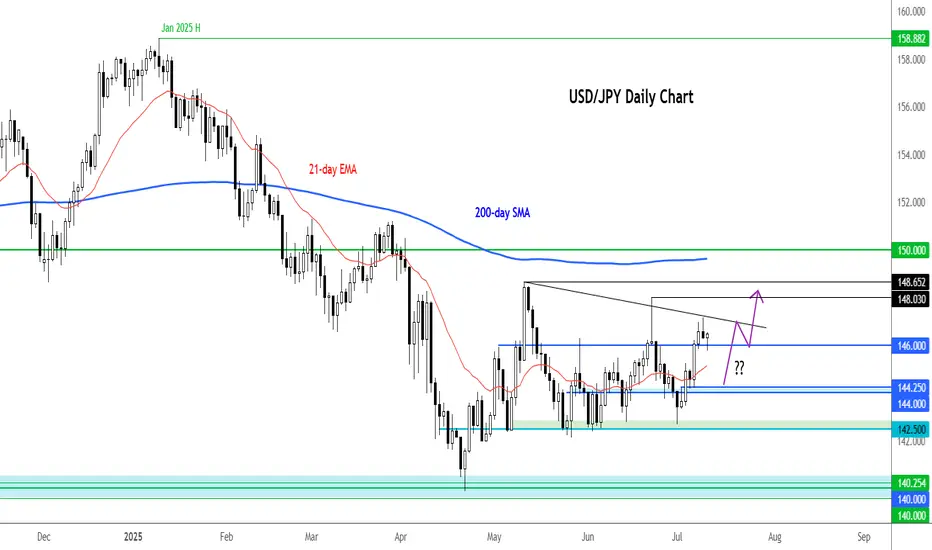
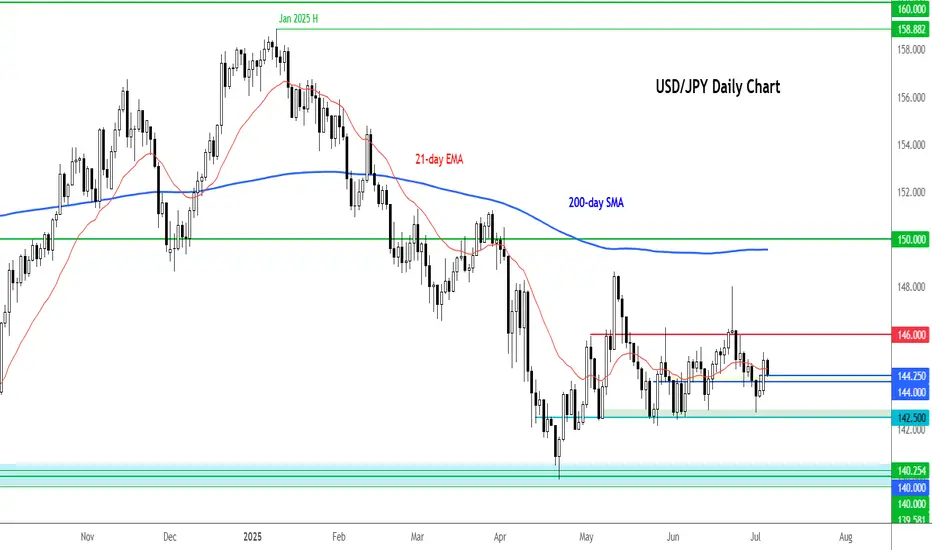
The UJ has been forming a few bullish price signals and now finds itself above the 21-day exponential average. Stops resting above those inverted hammer candles from yesterday and June 23 could be in trouble. Can we see price rally towards those liquidity pools?
Support at 146.00 held firm after a brief dip below it. Next support is around 145.00 then 144.25 and 144.00 thereafter.
By Fawad Razaqzada, market analyst with FOREX.com
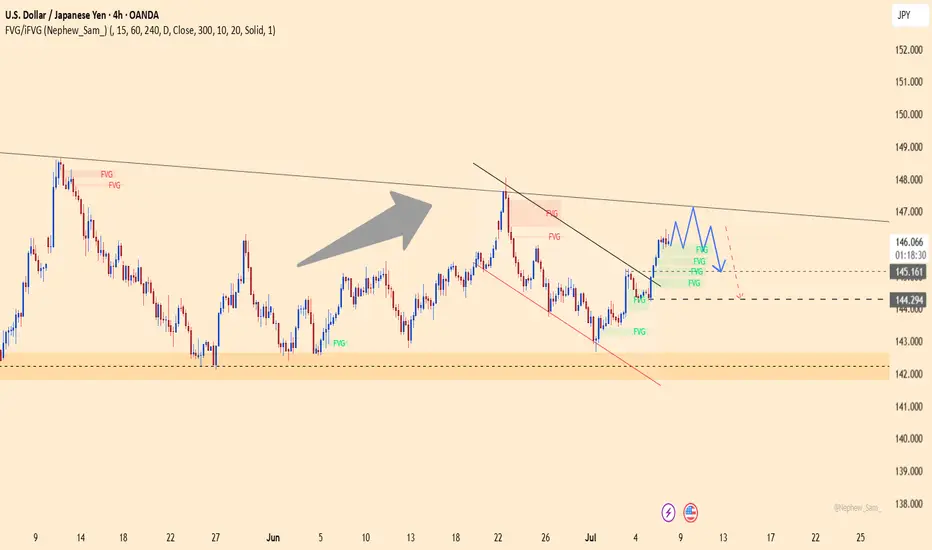
USDJPY – A Bull Trap in the Making?USDJPY has just broken above the descending trendline but stalled right at the confluence resistance near 147.100 – a former strong distribution zone. Although buyers have pushed the price higher, the current price structure is sketching a potential double top pattern, signaling a possible exhaustion of the bullish momentum.
If this pattern confirms and price breaks below the FVG support zone around 145.161, then 144.300 will likely be the next target – a level that previously halted price before the recent rally. Price action should be closely monitored here, as a breakdown below 145.161 could be an early reversal signal.
Disappointing Nonfarm data has pushed bond yields lower and weakened the USD, reinforcing expectations of an earlier Fed rate cut. If this week’s CPI also comes in lower than expected, USDJPY could sharply drop from the current top.
USD/JPY loses bulk of NFP-related gainsThe USD/JPY has given back a bulk of yesterday's NFP-driven gains. Although the data was not as strong as the headlines suggested, the fact that we saw decent moves in bond and equity markets suggests investors were overall impressed by the figures. So it seems the market is preparing itself for some more tariff-related volatility as we approach the 9 July deadline, when 'Liberation Day' tariffs will revert. Trump has suggested letters are being sent out to trading partners over the next few days, informing them of their new tariff rate. If you recall, during the worst of April's volatility, the likes of the franc, euro and yen were all outperforming. Could we see a similar pattern this time?
Well, looking at the USD/JPY, traders have certainly sold into yesterday's rally. But we need a more decisive breakdown of support between 140.00-140.25 now to trigger some long side liquidation. Below this area, key support comes in around 142.50. Resistance comes in at 145.00, followed by 146.00.
By Fawad Razaqzada, market analyst with FOREX.com
USDJPY: Bearish Trend Remains in ControlUSDJPY continues to follow a clear downtrend on the H4 chart, respecting a descending trendline and forming consistent lower highs. The strong rejection at 144.800 and the presence of multiple FVGs further reinforce the bearish structure.
Price is currently retracing to test the FVG zone. If rejection occurs here, the downtrend could resume towards the 141.900 support level.
Trade Setup:
Sell near 144.700
TP: 141.900
SL: above 145.300
Supporting News:
"Risk-on" sentiment is back after strong manufacturing data from China and rising expectations that U.S. interest rates may soon peak, weakening the USD against the JPY.
Are you watching for a short setup like I am?
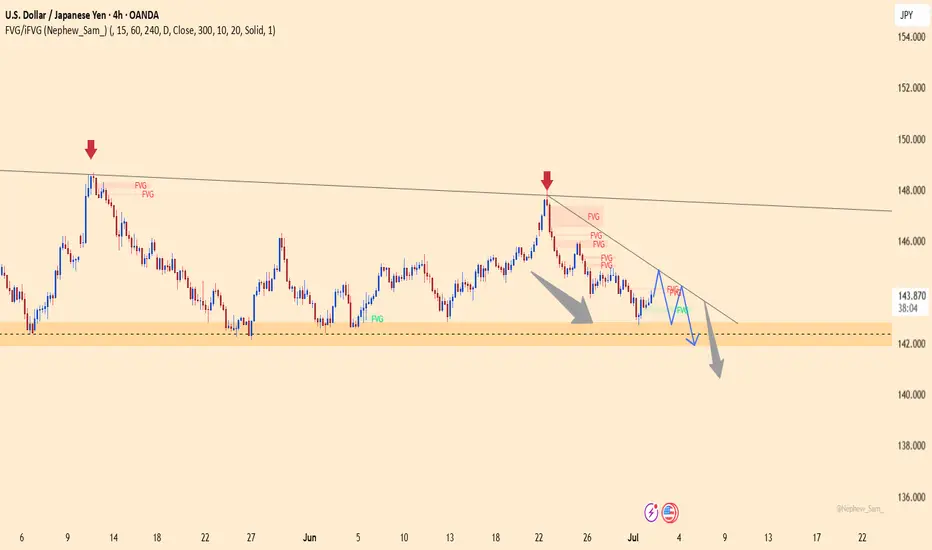
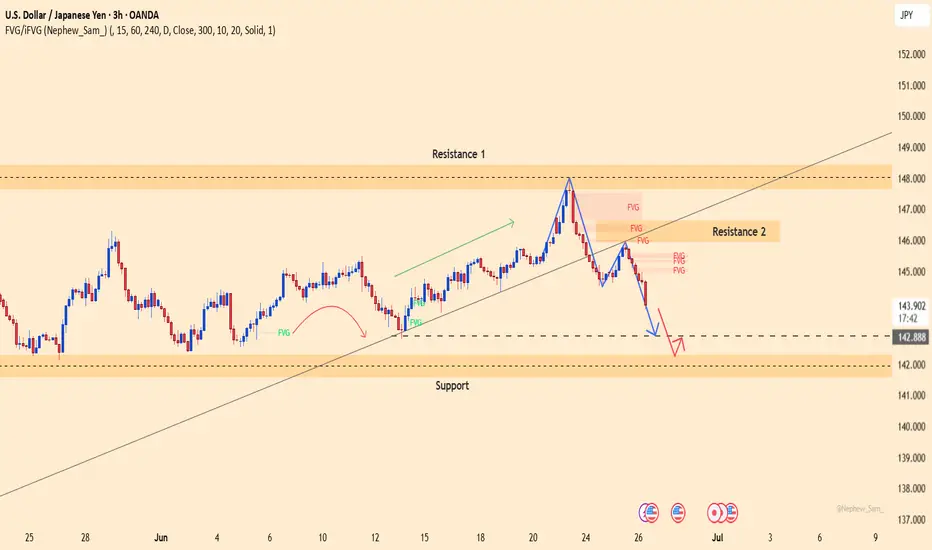
USDJPY – Uptrend Still Intact, But Waiting for a BounceUSDJPY is currently pulling back toward the key support zone at 142.244 after being rejected from the 148.000 resistance area. This recent drop reflects strong selling pressure from the dense FVG zones near Resistance 2.
However, the overall structure remains bullish, with a series of higher highs and higher lows still intact. The current support zone is crucial—if it holds, USDJPY could rebound toward 145.800 and potentially retest the 148.000 level.
On the news front:
– A fragile ceasefire between Iran and Israel has improved global risk sentiment, reducing demand for USD as a safe haven.
– The Bank of Japan kept interest rates unchanged and signaled caution in reducing bond purchases—supporting the yen, but not enough to reverse the dollar's edge.
– The wide interest rate differential still favors the USD.
Strategy: Watch for bullish confirmation at 142.244. If buyers step in clearly, it may present a long opportunity in line with the dominant uptrend.