BTC - Will the Bearish Channel continue?Market Context
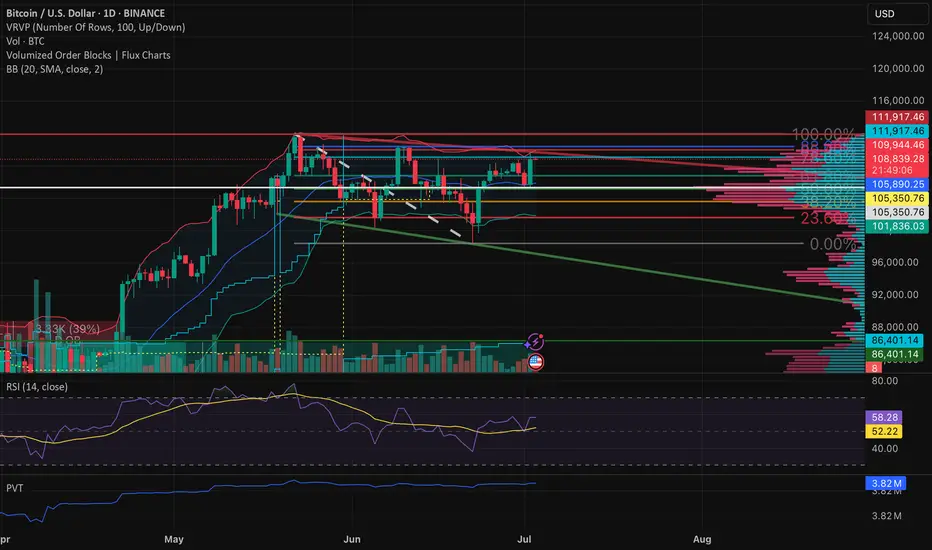
After a strong impulsive rally earlier in the year, BTC has been trading within a descending channel on the daily timeframe. This corrective structure suggests a period of consolidation and redistribution, as price oscillates between the channel's boundaries. The repeated rejection from the upper trendline and the inability to break through key highs reinforce the bearish bias in this structure.
Buy Side Liquidity Sweep Potential
Price is currently positioned just beneath a relatively clean swing high, sitting above the mid-range of the channel. This high represents a clear area of Buy Side Liquidity—stop losses from short positions and pending breakout orders from longs are likely clustered there. An engineered sweep of this high would serve as a strategic move for larger participants to collect liquidity before driving price lower.
Fair Value Gap as a Pivot Point
Beneath current price lies a Fair Value Gap—a visible inefficiency formed during a fast upward move earlier in the structure. This Gap remains unfilled and offers a compelling target for price once the Buy Side Liquidity Sweep occurs. It represents a logical zone for price to rebalance before deciding on continuation or reversal. Should price break below the Gap cleanly, it would confirm the bearish intent and potentially accelerate toward the lower bounds of the channel.
Channel Continuation Structure
The overall geometry of the channel remains intact, and the price respecting both upper and lower boundaries strengthens the likelihood of a continuation toward the downside. If the Buy Side Liquidity Sweep and subsequent rejection occur, the market could be poised for another leg lower—possibly seeking the next structural support closer to 90,000 or even toward the lower extremities of the channel around 80,000–82,000.
Final Thoughts
This chart reflects classic price delivery behavior: corrective structure, engineered liquidity sweeps, and the magnetic pull of inefficiencies like Fair Value Gaps. Whether you’re actively trading or simply observing, this is a clean, educational setup to learn from.
If this breakdown helped you see the market a bit clearer, I’d really appreciate a like. And feel free to share your thoughts or counterviews in the comments—your insights make the analysis even more valuable.
1-BTC

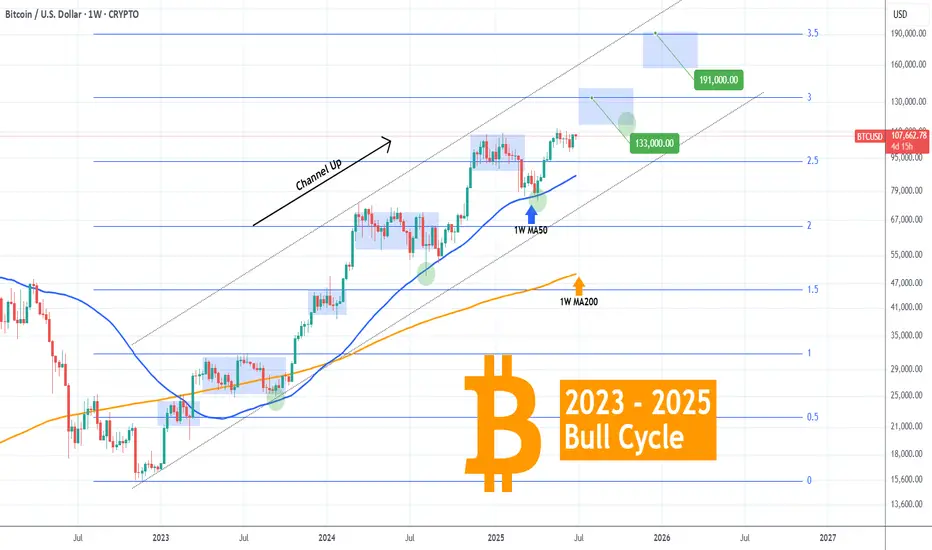
BITCOIN Bull Cycle's next two probable stops..Bitcoin (BTCUSD) has been trading within a 2.5-year Channel Up throughout the entirety of its 2023 - 2025 Bull Cycle, showcasing incredible consistency. This is perhaps BTC's most stable Bull Cycle and that can help us estimate to some degree its next two key levels, before its tops.
As you can see, every major Higher High of this pattern has been either on or marginally above a +0.5 Fibonacci interval:
Fib 0.5 was the February 2023 High and Accumulation Phase.
Fib 1.0 the April - September 2023 Accumulation.
Fib 1.5 December 2023 - January 2024.
Fib 2.0 March - September 2024.
Fib 2.5 December 2024 - February 2025.
Right now the market seems to be attempting a break-out above a Bull Flag, following the massive April 07 2025 rebound on the 1W MA50 (blue trend-line), a level that has been the most optimal buy entry in the past 2 years.
The next stop based on this model is the 3.0 Fibonacci extension level at 133000, where there are high probabilities for the market to consolidate (accumulation phase) in preparation for perhaps the final stop and Cycle peak on the 3.5 Fib ext around 191000. As we've discussed on previous analyses, a final Target between those two around $150000 may be more fitting, carrying less risk into the final months of the Bull Cycle.
So what do you think? Do you believe that's the blueprint to follow until the end of the year/ Cycle? Feel free to let us know in the comments section below!
-------------------------------------------------------------------------------
** Please LIKE 👍, FOLLOW ✅, SHARE 🙌 and COMMENT ✍ if you enjoy this idea! Also share your ideas and charts in the comments section below! This is best way to keep it relevant, support us, keep the content here free and allow the idea to reach as many people as possible. **
-------------------------------------------------------------------------------
💸💸💸💸💸💸
👇 👇 👇 👇 👇 👇
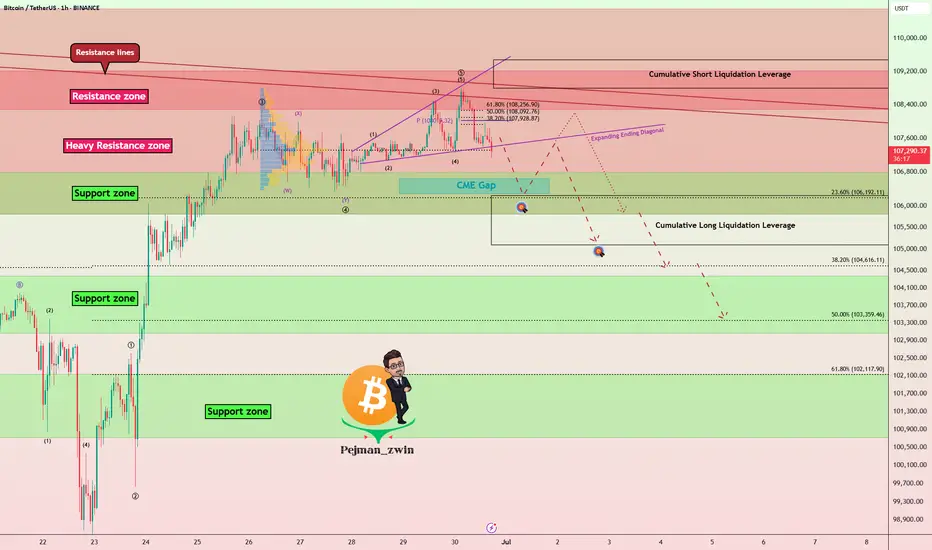
Bitcoin Breakdown? Support Zone & CME Gap in FocusBitcoin ( BINANCE:BTCUSDT ), as anticipated in my previous analysis , attacked the Resistance lines and then resumed its decline. In previous analysis, both Long and Short positions could have been profitable .
Bitcoin is approaching a Support zone($106,800-$105,820) and the CME gap($106,645-$106,295) .
From an Elliott Wave theory perspective , it appears that Bitcoin has finally completed a five-wave impulsive move with the help of an Expanding Ending Diagonal .
I expect Bitcoin to attack the Support zone($106,800-$105,820) after breaking the lower line of the Expanding Ending Diagonal .
Note: To break through the Support zone($106,800-$105,820), Bitcoin may potentially use either a Head and Shoulders pattern or a Bearish Quasimodo formation.
Note: If Bitcoin breaks the Resistance lines, we can expect more pumps.
Cumulative Long Liquidation Leverage: $106,249-$105,094
Cumulative Short Liquidation Leverage: $109,483-$108,790
Please respect each other's ideas and express them politely if you agree or disagree.
Bitcoin Analyze (BTCUSDT), 1-hour time frame.
Be sure to follow the updated ideas.
Do not forget to put a Stop loss for your positions (For every position you want to open).
Please follow your strategy and updates; this is just my Idea, and I will gladly see your ideas in this post.
Please do not forget the ✅' like '✅ button 🙏😊 & Share it with your friends; thanks, and Trade safe.
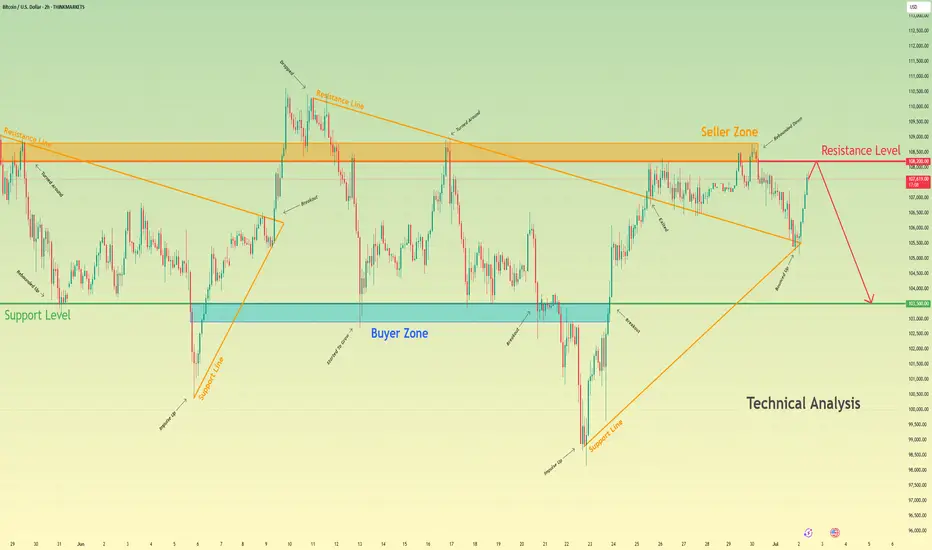
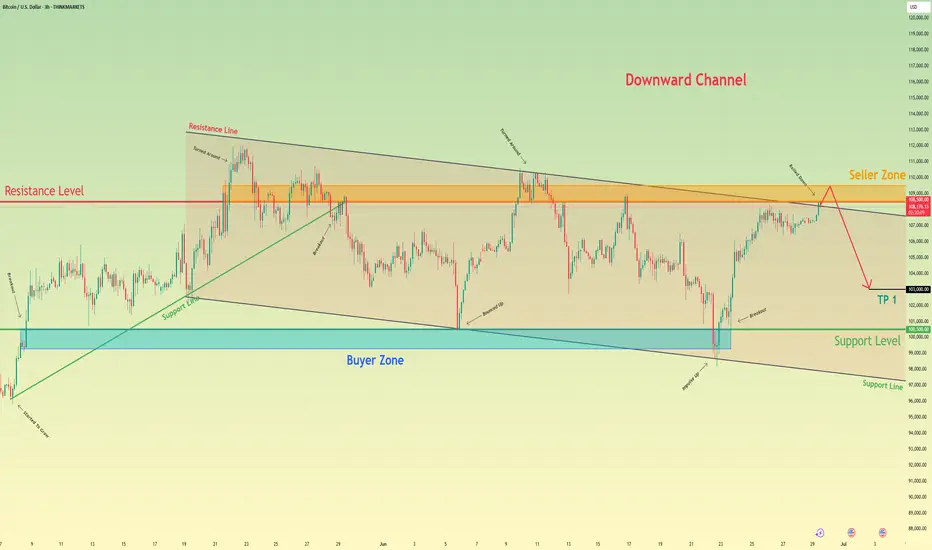
Bitcoin will drop from resistance level and fall to 103500 levelHello traders, I want share with you my opinion about Bitcoin. Some days ago, price entered the pennant, where it turned around from the seller zone, which coincided with the resistance level, and dropped to the 103500 support level. Then it bounced and tried to grow, but soon failed and dropped below the 103500 support level, which coincided with the buyer zone and reached the support line of the pennant. Following this movement, BTC experienced an upward impulse, breaking the 103,500 support level and subsequently exiting the pennant pattern, before rising to the resistance level. Price broke this level and then started to decline inside another pennant pattern. In this pattern, the price dropped top 103500 support level again and then tried to bounce back, but failed and continued to decline. In a short time, it fell to the support level, broke it, and then fell to the support line of the pennant. Next, BTC turned around and repeated an impulse up to the resistance line of the pennant and exited from this pattern. Then it rose to the seller zone, where it rebounded from it and fell, but recently it rebounded and started to grow. Now, I expect that price will reach the resistance level and then drop to the 103500 support level. For this case, this level is my TP. Please share this idea with your friends and click Boost 🚀
Disclaimer: As part of ThinkMarkets’ Influencer Program, I am sponsored to share and publish their charts in my analysis.
Bitcoin Recovers Above 105,000, Extremely Bullish +AltcoinsBitcoin produced only two days red, a bear-trap, and is now trading daily back above $107,000, an extremely bullish development.
Good morning my fellow Cryptocurrency trader, I hope you are having wonderful day.
The altcoins market bull market is confirmed and what Bitcoin is currently doing gives further strength to the bullish case and bias. It will be only a matter of days before the entire altcoins market turns strongly bullish with major momentum.
The range is still valid though, $100,000 - $110,000. But this time around the upper-boundary is likely to break and the last ATH tested, a new all-time high is even possible and also highly probable which is what will propelled the altcoins to hit multi-year highs and some even new all-time highs. Many pairs will move ahead.
With each passing day, the Cryptocurrency market will continue to heat up. We can expect growth long-term.
The 2025 bullish cycle started with the 7-April market low. The start of the third wave started 22-June and should go for 2-3 months. Then we will have a correction, the fourth wave followed by one final jump, the fifth wave.
We can expect growth now and all through late 2025. The entire period will be bullish. Only when the marketwide correction comes there will be a pause but many pairs will grow even at this point.
Choose wisely. Low risk vs high potential for reward.
Aim high. Focus on the long-term.
Thanks a lot for your continued support.
Namaste.

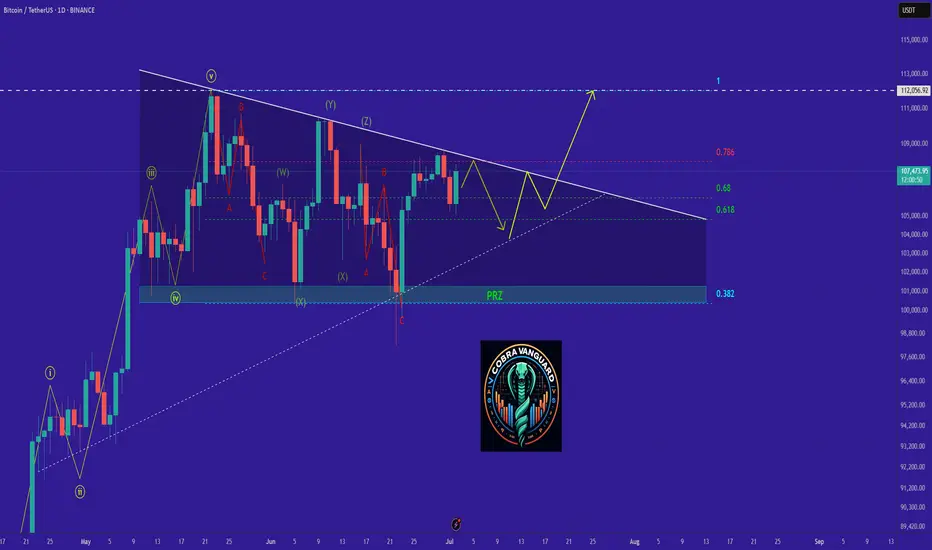
BTC's Situation, A Comprehensive Analysis !!!The situation has become quite strange. Bitcoin is forming deceptive patterns, and altcoins continue their downward trend. Currently, Bitcoin is positioned within two triangles—one symmetrical and the other descending. Now that Bitcoin has reached the top of the triangle and appears ready to break upward, it might actually be hiding yet another trap within the price action.
This market has shown disregard for technical patterns, and every time the price approaches historically significant levels, it reveals its true intentions and disappoints us. This cycle tends to repeat.
In my opinion, we’re likely to see one more drop in Bitcoin’s price. After that, instead of continuing the expected downtrend from the pattern, the price could break the descending formation and experience a strong upward move.
Stay Awesome , CobraVanguard.
BITCOIN FLASHING EARLY BEARISH SIGNALS!!! (Don’t get trapped) I am explaining why Bitcoin might start crashing towards $93k. If we get enough confirmations, amazing RR short opportunities might be great money-making machines !!!

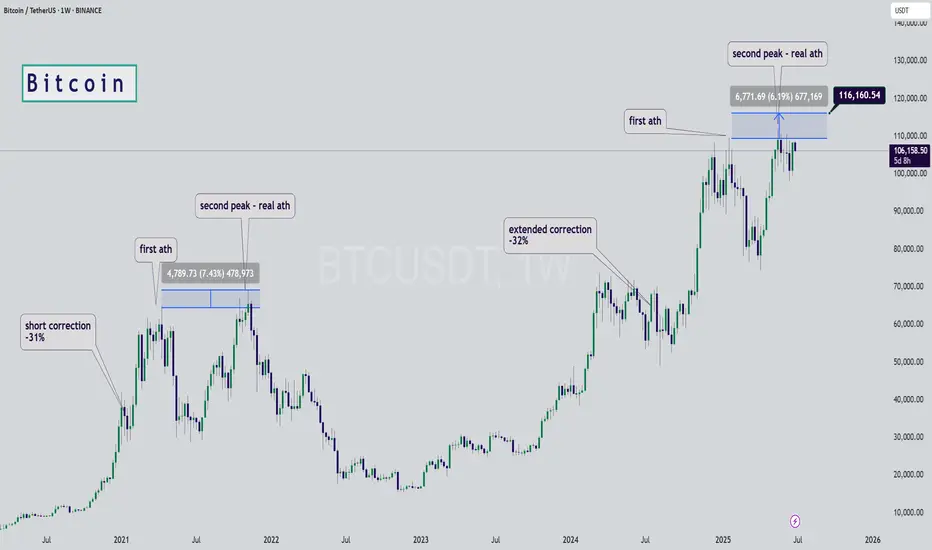
Bitcoin Fractal, increase to $116k Hi Everyone☕👋
BINANCE:BTCUSDT
Been such a long time since I posted. Today I'm looking at BTCUSDT, and I'm looking at the previous all time high cycle and what we were seeing (the pattern aka fractal).
Here's why we're likely going a little higher.
First correction of -32%
Followed by first peak, ATH
Correction, then the second peak and the REAL ath. Which is where we likely are:
Interesting to note that the previous time, the second ath was NOT THAT MUCH HIGHER. This should be considered to manage expectations in terms of how high we can go. Anything above +6% is a bonus.
Bitcoin - Price struggles below resistance, correction to $104k?This 4-hour chart for BTC/USD illustrates a detailed technical analysis scenario highlighting key resistance and support zones, as well as a critical fair value gap (FVG). The chart shows that Bitcoin is currently facing strong resistance in the $108,000 to $109,000 range. This area has been tested multiple times without a successful breakout, indicating significant selling pressure. The price is currently trading just below this resistance zone, struggling to gain momentum above it.
Support zone in the consolidation
A clear support level has been marked in the recent consolidation area around $106,000. This zone has served as a short-term base during the recent upward movement, and a retest here could provide a temporary bounce or pause in bearish momentum. However, if this support fails to hold, the next major area of interest lies within the 4-hour bullish FVG between approximately $103,000 and $104,000.
4H FVG
There is a clear 4-hour bullish FVG between approximately $103.000 and $104.000. This level can act as a strong support for buyers after filling up the inbalance zone. it is highly important to hold this level as support and not to break below it.
Upside potential
On the upside, if BTC can defend the support in the consolidation zone and reclaim momentum, a push back to the $108,000 to $109,000 resistance area is probable. A successful breakout above this zone would invalidate the bearish scenario and may trigger a bullish continuation, with the potential to reach higher targets such as $111,000 or beyond.
Downside risk
The downside risk becomes more pronounced if BTC breaks below the 4H FVG. A sustained move beneath this level would likely signal weakness in buyer interest and potentially open the path to deeper downside targets. In such a scenario, the price could accelerate lower toward the psychological support level at $100,000. This round number also carries technical and emotional significance for traders, which could create both a strong support area and potential buying interest.
Conclusion
In conclusion, Bitcoin remains at a critical juncture. The key levels to watch are the support within the current consolidation and the 4H FVG imbalance zone. A breakdown below the FVG could lead to a decline toward $100,000, while holding above these levels keeps the door open for another test of resistance at $108,000 to $109,000. A breakout from there would indicate bullish strength and a shift in market sentiment. Traders should remain cautious and reactive to how price behaves around these critical areas.
Disclosure: I am part of Trade Nation's Influencer program and receive a monthly fee for using their TradingView charts in my analysis.
Thanks for your support.
- Make sure to follow me so you don't miss out on the next analysis!
- Drop a like and leave a comment!

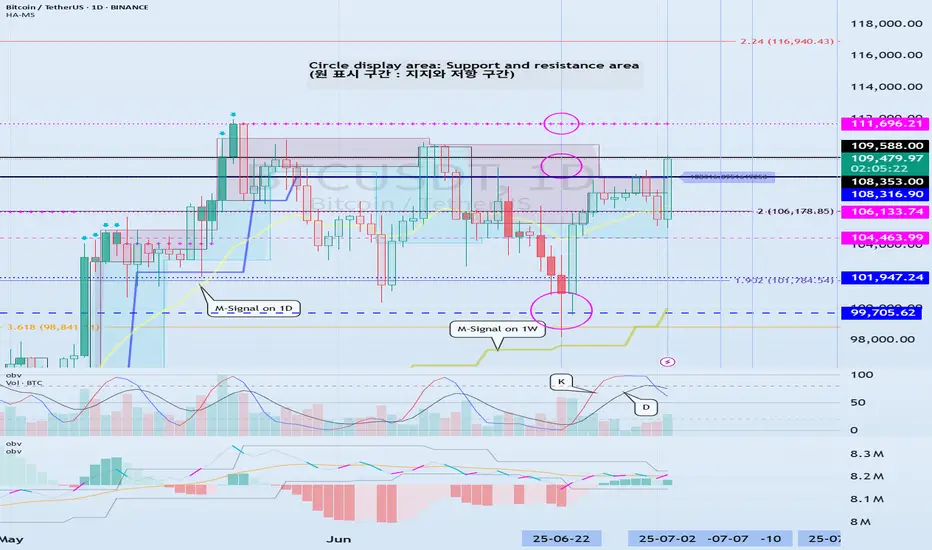
Check support at 108316.90-111696.21
Hello, traders.
If you "Follow", you can always get new information quickly.
Have a nice day today.
-------------------------------------
(BTCUSDT 1D chart)
Among the many trend lines, the one marked 1W is the important one.
Therefore, we need to look at whether it can rise above the 1W trend line or rise along the trend line.
If not, and it falls below 108316.90, it may lead to further decline, so we need to think about a countermeasure for this.
This volatility period is expected to continue until July 3, but it is expected to last until July 11, so caution is required when trading.
-
Indicators that indicate high points are DOM(60), HA-High, and StochRSI 80.
HA-High and StochRSI 80 are formed around 108316.90, and DOM(60) is formed at 111696.21.
Therefore, the 108316.90-111696.21 section is a high point boundary section, and if it is supported and rises in this section, it is highly likely that a stepwise uptrend will begin.
The conditions for a stepwise uptrend to begin are:
- The K of the StochRSI indicator must show an upward trend below 80,
- The PVT-MACD oscillator indicator must show an upward trend above the 0 point,
- The OBV of the Low Line ~ High Line channel must show an upward trend. If possible, it is better for the Low Line ~ High Line channel to form an upward channel.
When the above conditions are met, I think that if it is supported and rises in the 108316.90-111696.21 section, it is highly likely that a stepwise uptrend will continue.
If the above conditions are not met, it is likely that it will show a downward trend again while pretending to rise.
-
Thank you for reading to the end.
I wish you successful trading.
--------------------------------------------------
- This is an explanation of the big picture.
(3-year bull market, 1-year bear market pattern)
I will explain more details when the bear market starts.
------------------------------------------------------
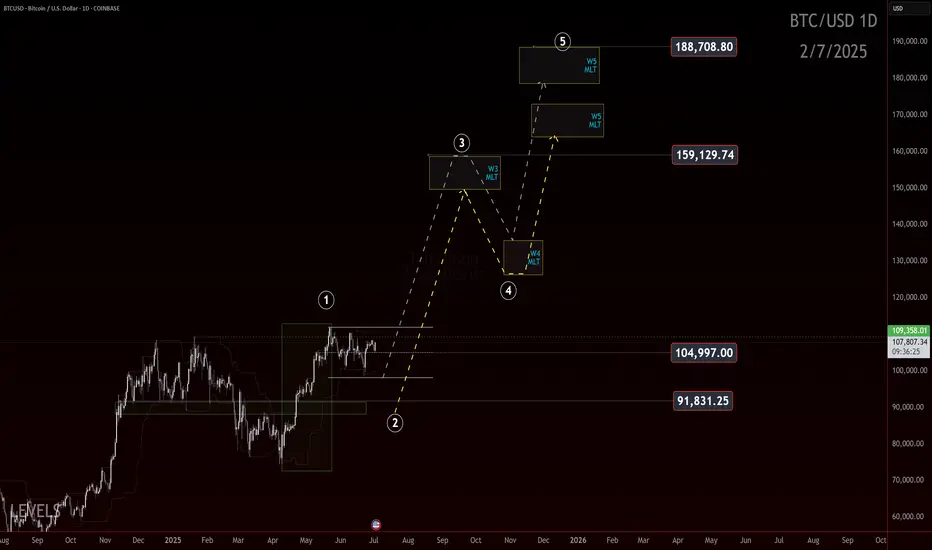
Bitcoin: 170k–180k?If you find this information inspiring/helpful, please consider a boost and follow! Any questions or comments, please leave a comment!
Bitcoin: 170k to 180k?
Let’s talk bias.
We’ve seen a powerful move off the 75k low, and it’s hitting some markers of a potential wave 1 impulse. If that structure holds and price doesn’t come back to wipe out the lows in a wave 2 retracement, then this is what we’d be looking at.
The idea? This is a conservative roadmap built off Elliott Wave Fibonacci projections and it targets the 170k to 180k zone.
Now, let’s be clear. This is a conservative projection. We’re not talking hopium fueled 250k moon targets here. We have no proof of that yet. We're anchoring the wave count and saying: if this is a 1, we’re due a 2, and then a 3 takes us to the upper levels.
But there’s a catch. Always is.
If price starts to fade back through the 91.8k area in a deep aggressive retrace, this roadmap gets less likely. Breaking the 75k pivot means the impulse structure failed or was misread, and we shift the count.
Until then, the 170k–180k level is a possible destination based on this roadmap.
Trade Safe!
Trade Clarity!
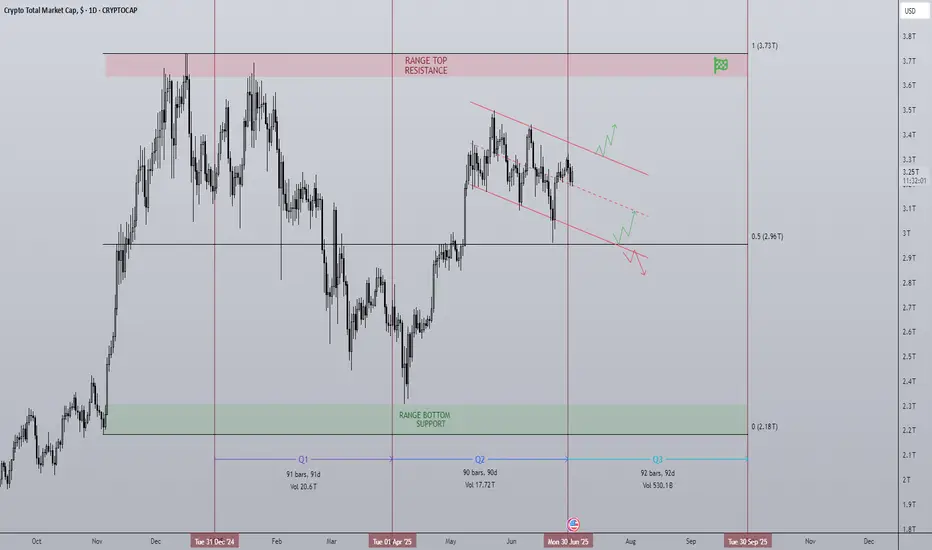
TOTAL Q3 As Q2 closes, Q3 begins...
The 2nd quarter of 2025 made up for a lot of the losses of Q1 peaking at $3.5T in the middle of the quarter. Since the peak a steady downtrend channel has formed and continues to be the case going into Q3.
What can we expect to see in the next 3 months in the crypto market? For me there are two different scenarios that are bullish, and one that is bearish IMO:
Bullish scenario 1 - The most likely scenario I think is a breakout above the downtrend channel and a move towards the range top. My reasoning for this comes from what we know about the driving forces in the market. Just last week BTC ETFs had a $2.2B net inflow, MSTR bought another 4,980BTC for $531.9m, various ETFs on the way for other majors such as SOL. Crucially the M2 money supply is at a record ATH. What that means is huge demand and the means to purchase with a what feels like a deadline closing in.
Bullish scenario 2 - We see a trend continuation until the range midpoint which has provided support before. It would coincide with the bottom of the trend channel and therefor I believe would provide a good launchpad for long positions.
Bearish scenario - For me this is the least likely situation but one that must be prepared for, a loss of the range midpoint would be a major setback, one that would mean a potential revisit of the range low in a symmetrical move down mirroring Q2s move up. The reason I believe this is the least likely is there is just too much in favor of risk on assets like crypto currently, I've mentioned the fuel that is the M2 money supply piling up to be deployed. A US interest rate cut all but confirmed for September and the institutional race for acquiring these assets before it is too late.
In conclusion just keeping it simple on the chart, a breakout above the trend channel is a great long opportunity to target the highs.
If BTC continues the grind down a great place for it to turn bullish is the range midpoint as has happened previously.
In the event BTC loses the midpoint a retest of the weekly low would make sense to me.
Bitcoin’s not done dropping. Selling pressure’s still on!Welcome aboard ✌️
In order for Bitcoin to climb higher, we first need a deeper correction.
Right now, price is stuck inside a channel — and it’ll take stronger momentum to break out.
🔻 So for now, I’m expecting further downside. Stick with me and don’t miss this bearish wave!
BINANCE:BTCUSD OANDA:BTCUSD
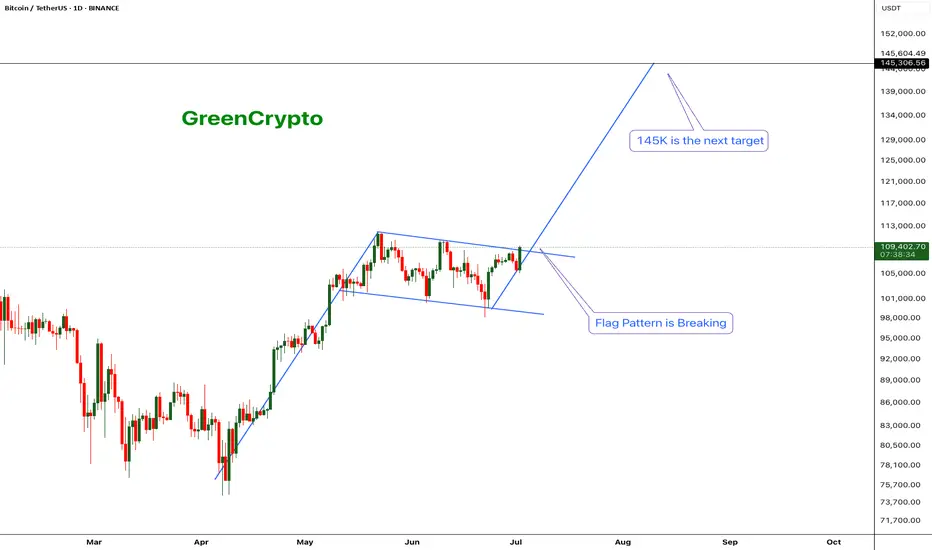
Bitcoin - Flag pattern is brokenBitcoin had been consolidating within a flag pattern for the past three months. That pattern has now officially broken to the upside, with the price surging to $109K — a strong bullish signal fueled by encouraging news around institutional adoption.
Based on both the technical flag breakout and ongoing fundamental momentum, the next target for Bitcoin is $145K. Any move beyond that would be considered a bonus in this current bull cycle.
Stay tuned for more updates.
Cheers,
GreenCrypto
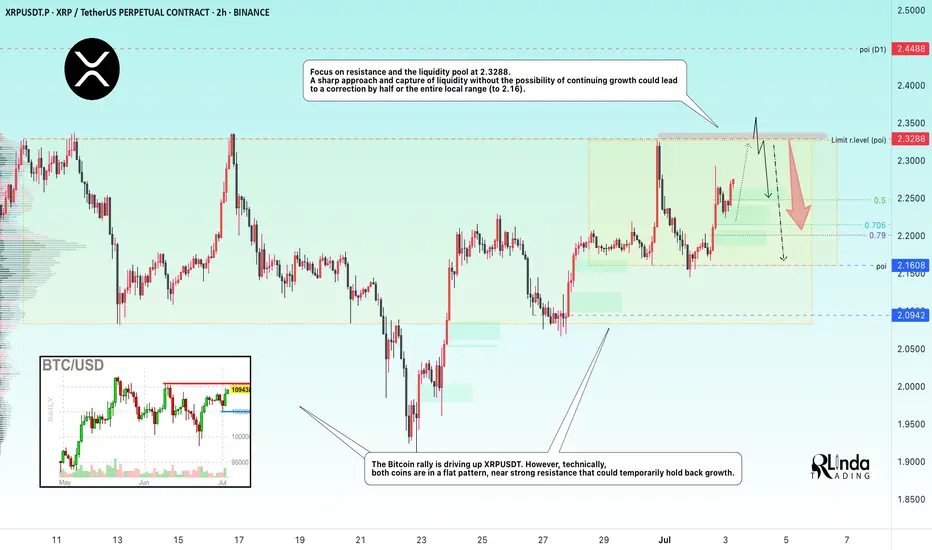
XRPUSDT → Resistance retest. Coin inside the flatBINANCE:XRPUSDT is rising towards resistance at 2.3288 due to a shift in the fundamental background to positive and a rally in Bitcoin, but there is always a but...
On the daily chart, XRP is trading below strong trend resistance, and there is also a fairly strong and voluminous liquidity pool at 2.3300 ahead, which could provide strong resistance. Bitcoin is also approaching its critical level of 110500, which may temporarily hold back growth, and a correction in the flagship could trigger a correction in the rest of the market...
Focus on resistance and the liquidity pool at 2.3288. A sharp approach and capture of liquidity without the possibility of continuing growth could lead to a correction by half or the entire local range (to 2.16).
Resistance levels: 2.3288, 2.357, 2.45
Support levels: 2.25, 2.213, 2.16
If the retest of resistance at 2.3288 ends in a false breakout, then subsequent consolidation below the level could trigger a correction to the above support and interest zones.
Best regards, R. Linda!
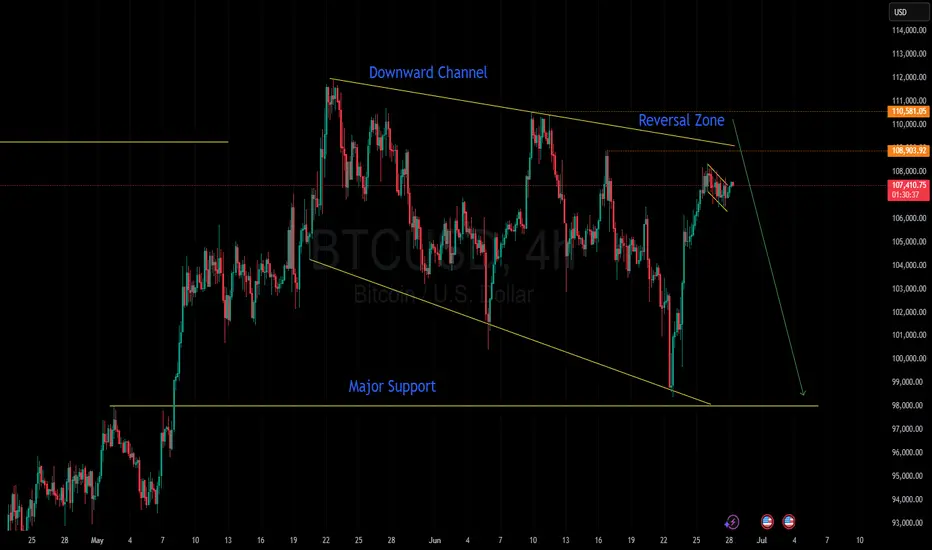
Bitcoin can turn around from seller zone and start to declineHello traders, I want share with you my opinion about Bitcoin. The price previously broke above the support line and made a strong bullish move from the buyer zone (99300–100500 points). After the breakout, the price started rising steadily and is now approaching the Seller Zone (108500–109500), which also coincides with the resistance line of the downward channel. This area has shown strong bearish pressure in the past. Every time the price entered this zone, it quickly reversed. It’s a key area where many traders seek short-term opportunities. Currently, price is just entering this zone again and showing early signs of weakening momentum. Given the channel's structure, past price behavior near this resistance level, and the presence of the seller zone, I expect BTCUSD to turn around soon. Once the price rejects this level, I anticipate a reversal and a move back into the channel, continuing the downward trajectory. My first target is set at 103000 points, near the center of the range and above the support level (100500). This area has been tested multiple times before and may act as a strong buffer again. Please share this idea with your friends and click Boost 🚀
Disclaimer: As part of ThinkMarkets’ Influencer Program, I am sponsored to share and publish their charts in my analysis.
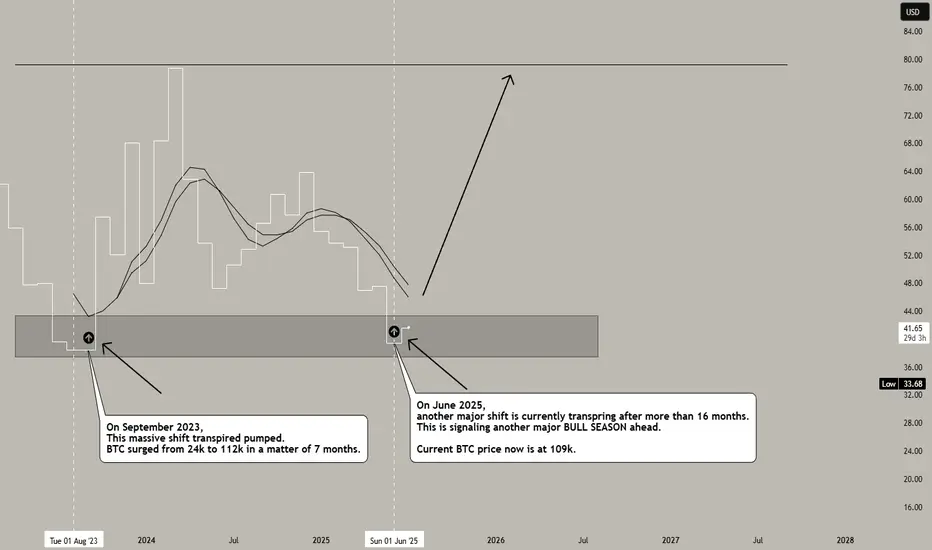
BVIV major BULL season ahead, BTC (from 106k) and ALTS ↑↑↑BVIV volatility index is a major confluence that 99% don't look at. Proof of this is there are only 3 posts about it, and one of them is mine lol. This is the 4th one. So you know its special.
This btc index is a major predictor of the market. When this shifts majorly, the whole market gets magnetized by it in massive scale.
Based on the current long term metrics. BVIV is hinting of another monster shift. It took 16 months for this signal to resurfaced. Last one was from September 2023, where BTC surge from 24k to 112k in 7 months. And as of this writing, June 2025 another big shift is transpiring after 16 months of long wait -- conveying another major ascend ahead in the next coming months.
Ideal seeding season is now -- you cant miss out because this change in structure doesnt come often. When this shows up, YOU SHOW UP. :)
Expect some weighty rise on the next few seasons. Market will be very very generous.
Spotted at 106k btc / 2400 eth.
Targets: Sky is the limit.
TAYOR.
Trade safely.
Not financial advice.
Wait for your EDGE...
Discipline is what separates professionals from amateurs.
Stay patient. Wait for your edge. Let the probabilities work in your favor.
👉 “Agree with this? Hit Boost to spread the message.”
#TradingPsychology #Discipline #BTC #Bitcoin #Forex
#TradingMindset #AlBrooks #TradingDiscipline #PriceAction #ForexTrading #CryptoTrading #StockMarket #MJTrading #TradingQuotes #TraderLife #MindOverMarkets
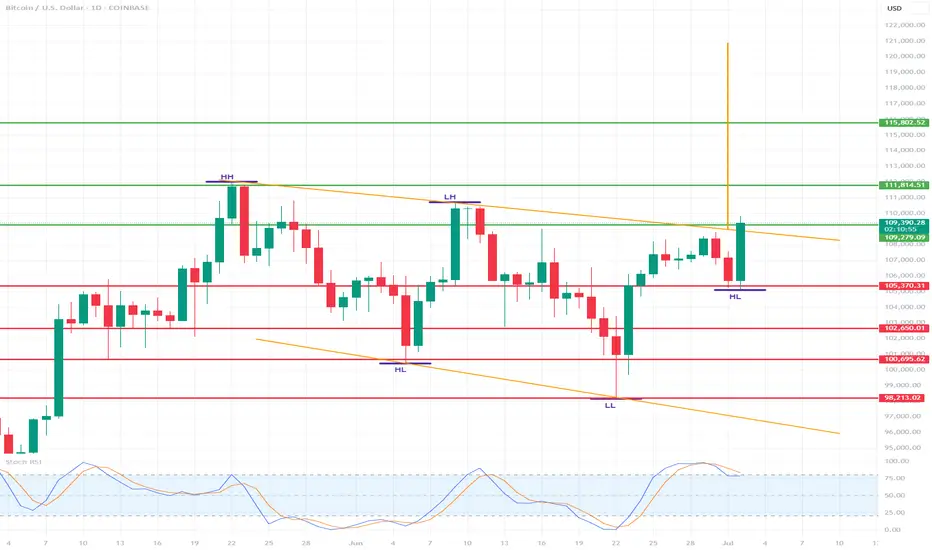
BTC with potential for $115,000/$120,000🔍 Market structure (Price Action)
📈 Trend:
The market previously formed higher highs (HH) and higher lows (HL) – a classic uptrend.
Then there was a correction and a lower high (LH) and lower low (LL) appeared – a potential change in the trend to a downtrend.
The last two lows are again HL (Higher Lows) – suggesting an attempt to return to the uptrend.
🔄 Key support and resistance levels
✅ Resistance (green horizontal lines):
117.469 – local resistance and potential breakout target from the current range.
115.802 – confirmed resistance from previous consolidations.
111.814 – strong local resistance (LH – Lower High formed there).
109.341 – current resistance, the price is currently testing it.
🛑 Support (red horizontal lines):
105.370 – local support, price reacted at this level in recent days.
102.650 – important support, level of previous HL.
100.095 – consolidation level before breaking out upwards.
98.213 – last LL – very important level in the context of defending the structure.
🧭 Structure of peaks and troughs
HH: Higher High – confirmed the previous uptrend.
LH: Lower High – first warning about changing the structure to down.
LL: Lower Low – confirmed a potential change to downside.
HL (x2): two more higher lows – suggest a possible return to growth.
📊 Stochastic RSI (at the bottom of the chart)
The oscillator is currently in the overbought zone (>80), approaching a downward crossover.
It suggests a possible short-term halt in growth or correction.
But in strong trends it may "stick" to the upper range.
📌 Potential scenarios:
🟢 Bullish:
If the price breaks above 109.341, it may test 111.814 and then 115.802.
Continuation of the HL → HH formation will confirm a trend reversal and further growth.
🔴 Bearish:
If the price does not stay above 109k and breaks below 105.370, there is a risk of a test of 102.650 and lower.
A break of 100.095 and especially 98.213 will negate the growth structure.
🧠 Conclusions:
The market is at a key decision point - HL formation vs. resistance zone.
Buyers' strength will be confirmed only after breaking 111-112k.
Stochastic RSI warns of potential pullback or consolidation.
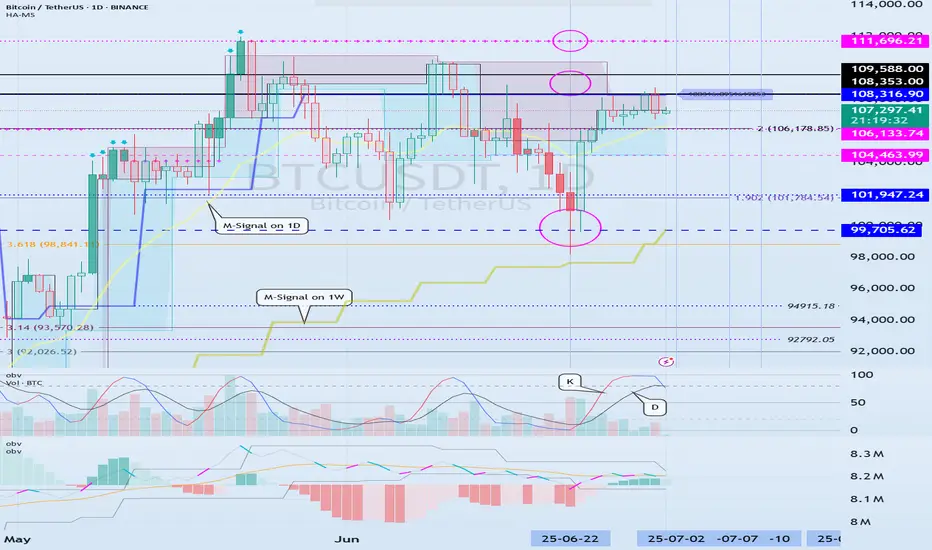
Check if price can hold above M-Signal indicator on 1D chart
Hello, traders.
If you "Follow", you can always get new information quickly.
Have a nice day today.
-------------------------------------
I failed to register a modified indicator of StochRSI indicator on TradingView alone, so I added it to the existing OBV by readCrypto indicator.
From the top of the indicator setting window to the bottom
1. OBV indicator of Low Line ~ High Line channel
2. PVT-MACD oscillator indicator
3. StochRSI indicator
They are registered in the order above.
Since the values used are all different, you should activate and use one indicator.
Please check the chart above.
------------------------------------------
(BTCUSDT 1D chart)
It is showing a downward trend as it failed to rise above the HA-High indicator (108316.90) on the 1D chart.
It is currently checking whether there is support near 107340.58, which is the StochRSI 50 indicator point.
If it fails to receive support and falls, it is expected to fall to around 104463.99.
The 104463.99 point is the DOM (60) indicator point of the 1W chart, which corresponds to the end of the high point on the 1W chart.
Since the StochRSI 20 indicator point is formed near the 104463.99 point, its importance can be considered high.
-
Since the M-Signal indicator of the 1D chart is passing near 106133.74, there is a possibility of volatility when touching this area.
Since the volatility period begins around July 2 (July 1-3), it is necessary to keep an eye on the current movement.
-
However, the key is to buy near the HA-Low indicator and sell near the HA-High indicator, so the current movement may be natural.
This volatility period is expected to last until around July 10 (July 9-11), so be careful when trading to avoid being fooled by fakes.
----------------------------------------
- The StochRSI indicator is showing signs of transitioning to a state where K < D.
- The PVT-MACD oscillator indicator is showing signs of decline.
- The OBV indicator of the Low Line ~ High Line channel is showing signs of decline in the High Line.
Therefore, if you look at the indicators, they are showing signs of decline overall.
However, if the OBV rises above the High Line, the price will show signs of rise.
Therefore, we need to observe the movements of the indicators while checking whether there is support at the StochRSI 50 indicator point.
Basically, the time to make a purchase is when it shows support near the DOM (-60) ~ HA-Low indicator.
If you want to make a purchase outside of that, you should not forget that a short and quick response is required.
The indicators that tell you the high point are HA-High, DOM(60) indicators.
In addition, there are StochRSI 80 and StochRSI 20 indicators that require quick response.
-
Thank you for reading to the end.
I wish you successful trading.
--------------------------------------------------
- Here is an explanation of the big picture.
(3-year bull market, 1-year bear market pattern)
I will explain the details again when the bear market starts.
------------------------------------------------------
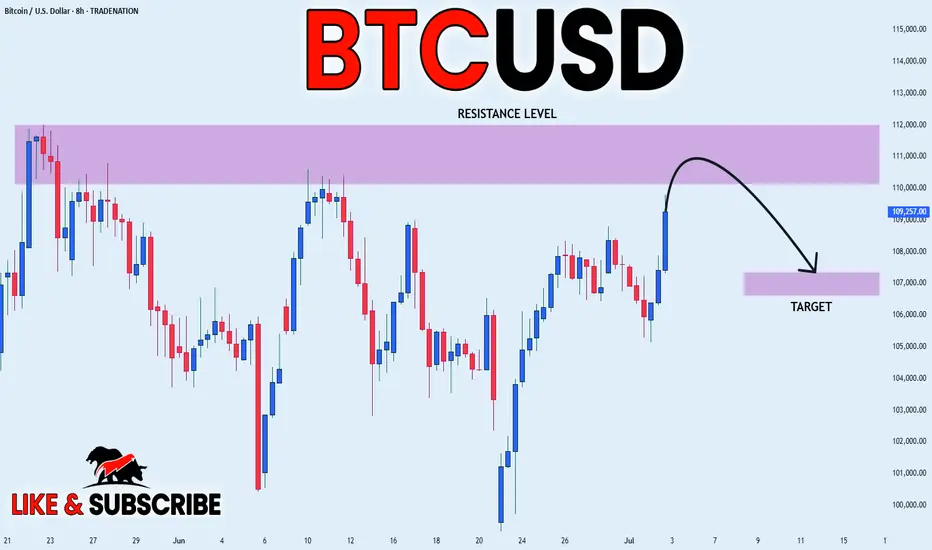
BITCOIN STRONG RESISTANCE AHEAD|SHORT|
✅BITCOIN is going up now
But a strong resistance level is ahead at 112,000$
Which is also an All-Time-High
Thus I am expecting a pullback
And a move down towards the target of 107,300$
SHORT🔥
✅Like and subscribe to never miss a new idea!✅
Disclosure: I am part of Trade Nation's Influencer program and receive a monthly fee for using their TradingView charts in my analysis.
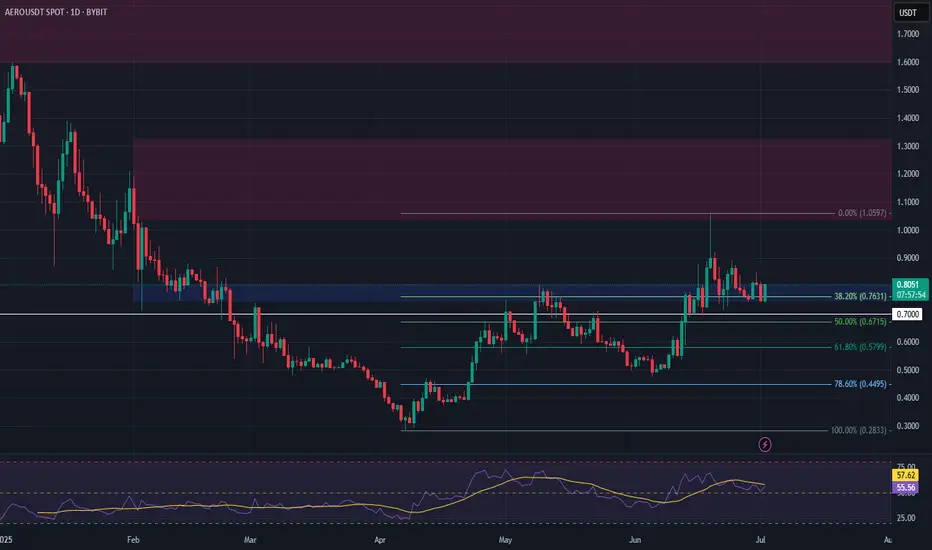
AERO Long Swing Setup – Strong Pullback into Fibonacci SupportAERO has shown notable strength in recent months and is now retracing into a key support zone, aligning with the 38.2% Fibonacci level. The $0.75–$0.80 area offers a solid long swing opportunity.
📌 Trade Setup:
• Entry Zone: $0.75 – $0.80
• Take Profit Targets:
o 🥇 $1.04 – $1.32
o 🥈 $1.60 – $2.05
• Stop Loss: Daily close below $0.70
BTC – Holding or Rolling?BTC has pushed up from the late June low and is now testing the 78.6% Fibonacci retracement zone from the prior downswing. Price is currently sitting around 109.5K–110K, directly in a high-confluence rejection area. This level aligns with the top of the recent range, 78.6% retracement, Bollinger Band resistance, and the zone where the last breakdown began.
While the move resembles a double bottom or W-pattern on first glance, structure invalidates the bullish case:
The second low was lower than the first, breaking symmetry.
The second high is still lower than the June high near 111.9K.
RSI made a lower high while price made a higher high — classic momentum divergence.
Volume has not increased meaningfully on the bounce, suggesting a lack of strong buyer commitment.
Until BTC reclaims and holds above 111.9K on strong volume, this looks like a lower high inside a broader downtrend.
Short Setup Thesis
Entry Zone:
109.5K–110.5K (zone of rejection, aligned with 78.6% Fib and prior supply)
Stop Loss Zone:
Above 112K–113K (a full reclaim of prior highs would invalidate the setup)
Target Zones:
TP1: 102K–100K (local support range and prior consolidation area)
TP2: 97K–95K (Fibonacci cluster and volume shelf)
TP3: 91K–88K (structure low and potential sweep zone)
Break Trigger / Confirmation:
A daily close below 106K–105K would confirm bearish continuation. Weak retests into this zone would provide additional short entry opportunities.