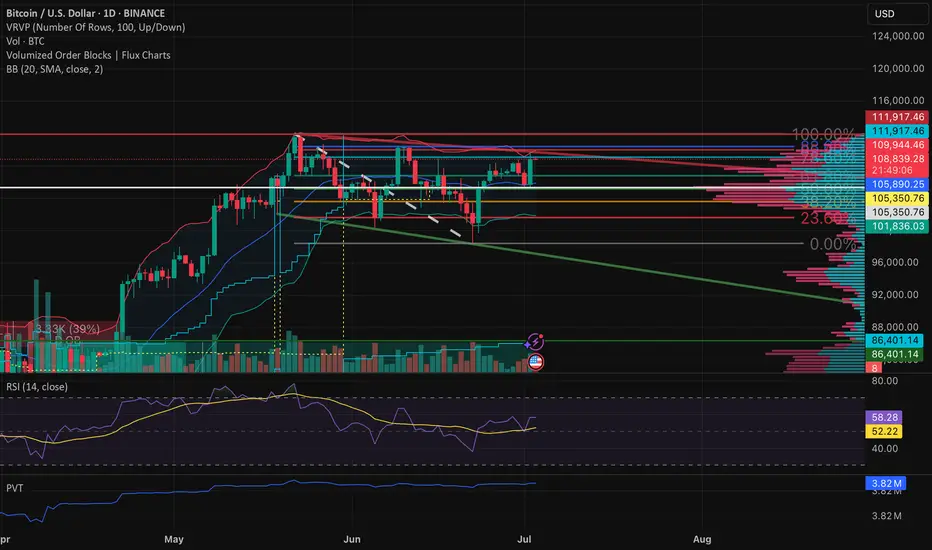
BTC – Holding or Rolling?BTC has pushed up from the late June low and is now testing the 78.6% Fibonacci retracement zone from the prior downswing. Price is currently sitting around 109.5K–110K, directly in a high-confluence rejection area. This level aligns with the top of the recent range, 78.6% retracement, Bollinger Band resistance, and the zone where the last breakdown began.
While the move resembles a double bottom or W-pattern on first glance, structure invalidates the bullish case:
The second low was lower than the first, breaking symmetry.
The second high is still lower than the June high near 111.9K.
RSI made a lower high while price made a higher high — classic momentum divergence.
Volume has not increased meaningfully on the bounce, suggesting a lack of strong buyer commitment.
Until BTC reclaims and holds above 111.9K on strong volume, this looks like a lower high inside a broader downtrend.
Short Setup Thesis
Entry Zone:
109.5K–110.5K (zone of rejection, aligned with 78.6% Fib and prior supply)
Stop Loss Zone:
Above 112K–113K (a full reclaim of prior highs would invalidate the setup)
Target Zones:
TP1: 102K–100K (local support range and prior consolidation area)
TP2: 97K–95K (Fibonacci cluster and volume shelf)
TP3: 91K–88K (structure low and potential sweep zone)
Break Trigger / Confirmation:
A daily close below 106K–105K would confirm bearish continuation. Weak retests into this zone would provide additional short entry opportunities.
1-BTC
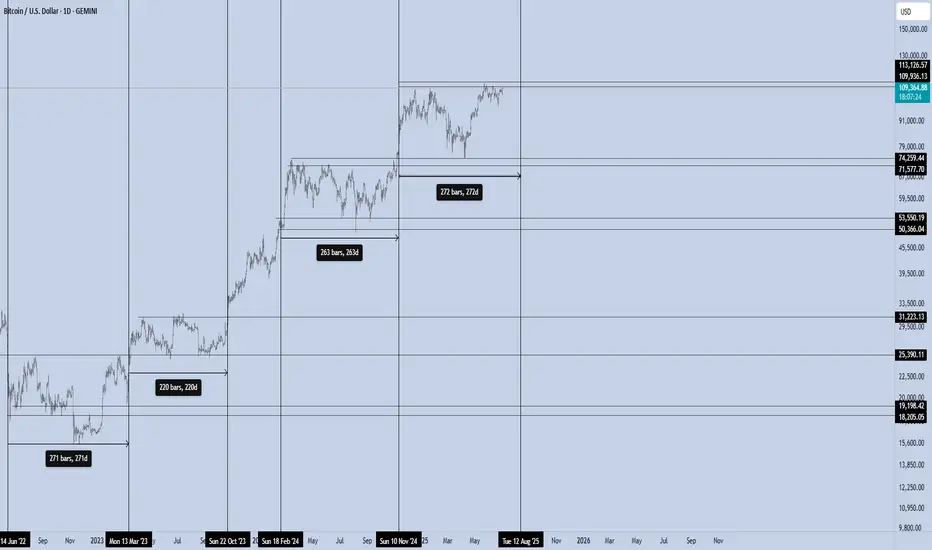
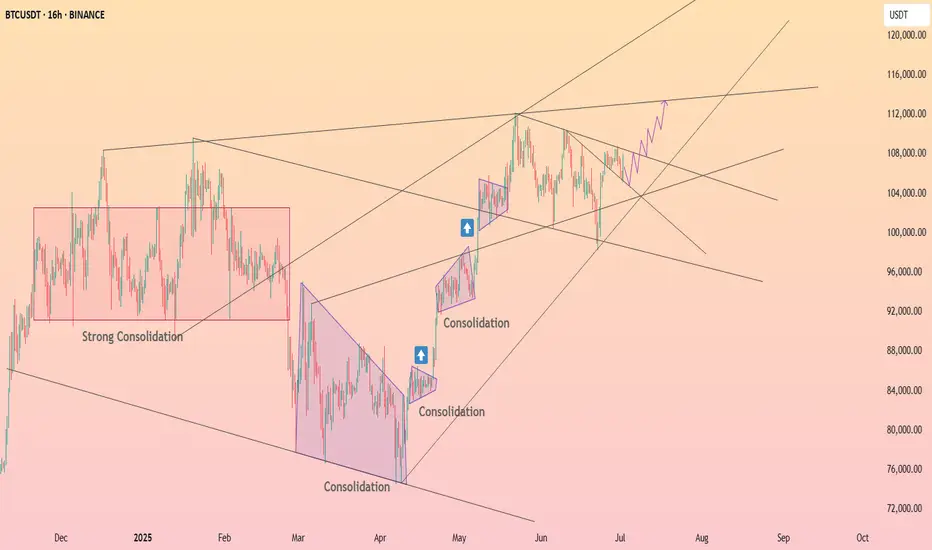
Bitcoin – The 270/100 CycleBitcoin isn’t just trading. It’s pulsing — in cycles that reward those who understand timing as much as price.
Over the last two years, BTC has shown a repeating pattern with surgical precision:
Range Phase:
Each macro consolidation lasts ~220 to 270 days, where price builds structure, absorbs supply, and prepares for its next expansion. This is the quiet phase — the zone where conviction is tested, and weak hands exit.
Impulse Phase:
What follows is a ~100-day vertical leg, where BTC surges between +50% to +80%, targeting the next macro resistance. We’ve seen this repeatedly:
Accumulate → Expand → Re-accumulate → Expand.
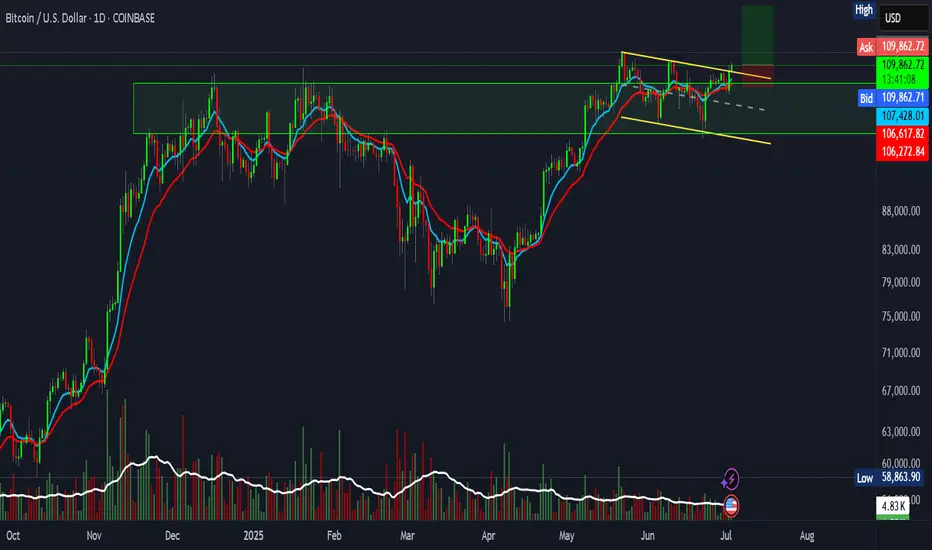
BTC Setup: 2.7 R:R"Bitcoin Poised for New Uptrend After Bull Flag Breakout Retest"
Bitcoin appears ready to begin a new uptrend after successfully retesting the breakout from a bull flag pattern and completing consolidation above key support.
This setup offers a 2.7:1 risk-to-reward ratio, with the following trade parameters:
Entry: $109,965.79
Stop Loss: $106,300
Target: $120,000
BTC - will it touch ATH @ 112K ?Well the move of BTC was moved just touching the 4H or 1H ob acted as a well cushion and moved up, Looks like this is going to happen for once and then can be seen!
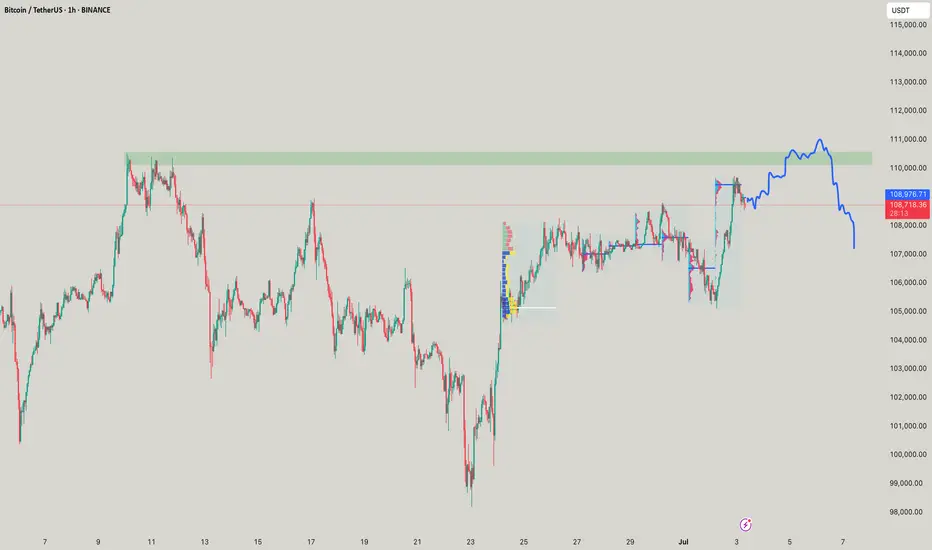
HolderStat┆BTCUSD ready to break through the resistanceBINANCE:BTCUSDT has completed another consolidation breakout and is coiling near key resistance. The price action points toward a move to 114,000 if the 102,000 level holds and volume confirms the continuation trend.
Bitcoin BTC Trade Plan: Watching for Breakout or Pullback Entry📊 Currently watching BTC (Bitcoin) as price action remains bullish overall, but we're approaching a key decision point 🎯
💹 Price is pushing higher, but with some signs of exhaustion after the recent rally ⚠️ — and with the weekend approaching, we could either see a continuation higher or a healthy pullback
I’m keeping an eye on two potential trade scenarios:
1️⃣ A break and clean retest of the recent high, which could offer a continuation long if momentum follows through 🚀
2️⃣ A retracement into equilibrium — a deeper pullback toward fair value 📉 — which could also present a high-probability long setup if confirmed with structure and reaction 📈
Either way, I’m letting the market reveal its hand and waiting for one of these setups to play out before committing 💡
💬 Not financial advice — always assess your own risk and confirm with your own analysis.

BTC Weekly Analysis : Rise or Fall ? Let's SeeBy analyzing the #Bitcoin chart on the weekly timeframe, we can see that last week’s candle closed at $108,350, and BTC is currently trading around $107,500. If the price manages to hold above $105,700, we could expect further upside momentum. The next potential bullish targets are $111,700, $124,000, and $131,800.
So far, this analysis has yielded over 9% return, and we’ll be sharing more updates soon from lower timeframes!
🎥 If you enjoyed this video analysis and found it helpful, please show your support with a LIKE and COMMENT below!
These video-style breakdowns take time and effort, and I’ll only continue them with your support 🙌
Your engagement is my biggest motivation to keep going 💛
Thanks for being part of the journey!

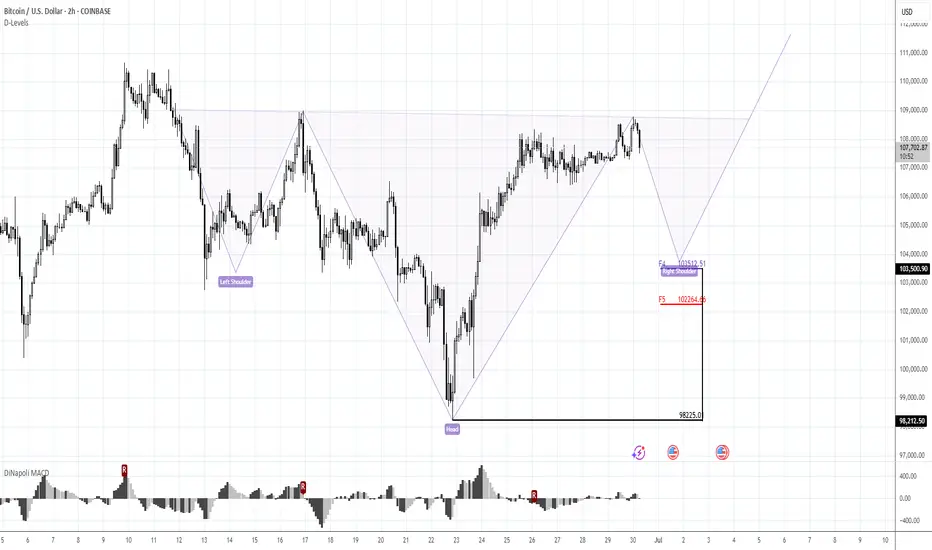
Bitcoin summer of fun...If we are in a continuation pattern, and Bitcoin breaks the neckline soon.
We could be on the cusp of a very interesting and strong few months of price action.
Continuation upward sloping #inverseheadandshoudlers

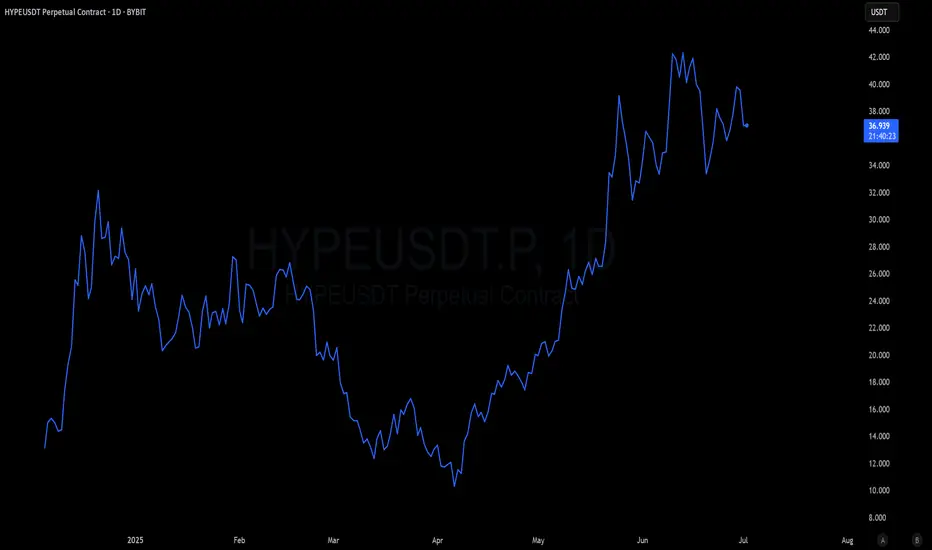
HYPEUSDT Probably CookedToken driven by demand from trading on Hyperliquid. Crypto looks set for a few month long consolidation probably into Q4.
That loss in trading volume will reduce demand for the token and the company may be forced to sell the token to come up with large gains for its clients. Either way it's a bearish catalyst for the token which has really ran hard. Ugly head and shoulders as well as a topping pattern in an overall financial market that looks like it wants a pull back
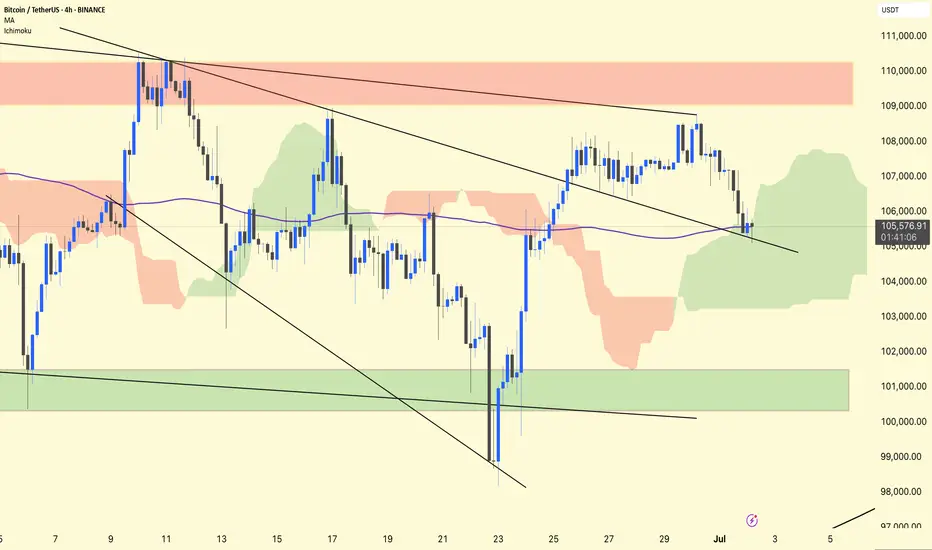
BTC/USDT 4H Analysis.
BTC remains in a retest phase after breaking out of the first descending broadening wedge.
The price has returned to test the upper wedge trendline, which is now acting as support around ~$105,500.
The purple 1 00-period MA (~105,570) overlaps this retest zone, adding additional confluence to the support.
Ichimoku
BTC is inside a green cloud, indicating indecision but not a confirmed trend reversal.
The cloud provides dynamic support in the ~$104,500–105,500 area.
Stay alert!
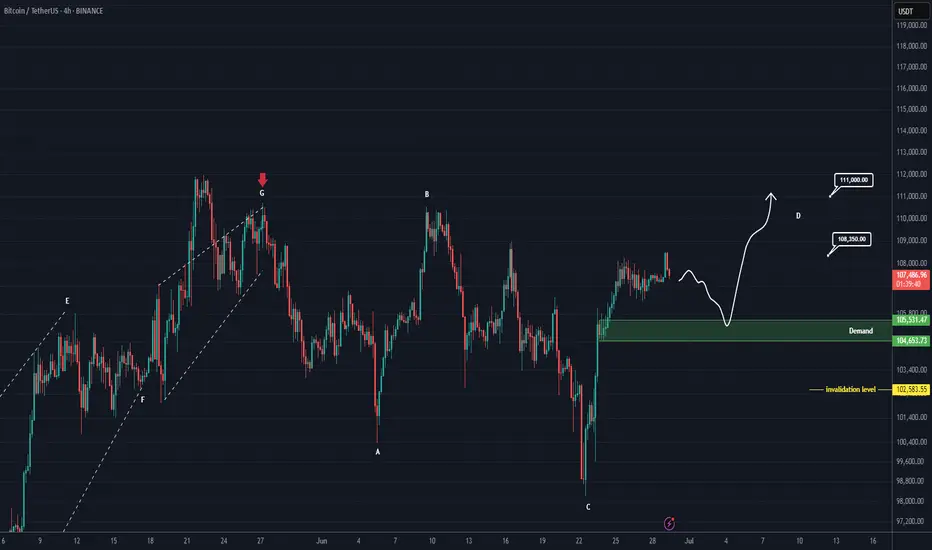
BTC Analysis (4H)This analysis is an update of the analysis you see in the "Related publications" section
Since the red arrow was placed on the chart, Bitcoin's bullish phase has ended and it has entered a corrective phase. This correction appears to be forming a Diametric pattern, and we are currently in the middle of wave E.
After interacting with the demand zone, the price may move toward the specified targets.
A daily candle closing below the invalidation level will invalidate this analysis.
For risk management, please don't forget stop loss and capital management
Comment if you have any questions
Thank You
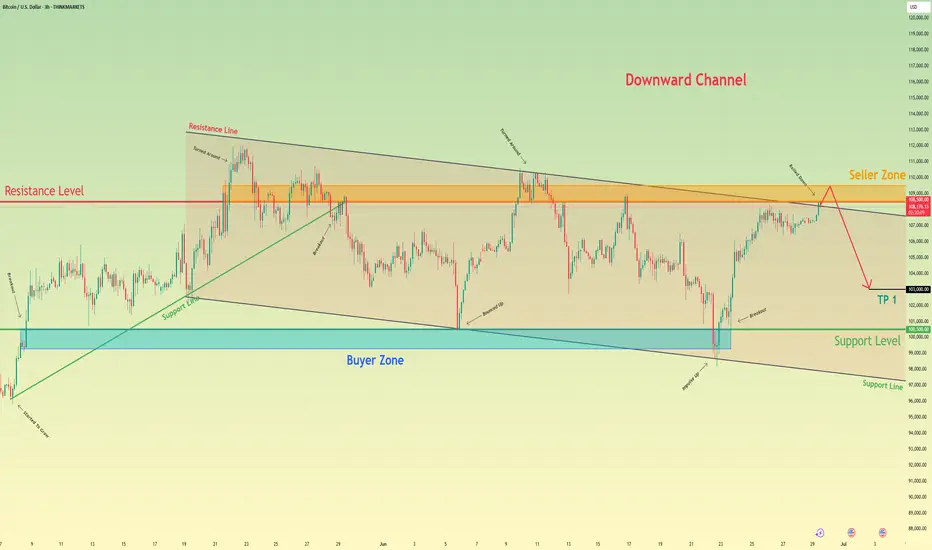
Bitcoin can turn around from seller zone and start to declineHello traders, I want share with you my opinion about Bitcoin. The price previously broke above the support line and made a strong bullish move from the buyer zone (99300–100500 points). After the breakout, the price started rising steadily and is now approaching the Seller Zone (108500–109500), which also coincides with the resistance line of the downward channel. This area has shown strong bearish pressure in the past. Every time the price entered this zone, it quickly reversed. It’s a key area where many traders seek short-term opportunities. Currently, price is just entering this zone again and showing early signs of weakening momentum. Given the channel's structure, past price behavior near this resistance level, and the presence of the seller zone, I expect BTCUSD to turn around soon. Once the price rejects this level, I anticipate a reversal and a move back into the channel, continuing the downward trajectory. My first target is set at 103000 points, near the center of the range and above the support level (100500). This area has been tested multiple times before and may act as a strong buffer again. Please share this idea with your friends and click Boost 🚀
Disclaimer: As part of ThinkMarkets’ Influencer Program, I am sponsored to share and publish their charts in my analysis.
Bitcoin - An Epic Move Awaits!Bitcoin gained 13% in H1 2025, outperforming Ethereum and Solana, which dropped ~25% and ~17% respectively—highlighting BTC's strength in turbulent market conditions.
Institutional wedge: spot-BTC ETFs saw huge inflows—BlackRock’s took in $336M, and total crypto product inflows approached $45B+ this year.
AI models foresee BTC holding $105K+ by end-June, with ChatGPT pointing to $118K and Grok forecasting $108K, based on momentum and ETF flows.
We see BTC holding the 20 MA and spiking to new all time highs.

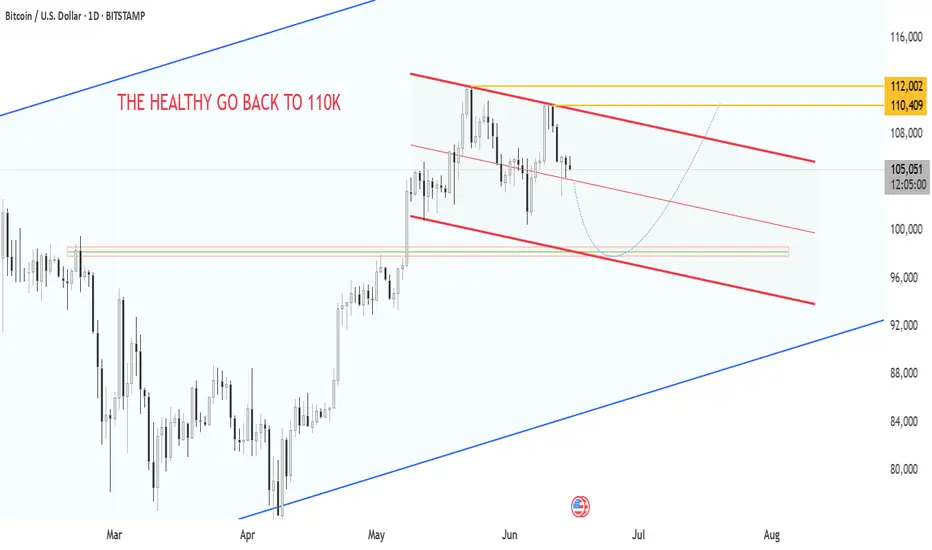
BITCOIN: The $110K Crossroads - Bull vs Bear Battleground! The Setup: "The Healthy Pullback Hypothesis
🔵 BLUE SUPPORT TRENDLINE (Rising from ~$76K)
The Foundation: This ascending support has held multiple tests
Current Status: Price dancing right on this crucial line
Psychology: Bulls' last stand
🔴 RED RESISTANCE CHANNEL (Descending from $112K peak)
The Ceiling: Two parallel resistance lines creating downward pressure
Pattern: Classic bearish channel formation
Volume Profile: Declining volume suggests exhaustion
🟡 YELLOW HORIZONTAL ZONES
Key Level 1: ~$98K (Previous resistance turned support)
Key Level 2: ~$112K (The rejection zone)
🟢 BULLISH SCENARIO (65% Probability)
Setup: Breakout above red channel resistance (~$108K)
🚀 Rocket Ship: Explosive move to $120K+
📉 Reality Check: Deeper correction to $95K-98K range
Entry: $97K - 98K (confirmed breakout)
Target 1: $104K
Target 2: $110K
Stop Loss: $95K
____________________________
⚠️ Risk Disclaimer: This analysis is for educational purposes. Always manage risk and never risk more than you can afford to lose. Markets can remain irrational longer than you can remain solvent! ⚠️
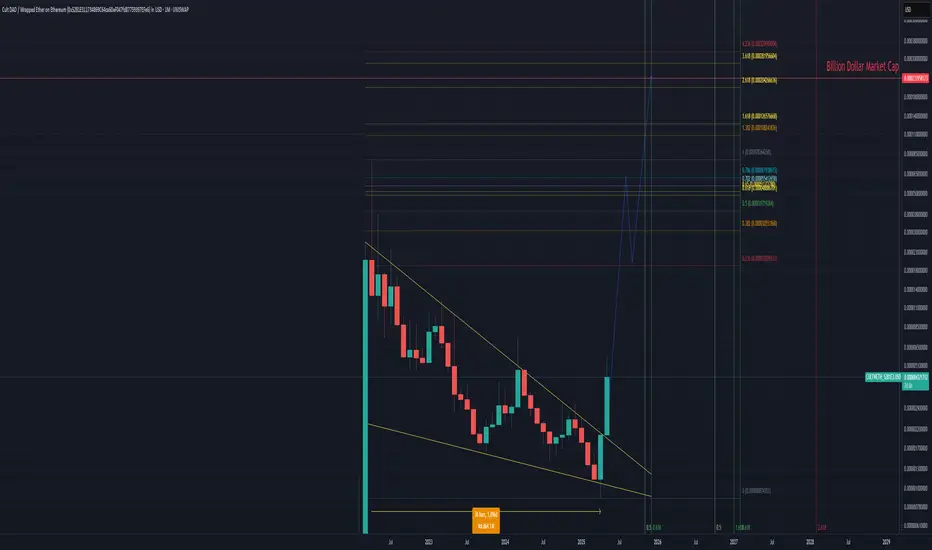
CULT DAO ON ITS WAY TO A BILLION DOLLAR MARKET CAPIf you want an in-depth look at everything CULT DAO, check out the TA below:
This is just a technical update.
A massive breakout occurred as expected. I’ve been highlighting the divergence forming in the MACD for months — it’s all detailed in the TA above.
Over the last 1,096 days, CULT DAO has formed a giant descending wedge — both in price structure and on the MACD. The path was clear.
Onwards and upwards.
A billion-dollar market cap is very possible by Q4 2025.
Breakthrough tech.
Mainnet launch around the corner.
Rocket ship loading.
Wait for something more reliableMorning folks,
Since our last update action was anemic. Nothing has changed seriously. BTC was able to show just minor upside action. Based on current performance, I do not want to take long position right here and prefer to wait for something more reliable. Because BTC action stands rather different from the one that we expected to see.
For example it might be H&S pattern on 1H chart. Thus, an area around 103K seems the one that we will keep an eye on.
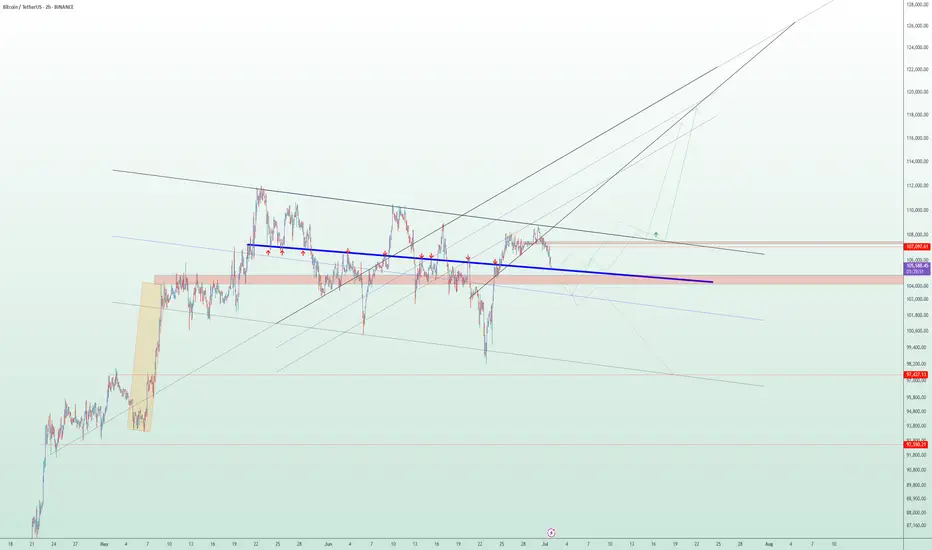
The Critical Blue Line – Will Bitcoin Soar or Sink
🔹 Bitcoin Technical Analysis – Key Blue Line, Bear Trap Possibility & Long-Term Scenario
On the Bitcoin chart, the blue horizontal level has acted multiple times as both support and resistance. The price has broken it several times but failed to sustain above, indicating high-volume decision-making zones by institutions and large players.
📉 Why this pattern keeps repeating:
Strong supply and demand concentration at this level.
Inability to break and hold shows market indecision.
Repeated fakeouts are likely used to shake out weak hands.
🔍 Important hidden scenario: Bear Trap Potential
If the price dips below the blue line but quickly reclaims it, it may form a bear trap, tricking short sellers into entering prematurely. This move could ignite strong bullish momentum from trapped sellers and renewed buyers.
🔮 If price holds above the blue line:
Signals market strength and potential bullish structure shift.
Targets:
109,800
117,200
120,000+ (Long-term)
📛 If support fails again:
Retracement toward the lower channel near 101,000 or lower is possible.
📊 Conclusion:
This zone is one of the most critical decision points in the current market. Traders should combine volume, candlestick behavior, and confirmation signals to avoid getting trapped by fake breaks
Wait for your EDGE...
Discipline is what separates professionals from amateurs.
Stay patient. Wait for your edge. Let the probabilities work in your favor.
👉 “Agree with this? Hit Boost to spread the message.”
#TradingPsychology #Discipline #BTC #Bitcoin #Forex
#TradingMindset #AlBrooks #TradingDiscipline #PriceAction #ForexTrading #CryptoTrading #StockMarket #MJTrading #TradingQuotes #TraderLife #MindOverMarkets
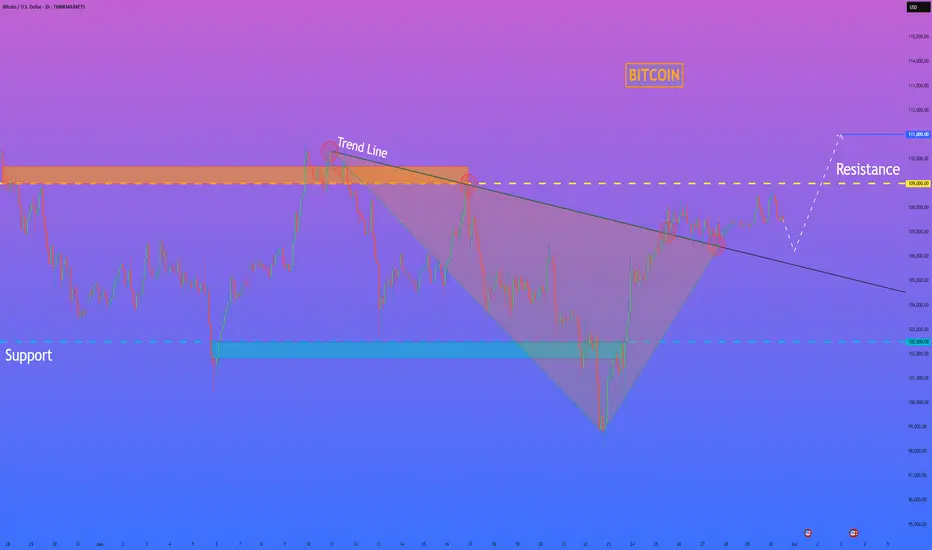
HelenP. I Bitcoin may continue grow and break resistance levelHi folks today I'm prepared for you Bitcoin analytics. After looking at this chart, we can see how the price broke the resistance level, which coincided with the resistance zone, and continued to move down next. When the price almost reached the support level, it turned around and tried to grow, but failed and dropped to the support zone. After this movement, BTC turned around and made an impulse up to the resistance zone, breaking the resistance level one more time. Then it reached the trend line and started to decline in a broadening wedge, where it broke the resistance level again. Later, the price even declined below the support level, breaking this level too and falling to the support line of the wedge pattern. Next, price turned around and made a strong impulse up to the resistance level, thereby breaking the support level with the trend line, exiting from the broadening wedge too. Bitcoin made a retest of the trend line and then continued to grow. In my opinion, BTCUSD will correct to almost to trend line and then rise to the resistance level. Then it can break this level and continue to move up; therefore, I set my goal at 111000 points. If you like my analytics you may support me with your like/comment ❤️
Disclaimer: As part of ThinkMarkets’ Influencer Program, I am sponsored to share and publish their charts in my analysis.
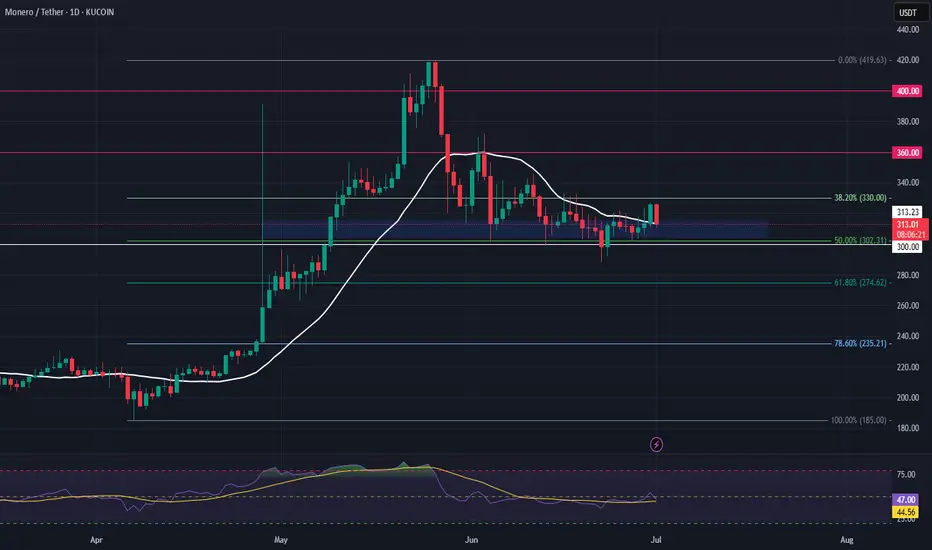
XMR Long Swing Setup – 50% Retrace with Structure ShiftXMR rallied from $200 to $400 and has now pulled back 50% of that move. With price reclaiming the 20-day SMA and a recent structure shift, there’s a solid setup forming with ~60% probability of continuation.
📌 Trade Setup:
• Entry Zone: $305 – $315
• Take Profit Targets:
o 🥇 $360
o 🥈 $400
• Stop Loss: Daily close below $300
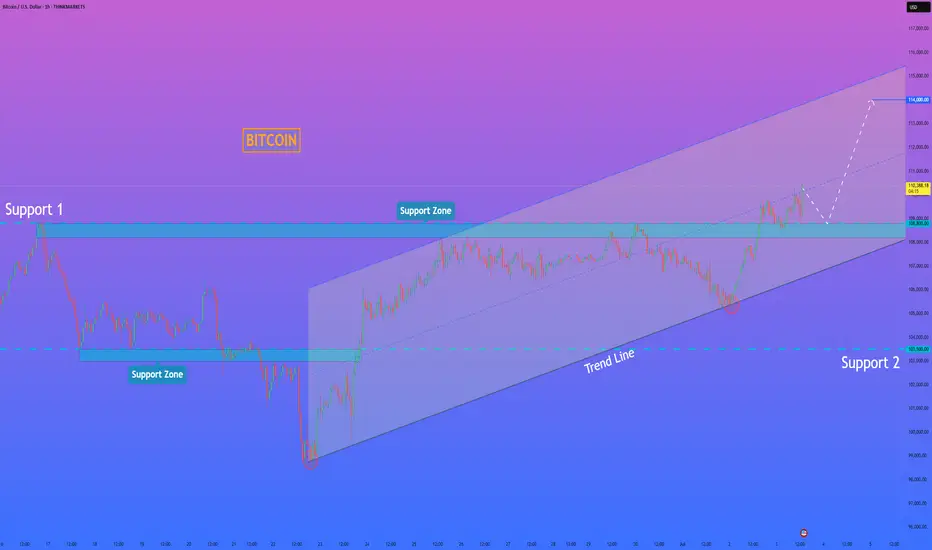
HelenP. I Bitcoin may correct to support level and continue growHi folks today I'm prepared for you Bitcoin analytics. If we look at the chart, the price has formed a clean upward channel after bouncing from the strong support zone at 103500 - 103000 points. This movement marked the beginning of a new bullish phase. Price continued to rise step by step, confirming the structure with higher highs and higher lows. After reaching above 110000 points, it made a minor pullback but still trades above Support 1 - 108800 points. This zone, 108800 - 108200 points, aligns well with the midline of the channel and may serve as a strong area for buyers to re-enter. The price is currently trading around 110382 points and is still respecting the channel structure. As long as BTCUSD stays above the support zone and inside the ascending channel, I expect a potential continuation toward the upper boundary. My current goal is 114000 points - near the resistance line of this bullish channel. Given the strong trendline support, clean reaction at each correction, and buyer activity on lows, I remain bullish and anticipate further growth. If you like my analytics you may support me with your like/comment ❤️
Disclaimer: As part of ThinkMarkets’ Influencer Program, I am sponsored to share and publish their charts in my analysis.
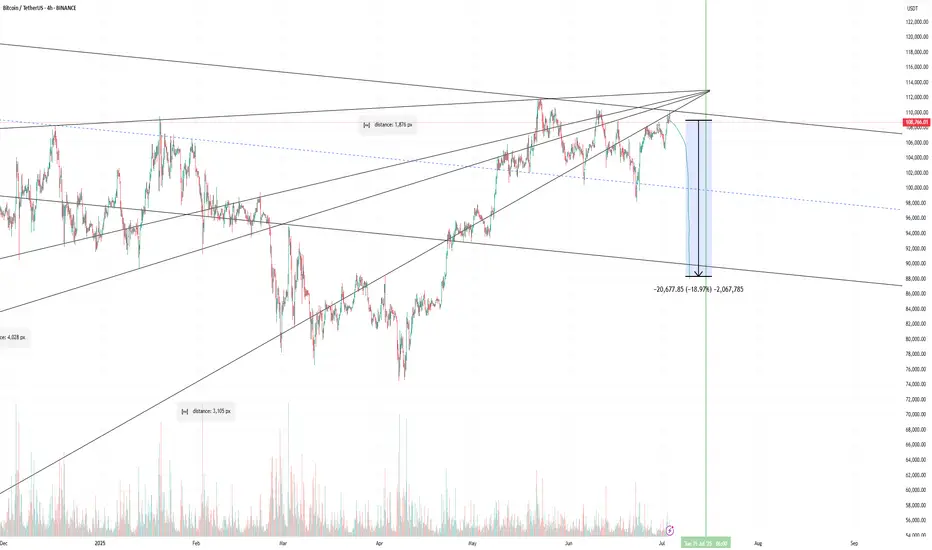
BTC BIG SHORT!We did a mirror retest, and many other signals also point to a sharp decline, indicating numerological codes 69/96.
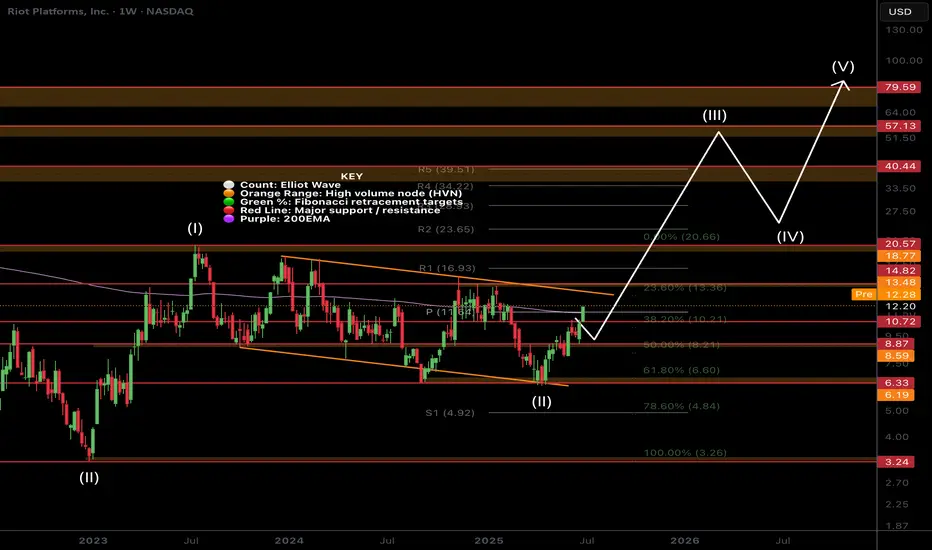
$RIOT Continues to Follow PathNASDAQ:RIOT Is sticking closely to the plan testing the bottom and top of the channel multiple times.
Price closing above the weekly 200EMA and weekly pivot Friday will be a very bullish signal. As we have over 4 tests of the upper boundary resistance there is a high probability we break through and continue higher in a high degree wave 3.
Initial targets are the weekly R5 pivot at $39 and all time high at range at $79.
Price tested the .618 Fibonnaci retracement in a complex correction for wave 2.
Analysis is invalidated below the channel support.
Safe trading