BNB / USDT 1D INTERVAL, Support AND ResistanceHello everyone, let's take a look at the BNB to USDT chart in 1D intervale. As you can see, the price came out of the sideways channel and is currently hovering over the local uptrend line.
Let's start with the designation of the support line and as you can see the first support in the near future is $ 335, if the support breaks down, the next support is $ 320, $ 308 and $ 296.
Now let's move from the resistance line as you can see the first resistance is $ 361, if you can break it the next resistance will be $ 374 and $ 390.
Looking at the CHOP indicator, we can see that the energy has been used on the 1-day intervale, and the MACD indicator shows an upward trend.
1daychart

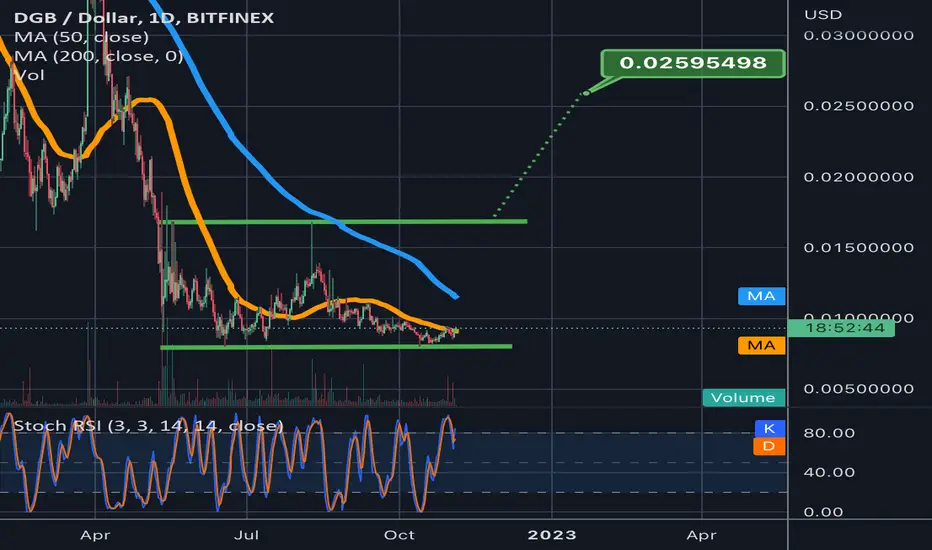
Speculative double bottom on digibyteDigibyte has done nothing to show that its about to reverse its downtrend yet, however we are starting to see the inklings of a possible double bottom forming. This is still so early in the pattern that its almost pure speculation on my part at this point. You should never try to trade a pattern until it has confirmed either a breakout or a breakdown. Although this could easily end up a fakeout that sends digibyte lower continuing its downtrend, with so many alts recently seeing bullish surges there is certainly a chance this double bottom could end up playing out. If it were to it would be close to a 180% gain from this level. WE can see there is also a possibility here in the near future of a golden cross. The fact that many other alt coins have recently seen successful golden crosses with QNT leading the way, gives us bullish confluence that increases the probability that digibyte could also experience a successful golden cross in the near future. Still mostly speculation at this point, but just enough bullish confluence to keep an eye on this one and see how it develops. *not financial advice*
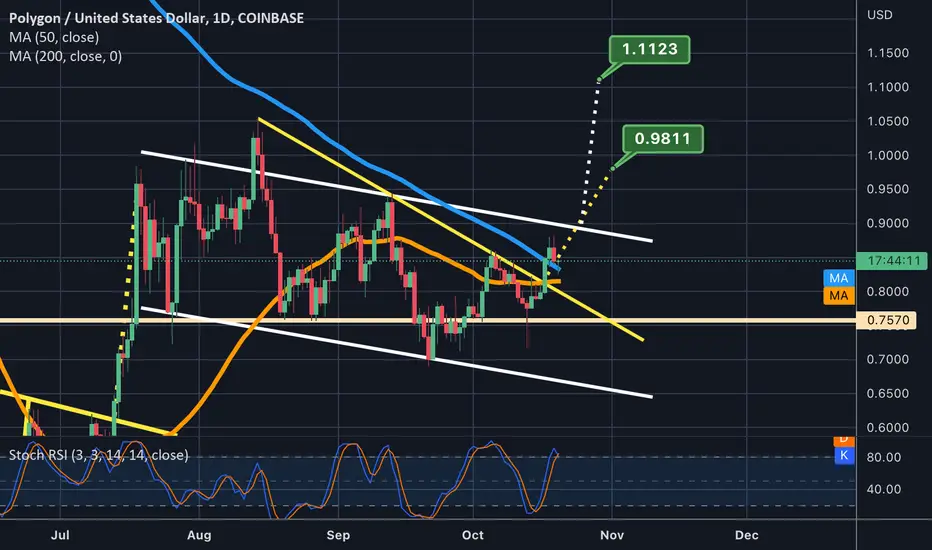
Matic nearing a potential golden cross. 2 current bull targetsIf the golden cross occurs and sustains itself, we should see both of these bullish targets hit in the near future. We are currently above the yellow neckline and would reach the yellow target first. On the way there it would take us above the white channel, and flipping that channel to solidified support would validate its breakout and take us to the white price target. Best to keep an eye on the top trendline of the white channel as it is imperative that we flip its current resistance to solidified support in order to reach either target. *not financial advice*
MATIC / USDT 1D chart Targets and StoplossHello everyone, let's take a look at the 1D MATIC to USDT chart as you can see the price is moving above the downtrend line.
Let's start by setting goals for the near future that we can consider:
T1 = $ 0.98
T2 = $ 1.04
T3 = $ 1.21
and
T4 = $ 1.44
Now let's move on to the stop loss in case of further market declines:
SL1 = $ 0.88
SL2 = $ 0.77
SL3 = $ 0.69
SL4 = $ 0.60
and
SL5 = $ 0.48
Looking at the CHOP indicator, we can see that in the 1D range we have more and more energy, and the MACD indicator shows a downward trend, but it turned sharply up when it crosses the red line from the bottom, confirming the upward trend change.

Daily review of BTC interval 1DHello everyone, I invite you to the BTC / USDT review on a 1 day interval, as you can see locally the price is above the uptrend line and above the first trend.
Let's move on to determining the support as you can see the first support zone in the near future starts from $ 20,225 to $ 19,974, while the next support zone is much larger and starts from $ 19,295 to $ 17,640.
If we look the other way around, we'll set the points of resistance and in this situation the first resistance zone starts from $ 2790 to $ 21119, while the second resistance zone starts from $ 22,510 to $ 23,675.
Please pay attention to the CHOP index which indicates that in the 1D interval most of the energy has been used, and the MACD indicator indicates that we are close to a downward trend change.

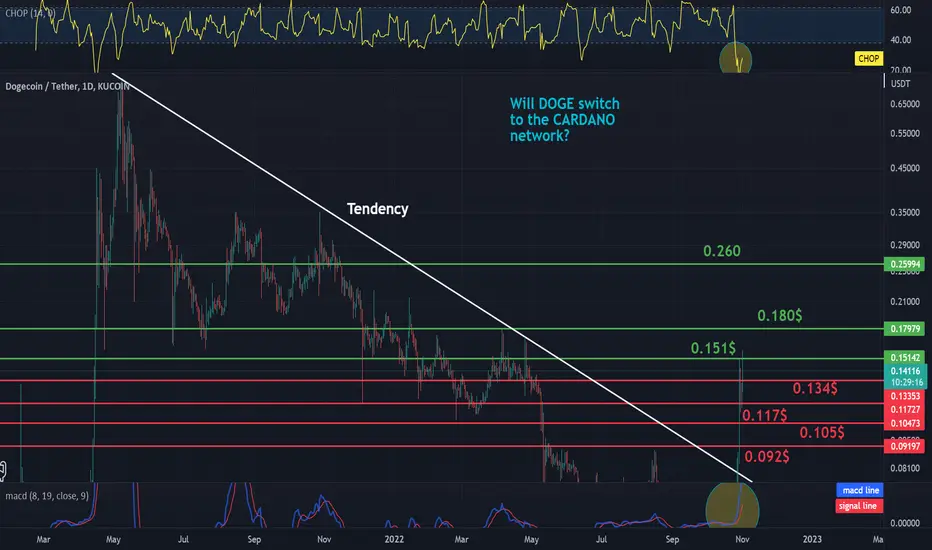
Will DOGE switch to the CARDANO network?Hello everyone, let's take a look at the 1D DOGE to USDT chart as we can see the price broke the trend marked with the white line.
Let's start by setting goals for the near future that we can consider:
T1 = $ 0.151
T2 = $ 0.180
and
T4 = 0.260
Now let's move on to the stop loss in case of further market declines:
SL1 = $ 0.134
SL2 = $ 0.117
SL3 = $ 0.105
and
SL5 = $ 0.092
Looking at the CHOP indicator, we can see that in the 1D range, the energy slowly starts to rebound, and the MACD indicator shows a local upward trend.
MATIC / USDT 1D chart Resistance and SupportHello everyone, let's take a look at the MATIC to USDT chart on the 1D interval. As you can see, the price moves in the sideways channel and locally above the uptrend line.
Let's start with the designation of the support line and as you can see the first support in the near future is $ 0.88, if the support breaks down, the next support is $ 0.83, $ 0.78 and $ 0.74.
Now let's move from the resistance line as you can see the first resistance is $ 0.96, if you can break it the next resistance will be $ 1, $ 1.04 and $ 1.07.
Looking at the CHOP indicator, we can see that the energy is slowly increasing in the 1D interval, while the MACD indicator shows an upward trend, but the blue line is close to the red crossing from above, which could confirm the trend change.

ADA/USDT TARGETS AND STOPLOSS 1DHello everyone, let's take a look at the 1D ADA to USDT chart as you can see the price is moving in the downtrend channel, however locally above the uptrend line.
Let's start by setting goals for the near future that we can consider:
T1 - $ 0.4047
T2 - $ 0.4267
T3 - $ 0.4499
and
T4 - $ 0.4829
Now let's move on to the stop loss in case of further market declines:
SL1 - $ 0.3986
SL2 - $ 0.3853
SL3 - $ 0.3719
and
SL4 - $ 0.3531
Looking at the CHOP indicator, we can see that in the 1D range the energy has been depleted and is slowly starting to rise, while the MACD indicator shows an upward trend.

ETH - USDT, 1D Interval Targets and Stoploss Hello everyone, let's take a look at the 1D ETH to USDT chart as you can see the price is moving above the downtrend line.
Let's start by setting goals for the near future that we can consider:
T1 - $ 1,632
T2 - $ 1766
T3 - $ 1,904
T4 - $ 2099
and
T5 - $ 2,342
Now let's move on to the stop loss in case of further market declines:
SL1 - $ 1463
SL2 - $ 1,340
SL3 - $ 1,241
SL4 - $ 1142
and
SL5 - $ 997
Looking at the CHOP indicator, we can see that in the 1D range the energy has been used, while the MACD indicator shows a local upward trend.

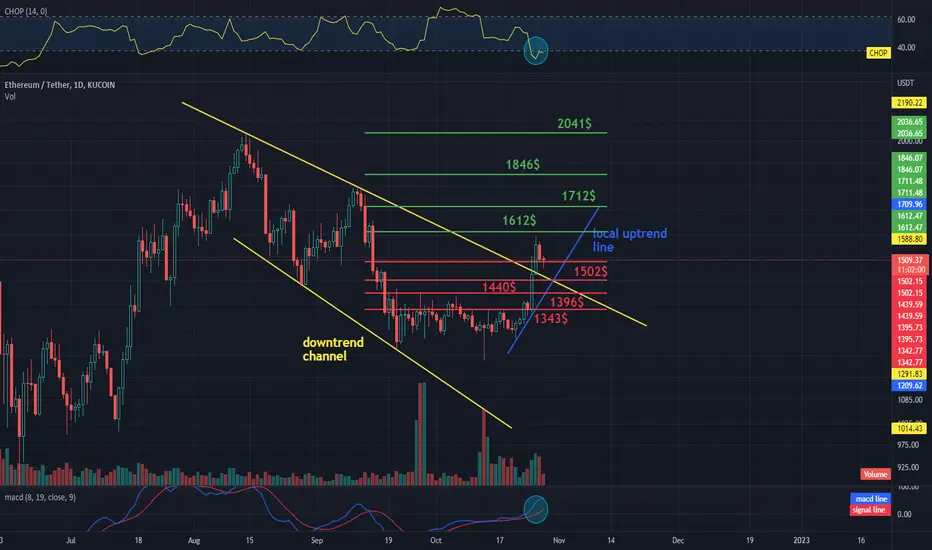
ETH - USDT, 1D Interval Resistance and Support Hello everyone, let's take a look at the ETHUSDT chart on the 1D interval. As you can see, we managed to leave the downtrend channel upwards, and we are currently moving over the local uptrend line.
Now let's move on to the designation of the support line and as you can see the first support where the price is currently at is one thousand five hundred and two dollars, if the support breaks down, the next support is one thousand four hundred and forty dollars, the next one thousand three hundred ninety six dollars and one thousand three hundred and forty three dollars.
Now let's move on to the resistance line, as you can see, the first resistance is sixteen hundred and twelve dollars, if you can break it, the next resistance will be one thousand seven hundred and twelve dollars, the next one is one thousand eight hundred forty-six and two thousand and forty-one dollars.
Please look at the CHOP index, we can see that on the one-day interval, energy is at the very bottom, and the MACD indicates an upward trend.
Eth appears to be breaking up from channel. Target $1843Just broke above the resistance of this brown neckline too. Next resistance on the way to the measured move target is the 200ma in blue. *not financial advice*

TOMOUSDT - 1dchart - resistance and supportHello everyone, I invite you to review the TOMOUSDT chart on a one-day interval, as you can see the price is moving in the downtrend channel marked by yellow lines.
It can be noticed that currently the price is on the spot of the June low and is slowly starting to accumulate.
Now let's move on to drawing a resistance line that price has on its way, and as you can see, the first resistance is at thirty-five cents, the second resistance is at thirty cents, and the third resistance is at twenty-six cents.
Then we'll look at what resistance TOMO has in its path when it starts to rise, and as you can see, the first resistance is forty-four cents, then forty-nine cents, the next one is fifty-two cents and fifty-six cents.
It is worth paying attention to the CHOP index, which indicates that energy has been used and is in the accumulation phase, and the MACD indicator indicates a local upward trend.

CRO / USDT 1D Interval- support and resistanceHello everyone, I invite you to a short 1-day CRO / USDT review.
At first, we see that price has been moving along the uptrend for a long time, but from the top to now we are below the downtrend.
Please note that we are moving briefly in the downtrend channel marked with yellow lines.
Now let's move on to determining the support that price has in the event of a further decline, and as you can see, the first support is at ninety-six thousandths of a dollar, another at eighty-seven thousandths of a dollar, seventy-nine thousandths of a dollar, and seventy-two thousandths of a dollar.
Next, we will set the points of resistance in the same way, if the price changes direction and starts to rise. The first resistance is at one hundred and eleven thousandths of a dollar, then at twelve cents, the next one is one hundred and twenty-seven thousandths of a dollar, one hundred and thirty-four thousandths of a dollar, and one hundred and forty-five thousandths of a dollar.
Please look at the CHOP index, which shows that we have more and more energy, and the MACD indicator, which indicates that we have entered an upward trend.

MATIC / USDT 1D chartPlease take a look at the MATICUSDT 1 day chart, as you can see the trend line has broken out and we are currently in the local sideways trend channel.
Now let's move on to the price support line, and as you can see, we have the first support at seventy-five cents, the next support at seventy cents, sixty-six cents, fifty-nine cents, and fifty-two cents.
Now let's see what resistance price has to face, and the first resistance is eighty-one cents, the next one at eighty-six cents, eighty-nine cents, ninety-four cents, and one dollar two cents.
Now please note the CHOP index which indicates that energy has been used up and the MACD indicator shows that we are close to entering a downtrend.

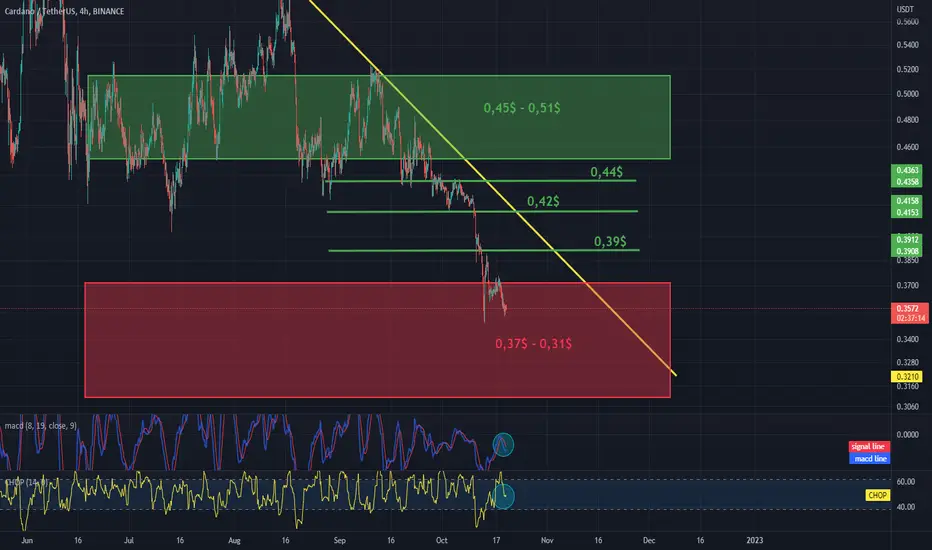
ADA/USDT 4H INTERVAL - resistance and supportAs we can see, the price is moving below the downtrend line.
Looking at the chart in the longer term, we can see that currently the price is in the support zone of thirty-seven cents to thirty-one cents.
Looking the other way, let's designate a resistance zone from forty-five cents to fifty-one cents.
However, it is worth designating points of resistance that the ADA must overcome before it reaches the long-term resistance zone.
As we can see in the near term when the price leaves the support zone over the top, we have resistance at thirty-nine cents, another resistance at forty-two cents and forty-four cents.
In the short term, the CHOP index shows that the downward movement has stopped and there is some energy left for the new one, and the MACD indicator shows a local downward trend, but you can see how the blue line is slowly starting to turn.
BNB / USDT 1D INTERVAL, Support and ResistanceHello everyone, let's take a look at the BNB to USDT one day chart. As you can see, the price is moving above the downtrend line.
Let's start with the designation of the support line and as you can see the first support in the near future is two hundred and sixty dollars if the support is broken, the next support is two hundred and forty-two dollars and two hundred and sixteen dollars.
Now let's move to the resistance line, as you can see, the first resistance is two hundred and eighty-eight dollars, if you can break it, the next resistance will be three hundred and twenty dollars and three hundred and fifty-three dollars.
Please note the CHOP index which indicates that the energy has been used up, and the MACD indicator indicates that we can shift to an uptrend.

XRP / USDT 1daychartWe have an interesting situation on the XRPUSDT, we can see that the price has created a sideways trend channel and is accumulating.
We are currently between the support and resistance zones and very close to the downtrend line from which the price has already tried to break up twice. Attacking the resistance zone again may result in a trend reversal and a further rise in price.

Quant continuing to pump; nearing a golden cross. Quant seems to be leading the market. Continuing to pump before the other cryptos and making its way towards a potential new inverse head and shoulder neckline. Of course it doesn’t have to find resistance at this neckline, but there is good probability it will…if so it should give us a great idea of where it’s next measured move will be once it breaks above the neckline. Also vastly approaching a golden cross here. Will be interesting to see where it’s price action goes in the next couple weeks but as of now I think I can safetly predict that it will at the very least reach this white line. *not financial advice*
BNB / USDT 1D INTERVAL, Resistance and supportHello everyone, let's take a look at the BNBUSDT chart on the 1 day time frame, as you can see we left the uptrend channel and we are currently moving in the sideways channel where the price is accumulating.
As you can see, we are at the bottom of the channel, which can be used for short-term licks.
As you can see, we have the first support right at the lower end of our current channel, then we have a strong support zone.
However, after leaving the current channel, we have a strong zone of resistance to further increases.
The CHOP indec indicates that the energy has run out and the MACD indicator shows a downtrend.

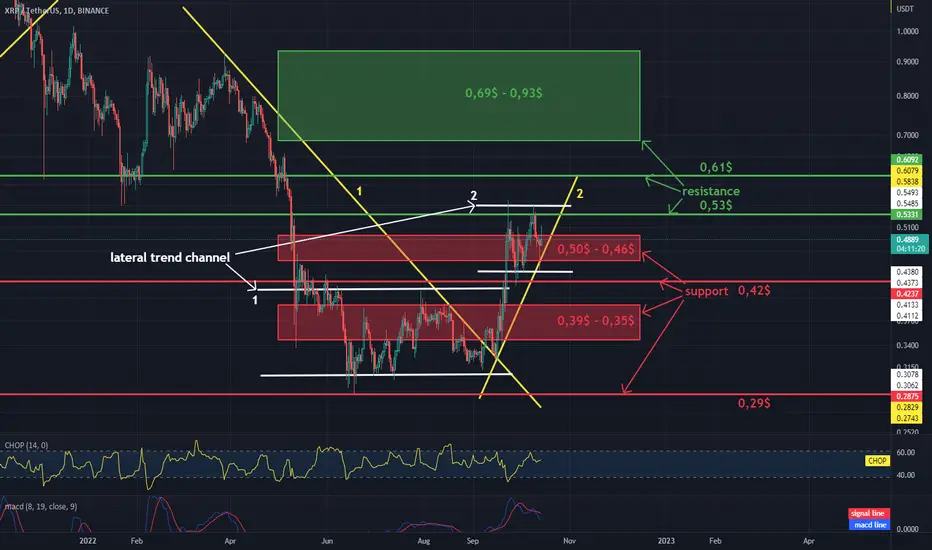
Long term review of the XRPUSDT marketHello everyone, I invite you to the XRPUSDT review on a 1-day interval. As you can see in the chart, the price came up from the first channel of the sideways trend and from the first line of the downtrend.
We are currently above the uptrend line, but we can also mark the second channel of the sideways trend.
Now let's move on to the support that xrp has in front of it and we can see that the first support zone is from $ 0.50 to $ 0.46, then we have support lines at $ 0.42, then the support zone from $ 0.39 - 0.35 $ and support at $ 0.29.
Looking in the other direction, we will analogously determine the points of resistance.
We have the first resistance at $ 0.53, the second resistance at $ 0.61, then we have a strong resistance zone that starts at $ 0.69 and continues all the way up to $ 0.93.
It is worth paying attention to the CHOP index which indicates that we have a lot of energy, while the MACD indicator indicates a local downward trend.
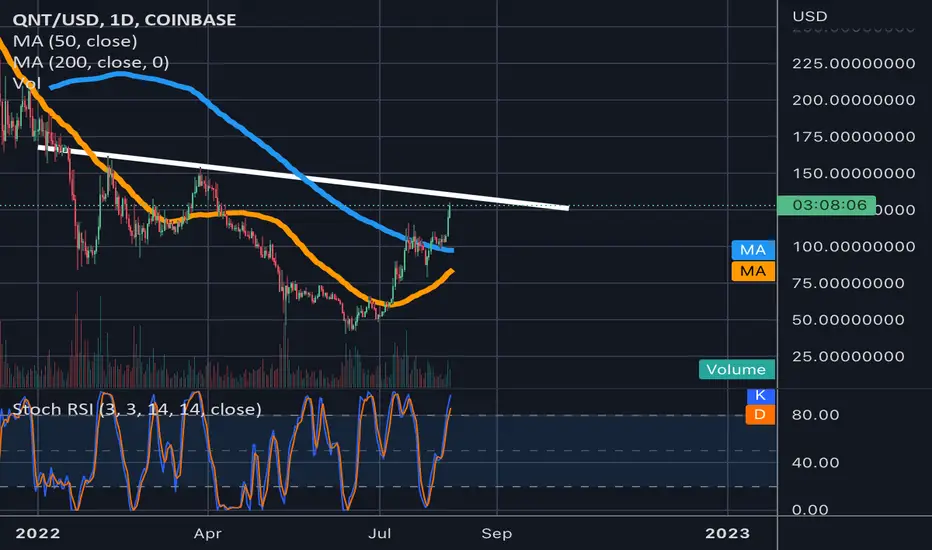
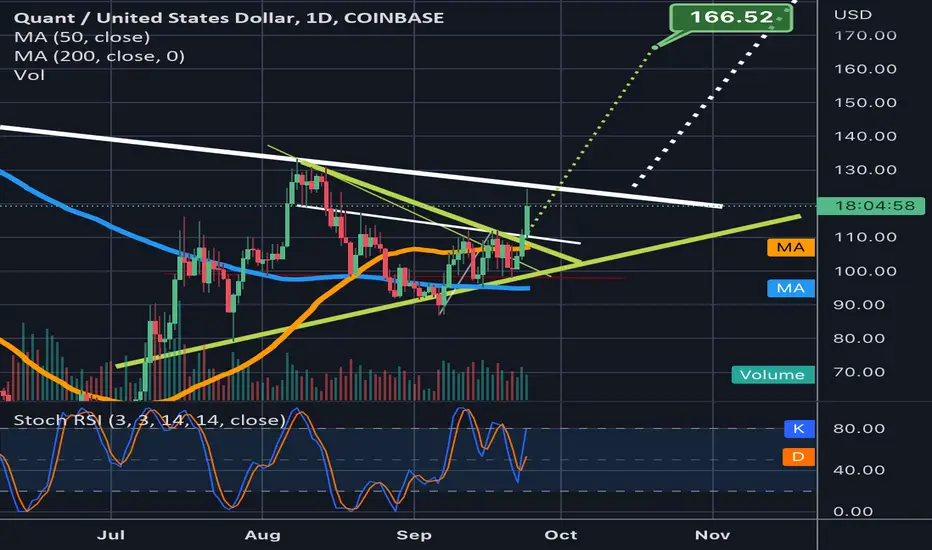
QNTUSD could validate the symmetrical triangle breakout here. Nice sized candle currently above the yellow symmetrical triangle..it has grown a mild bull wick since testing the thickerwhite line above the triangle which is the neckline to a bigger inverse head and shoulders pattern. It could come back down to retest the top trendline of the yellow symmetrical triangle…the most important thing is where the current daily candle closes and how the follow up candle behaves afterwards. As long as we close above the yellow trendline on the current candle probability favors the breakout…however breaking above the white neckline by the follow up candle and flipping it to support will really seal the deal. If we do validate the breakout I would not be shocked if price action came back down to retest the white neckline as support after reaching the triangles full breakout target at $166. If it can hold the white neckline as support after that its a good sign that the inverse head and shoulders pattern will be validating as well taking us even higher. Of course it doesnt have to retest the neckline to validate the inv h&s so wise to anticipate that outcome as well. One last thing to add is there is also a current smaller inv h&s we are breaking up from at the same time as the symmetrical. I forgot to put that patterns target on the chart but the smaller inv h&s target is $137. There’s always a possibility price action corrects after reaching 137 too. *not financial advice*
Daily review of BTC interval 1DHello everyone, let's take a look at the Bitcoin (BTC) to USDT chart on a 1 day time frame. As you can see, the price is moving towards the lower end of the uptrend channel.
Let's start with the designation of the support line and as you can see the first support where the price is currently at is $ 19204, if the support breaks, the next support is $ 19002 and $ 18,831.
Now let's move from the resistance line, as you can see, the first resistance is $ 19,437, if you can break it, the next resistance will be $ 19,661 and $ 19,846.
Looking at the CHOP indicator, we can see that we have a lot of energy in the 1-day interval, while the MACD indicator indicates entering a downward trend.

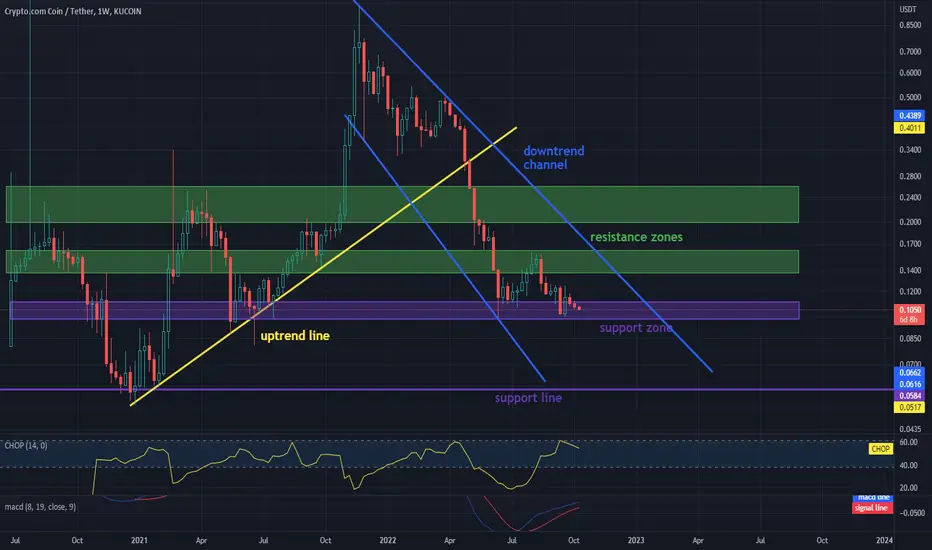
CRO / USDT 1W Interval- support and resistanceHi, let's take a look at the 1W CROUSDT chart. It is worth noting that we have dropped below the long-term uptrend and we are currently in the downtrend channel marked in blue.
Looking further, it is worth determining the support that the CRO has in the event of further declines and here we can see that the price is currently in the support zone, which is from $ 0.111 to $ 0.098. If the price drops below this zone, the next strong support is around $ 0.584.
Now let's move on to the resistance that the price will have to overcome to keep rising, and here we see that the first resistance zone starts at $ 0.137 to $ 0.162. The next zone starts at $ 0.199 to $ 0.261.
Let us pay attention to the CHOP indicator which shows that we have a lot of collected energy. and the MACD indicator which shows that despite the current decline we are in an uptrend.