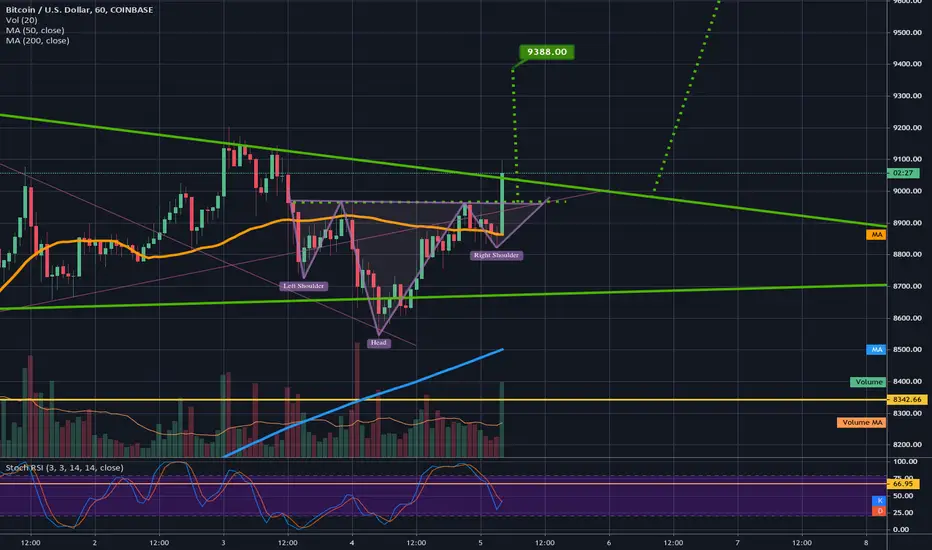
btcusd appears to be breaking up from 1hr inv head & shouldersif it confirms the initial target is 9374...which coudl be enough to trigger a breakout from the entire 1 day chart bull pennant which would then have a breakout target of 10.5k No full confirmation yet but probability is definitely favoring the breakout of at least the 1hr chart pattern
1hrchart
POST HS, go longhas formed and the hourly chart is clearly on an uptred, showing signs of recovery. quite afew shooting stars are forming so be careful

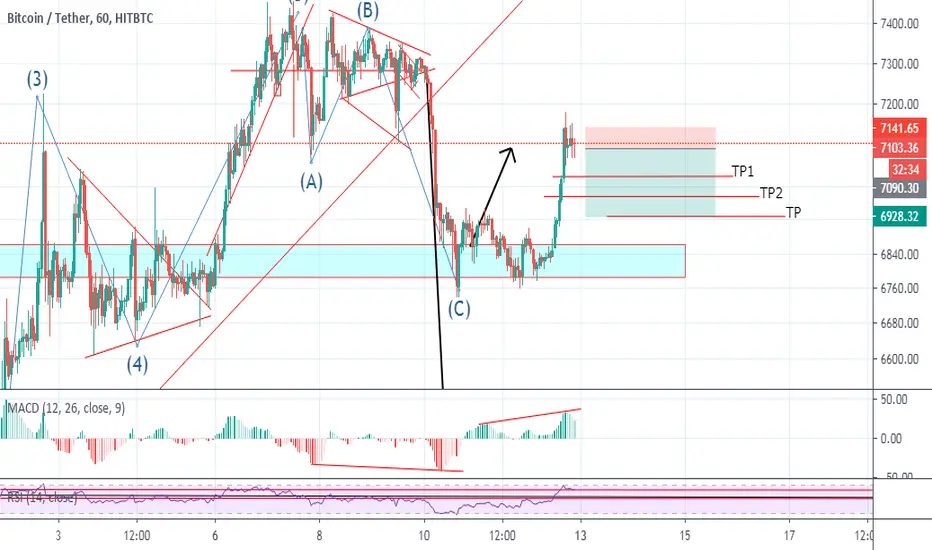
BTCUSDT/HITBTCBitcoin in 1 hour time frame seems to be correct
You can get ready for the position
It can be entered by observing the limit
Be healthy and successful
XRPUSDT/HITBTCThe second-class status of the cryptocurrency market shows this simulation in my opinion. We need to see how it will move in the coming hours.
Get rid of clutter in your short and long purchases
Successful and profitable

USDCHF 1 H setupwe can see that the price is moving in an uptrend channel. so we have decent opportunities to go long with the trend. however, we are waiting for the price to get rejected at 0.98600 for our short entry. trade at your own risk and happy trading.

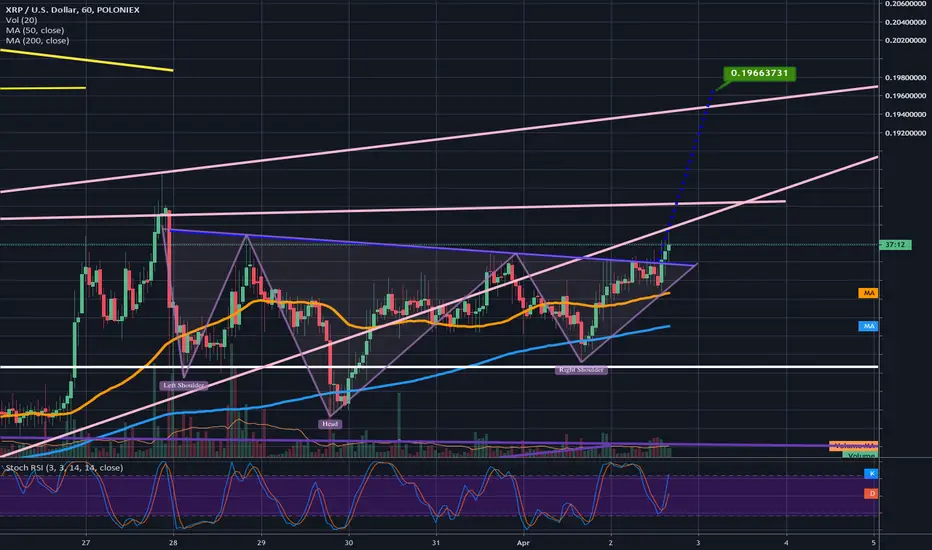
XRPUSD appears to be breaking up from 1hr chart inv h&salways wise to wait for bullish volume confirmation here but we can see the current 1hr candle retested the enckline and confirmed it as support...current resistance is the pink line directly above it if we can rise above that the inverse head and shoulders pattern will surely get validated. Initial target = 0.196 cents however should we reach that target odds are good that we will also trigger a breakout from the pink ascending triangle pattern on the 1 day chart which will inevffitably lead to more upside.
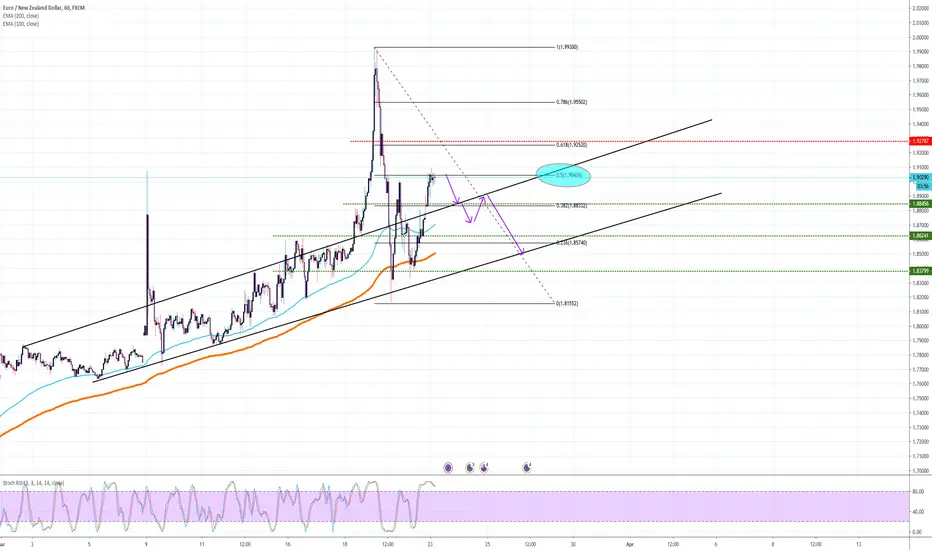
EurNzd updated 1h analysis EurNzd has continued to push up and is now looking like its rejecting the 50% fib level...Im gonna give it another try and place my sl just above the 61% fib.
USDJPY 1h chart...possible reversalUsdJpy has made a strong push up and is now losing momentum. It has failed to make a higher high and I strongly fell will reverse soon, it might go for another retest but I highly doubt it. (stay updated on the coronavirus and the cure that is being made in the US )

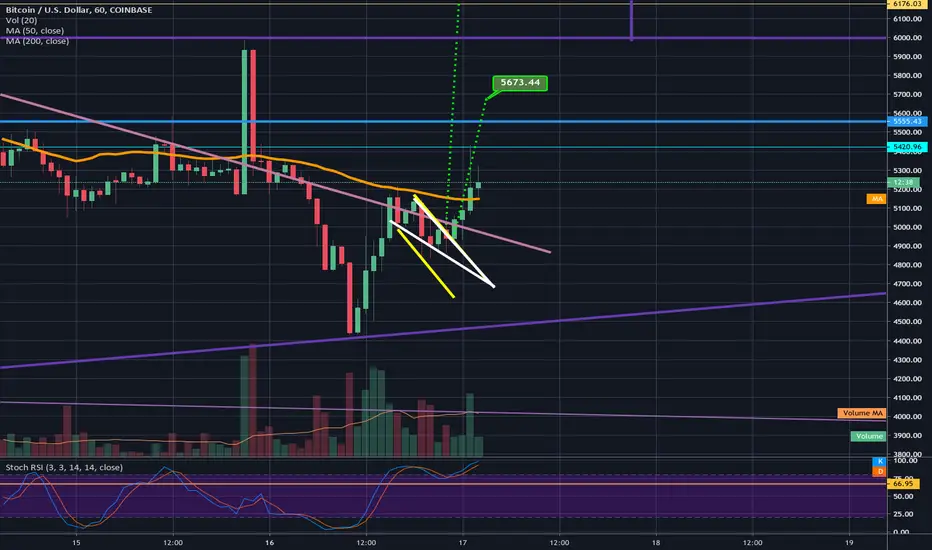
1hr bull flag breaking out; target=$5670We are also potentially forming a huge ascending triangle that could last until early April. Need to see more touches between now and then to be confident though.
Bullish ABCD - USDJPY - 1hr chart Daily is still bearish.
Will USDJPY hold its ABCD pattern in this counter-trend trade in the 1-hr chart?
We shall see
TP1: 107.29 (188pips)
TP2: 108.46 (305pips)
SL: 104.44 (-97pips)
Open position at: 105.41

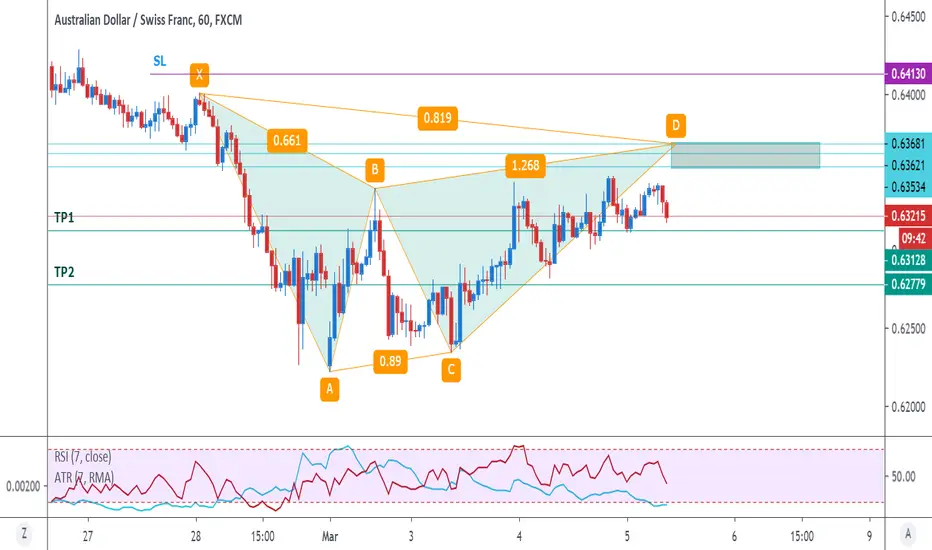
Bearish GARTLEY - AUDCHF - 1hr chartFinally a Gartley spotted - a bearish one in AUDCHF in the 1-hr chart
TP1: 0.6312 (56 pips)
TP2: 0.6277 (91pips)
SL: 0.6413 (-45pips)
Open position at: 0.6368
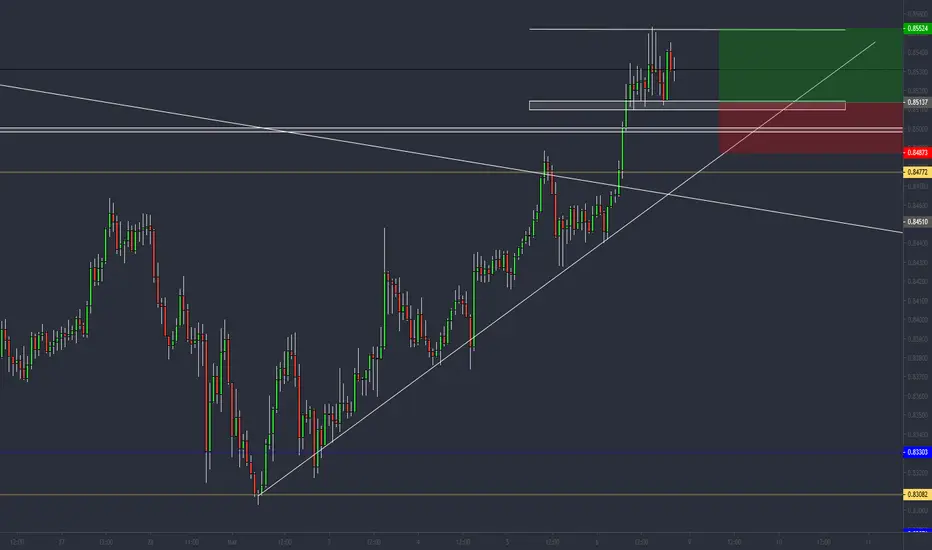
Bearish ABCD - AUDSGD (1 hr chart)Potential bearish ABCD spotted in this rare pair AUDSGD in the 1-hr chart
TP1: 0.9112 (83pips)
TP2: 0.9062 (133pips)
SL: 0.9238 (-43pips)
Open position at: 0.9195

A 1hr inverse head and shoulders to keep an eye on.Always await confirmation of a breakout or fakeout before taking a trading action.

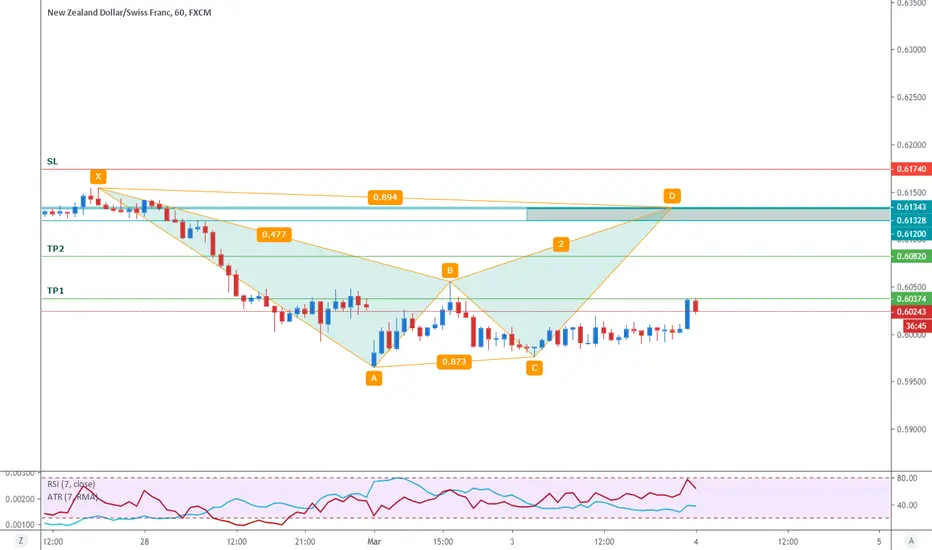
Bearish Bat - NZDCHF - 1hr chartPotential Bat spotted in NZDCHF in this 1-hr chart. Daily Trend is Bearish.
TP1: 0.6037 (97pips)
TP2: 0.6082 (52pips)
SL: 0.6174 (-40pips)
Expected completion before 4 Mar. Latest by 6 Mar.
Open position at: 0.6134
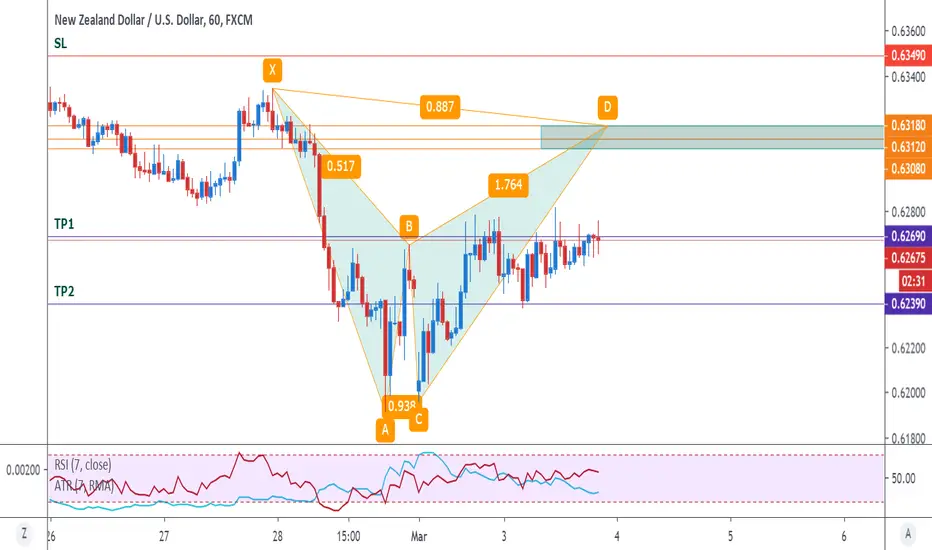
Bearish Bat - NZDUSD 1hr chartPotential bearish BAT setup in NZDUSD in 1-hr chart
TP1: 0.6269 (39 pips)
TP2: 0.6239 (69pips)
SL: 0.6349 (-41pips)
Open Position at: 0.6308
Expected completed before 4 Mar 2020, 2pm
Not a very profitable trade so will open smaller lots to gun for TP2.
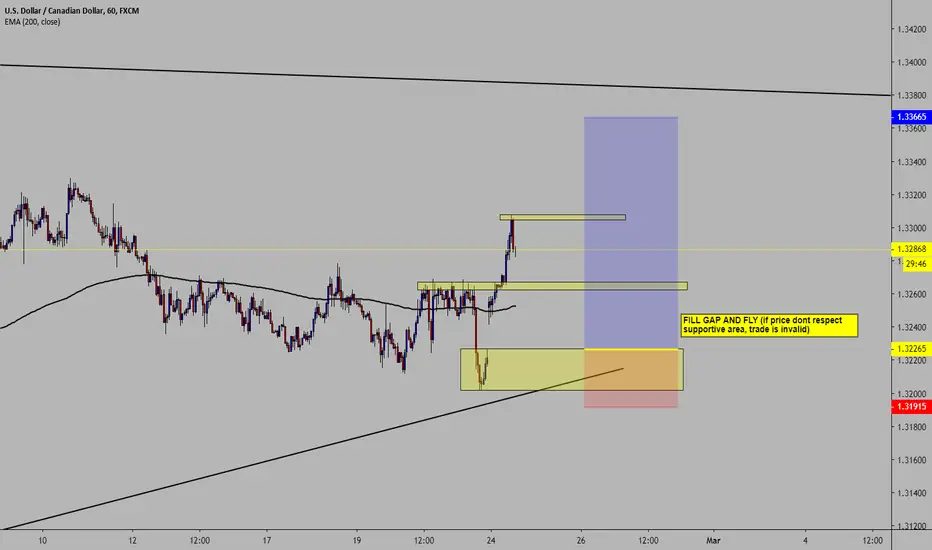
Bullish ABCD AUDCAD - 1-hr chartBullish ABCD AUDCAD spotted in 1-hr chart.
Price has hit TP1. Expect the price to drop in buy zone again to reach TP1 and TP2.
TP1: 0.8743 (55pips)
TP2: 0.8779 (91 pips)
SL : 0.8659 (-29 pips)
Set pending order on 2 Mar at 0.8688


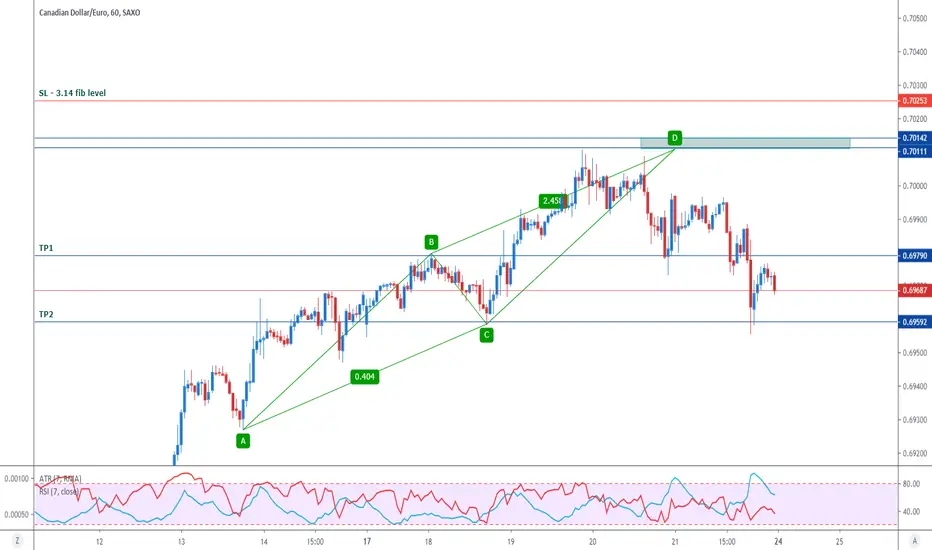
[FAILED] Bearish ABCD Pattern - CADEUR (1hr chart)Bearish ABCD pattern spotted in CADEURO in 1 hour chart
But it is a failed pattern as price didn't hit sell zone.
Ascending Triangle on 1 hour - breakout up, but not 10k+ yet$BTCUSD Is trending up and breaking through resistance recently, currently in a brief pause with $9,850 the local resistance. My best bet is a break above $9,850 only to be rejected by strong resistance at $10,000. From there I think we keep moving sideways with downside support at $9,400. Fear/Greed is slightly greedy, but not excessively so. I'm thinking it needs to knock on the door of $10k a few times before breaking through.
I'm not a trader, I just like to watch and hodl so this is mostly to test my instincts. Not advice, not an expert. Let me know if I am way off missing something.
Guess there is always a chance of someone pumping/dumping too.

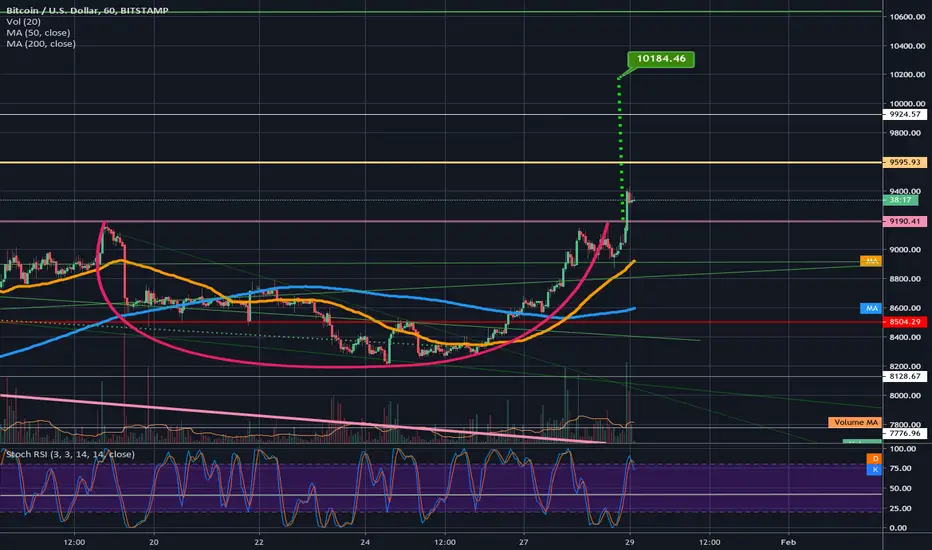
Double Top possibility eliminated Cup and Handle still in playThe double top possibility for the bears has been eliminated as Bitcoin has once against surged passed the double top zone into the 9300s. Leaving only the cup and handle left of the two options; a great sign for the bulls. of course we need to make sure that price action stays above the rimline(horizontal pink line) in order to trigger the cup and handle breakout...if we do trigger it however the target is just under 10200 which will have us well on our way towards the bigger falling wedges breakout target of 12k! The Cup and handle is a 1 hour chart pattern, the falling wedge with the 12k target is a 1 day chart pattern and speaking of the 1 day chart,. with this recent bullish surge the likelyhood of a 1 day golden cross sometime in february has increased exponentially meaning it is now very likely we will continue with the bull market . Of course any major massive crash in price could still change that but as of now its looking very very good...As far as this cup and handle pattern goes...I would definitely expect price action to come back down and try to retest the support of the rimline before finally triggering the breakout...but the way price action ahas been going the past few days it may just keep on continuing up with out the support retest.
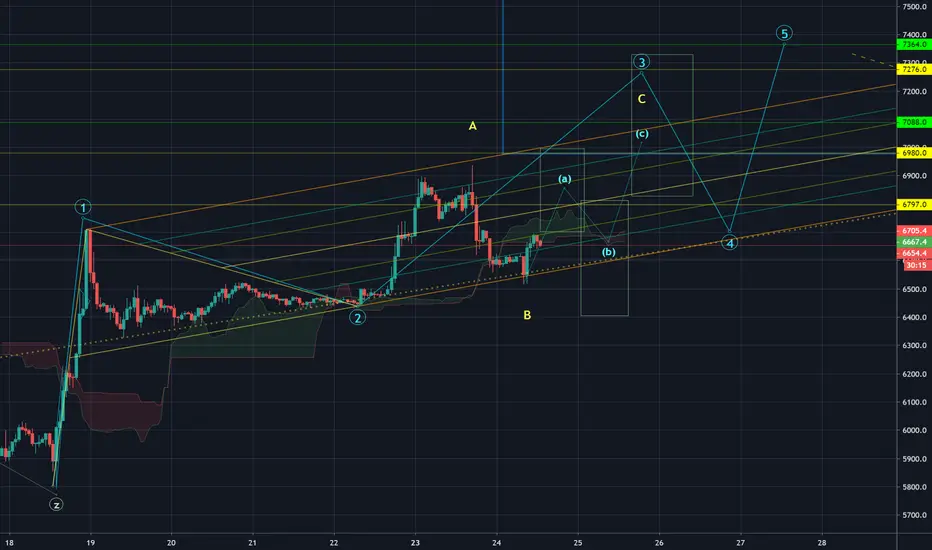
XBTEUR 1h chart: short term analysis 20121224Since we're in a big Flat correction, this final C wave of the big flat is a 5 wave up:
This analysis only about the 5 waves up.
Currently we're in wave C of wave 3 of the 5 waves up.
Wave 3 in itself is divided in sub (abc) waves.
The (abc) positions indicate the theoretical targets of each sub-wave. The rectangles indicate the maximum and minimum prices per sub wave.
However, no time analysis has been done. Thus do not consider the width of the rectangles nor the positioning in time of the waves.