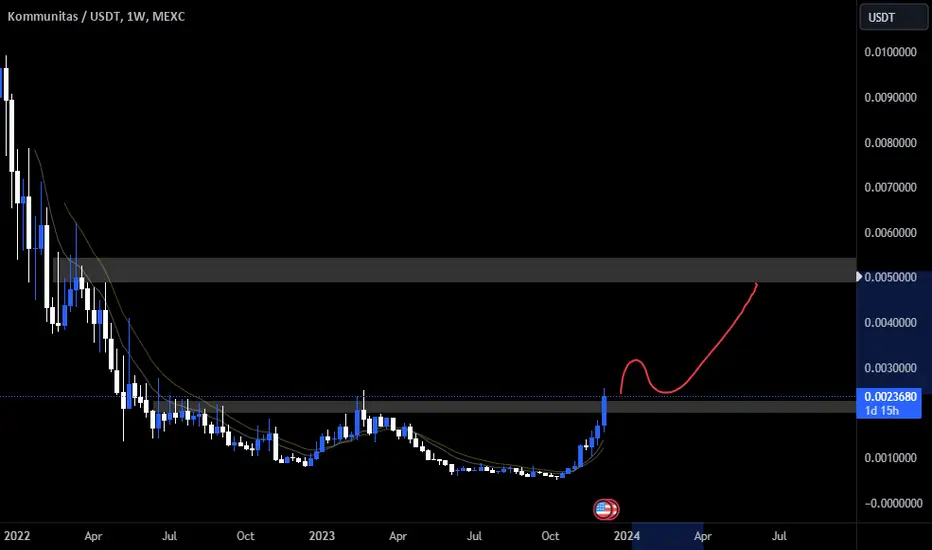
KOM USDT 1W TF for Analyze.
After breakout 1W Time frame, wait for retest. Bullish?
DYOR. Bullish IMO. What do you think?
1w
SasanSeifi 💁♂ theta / Price Consolidation in Weekly Time FrameHi everyone!
As you can see in the weekly time frame, after a downtrend, the price has been accompanied by positive fluctuations after ranging from the 0.56 price range. With the break of the downtrend line, it was able to grow to the 1.17 price range. Currently, it is trading in a range at the 1.023 price range.
We can consider a scenario in which the price continues to range and accumulate volume and then resumes positive fluctuations. If it consolidates above the 1.30 resistance range, we can see growth to the 1.70 liquidity range. In the case of growth, to better understand the continuation of the movement, we need to see how the price reacts to the target range.
The important support level in the weekly time frame is 0.56. Otherwise, if the price penetrates below the 0.56 LOW range and consolidates, the possibility of further correction can be considered.
🟢 Keep in mind, it's essential to perform your own analysis and take into account additional factors before making any trading choices. Best of luck! ✌️
❌ (DYOR)
Sure, if you have any more questions or need further clarification, feel free to ask. I'm here to help!
if you found my analysis helpful, I would appreciate it if you could show your support by liking and commenting. Thank you!🙌✌

SasanSeifi 💁♂ DOT ⏩ 5.50$ / 6$Hey there! In the weekly time frame, considering the break of the downtrend, the price managed to grow to the 4.80 range. In the medium term, the expectation is that the price will continue to grow towards the supply areas of 5.50 dollars/6 dollars. In case of growth, for a better understanding of the trend's continuation, observe how the price reacts to the resistance levels. The support range is at 4 dollars and 3.50 dollars. 📈💹🚀
🟢 Keep in mind that these are just scenarios, and it's important to conduct your own analysis and consider other factors before making any trading decisions 😊📈📉
❌ (DYOR)
⭕Of course, if you have any more inquiries or require further clarification, don't hesitate to reach out. I'm here to assist you!
🔹If you found this analysis helpful, please show your support by liking and commenting. Thank you! 🚀😊 🙌

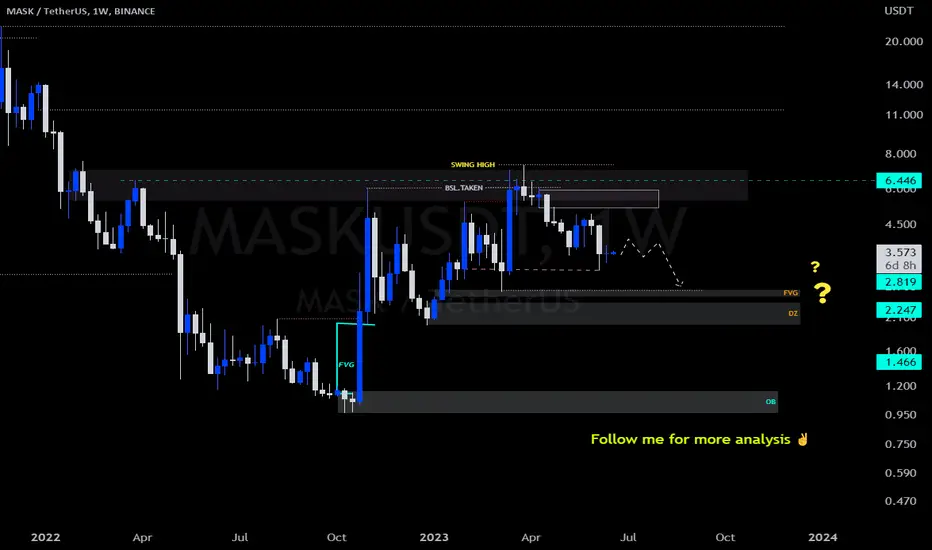
SasanSeifi 💁♂️MASK/USDT 👉1W🔻 LONGTERMHey there!
When we take a look at the weekly timeframe, we can see that the price has taken a dip from the $4.80 range and has now reached the $3 support level due to some selling pressure. At the moment, it's trading within the range of $3.56, showing a period of consolidation with a positive response to the support level. Looking ahead, there's a possibility of further price correction in the long term.
Let's explore a scenario in the weekly timeframe: The price could Potentially continue correcting toward the price targets of $2.80 and the Fair Value Gap (FVG) range of $2.60, accompanied by price fluctuations. By Keeping an eye on the support levels and observing positive price movements on lower timeframes, we'll gain better insights into The continuation of the price trend.
To better understand how the price will move in the future, it's important to pay attention to how it reacts to the support levels. On the other hand, if the price breaks below the significant support level of $2.60 and remains stable below it, we might see a further price correction. Just remember that the key resistance levels in the weekly Timeframe are $4.20 and $5.
If you have any more questions or need further clarification, please feel free to ask.
❎ (DYOR)...⚠️⚜️
If you like my analysis, please Like and comment.🙏✌️
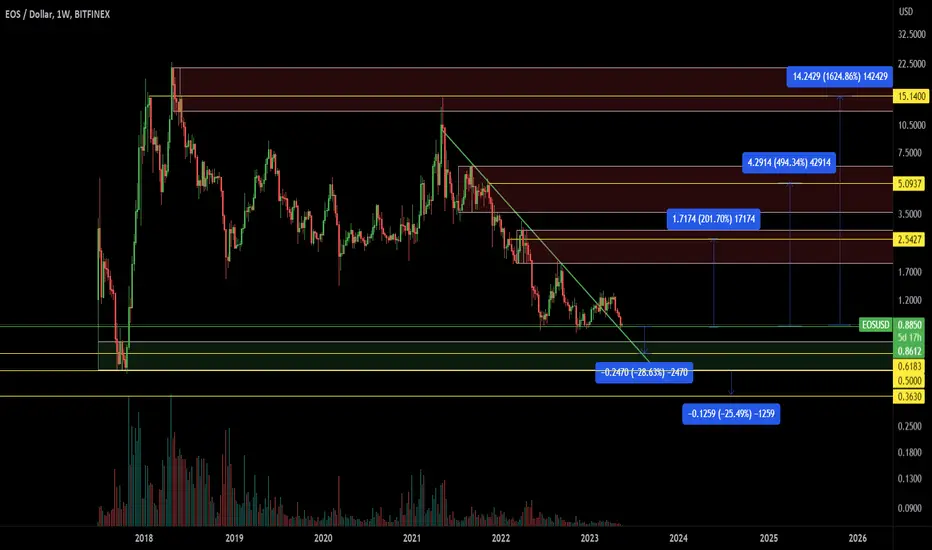
EOS/USD 1W. Basic trend. Potentials and manipulations.Here's the EOS/USD 1W Chart on Bitfinex(long history).
Right now we can see the horizontal channel forming. In this channel harmonic pattern on daily TF formed and worked out the first target, which is the middle of this local horizontal accumulation channel, in terms of 1w TF.
Now we're near the support of this channel 0.86$. Recently the big amount of EOS were deposited on the exchanges.
Showed the classical potential manipulation - look.
On the bottom we have the support zone. Also it's 0/61(16)$ zone which often acts as bottom.
This 0.61$ zone is -25% from the current support which is basic percent for pulling out stop losses.
Though, if the market gives an "opportunity" it can dump further. The global support is 0.5$. This is also a possibility.
And if on the moment it's very scary - the price can drop up to 0.36, which is also -25% but from the main support 0.5$. It will be 0.36 $ zone.
Still, the potential is very good. Shown the potential distribution(local distribution) zone on chart.
Those are - 2.5$; 5$ and then maybe 15$ but probably not in this local cycle.
You can potentially work martingale in this type of situation, which means buy more if price drops.
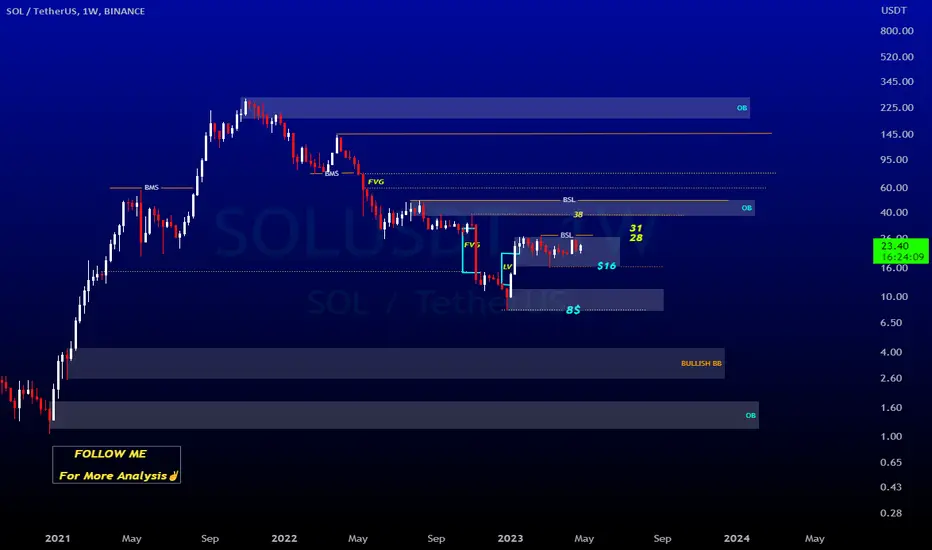
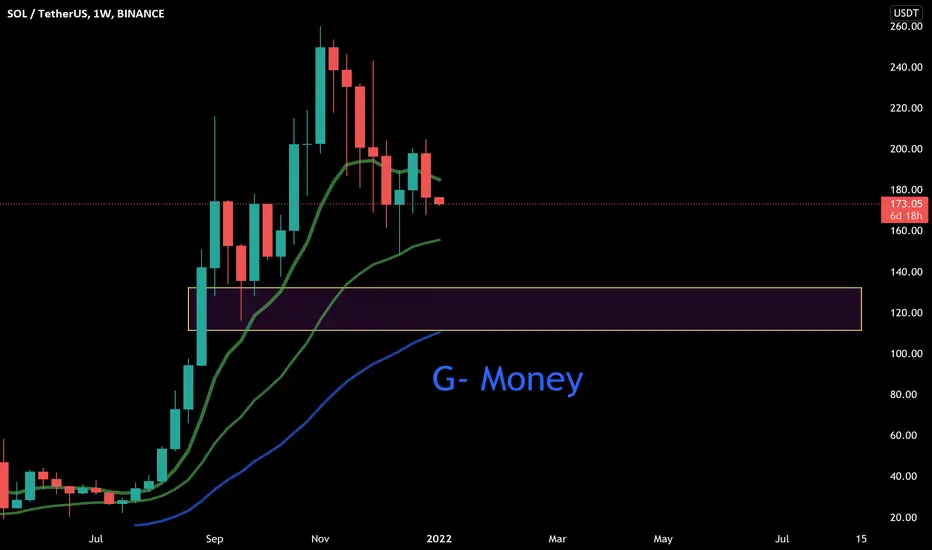
SasanSeifi 💁♂️SOLUSDT /1W Hello everyone ✌
In the weekly time frame, as you can see, the long-term price trend from the 8$ range faced buying pressure and was able to grow to the 27$ range.
Currently, after a slight correction of the price from the lv range of 16 dollars, it has a positive reaction and is in the range of 23 dollars.
the price is fluctuating in the long-term range of the specified box.
The scenario that we can consider in the long term is that if the price penetrates and stabilizes above the range of 27$, the possibility of price growth up to the range of 33/31 and the OB range of 38$ can be considered.
We have to see how the price will react.Note that it is important to maintain the 16$ range in the long term If the price breaks below the 16$ range, we may see further corrections.❗❗❗❗
❎ (DYOR)...⚠⚜
What do you think about this analysis? I will be glad to know your idea 🙂✌
IF you like my analysis please LIKE and comment 🙏✌
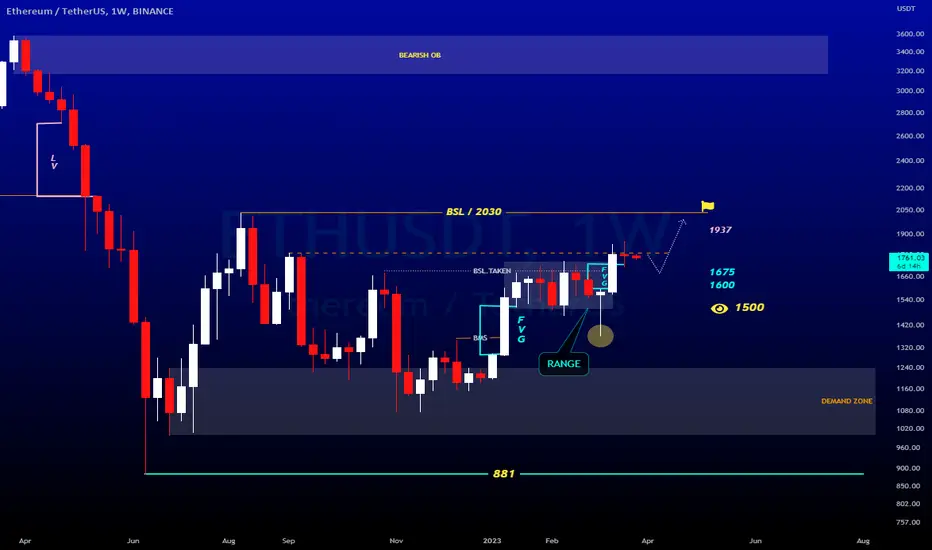
SasanSeifi 💁♂️ETH USDT 1W 1937? 2037? let's see..! HI Everyone✌As you can see, by examining #ETH The price faced buying pressure from the 1200 range and was able to grow up to the 1740 range, and after the price fluctuation, it corrected to the FVG range and by filling the FVG range, it grew again from the $1370 range.
It is currently trading in the range of 1759.
Scenarios that we can expect in the weekly long-term time frame. The possibility of price growth after VOLUME collection from the range of 1700. Otherwise, according to the created FVG, the price may grow again by filling the FVG from the range of $1675 and $1600.
WE have to see how the price will react to the specified support ranges.
Targets are in the range of $1937 and $2030.
Keep in mind that if the weekly time frame candle closes below the $1500 range, we may see further corrections.
❎ (DYOR)...⚠⚜
WHAT DO YOU THINK ABOUT THIS ANALYSIS? I will be glad to know your idea 🙂✌
IF you like my analysis please LIKE and comment 🙏✌
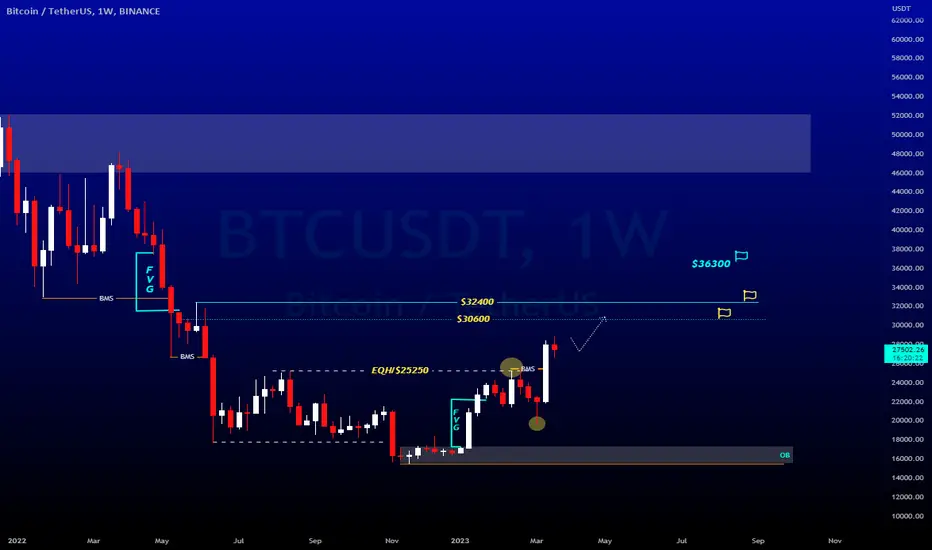
SasanSeifi 💁♂️BTC/1W ⏭ $30.000 / $32.000⬆HI Everyone✌As you can see, after being rejected from the important $24250 range, BTC faced buying pressure by filling the FVG range and was able to grow to the $29000 range.
Currently, the price is trading in the range of $27500. Considering the failure of the important resistance of $25,250, we can expect the price in the long-term time frame, after a slight correction from the range of $25,300 / $24,600 / $22,900, to continue to grow up to the desired targets of $30,600 / $32,400.We have to see how the price will react to the support ranges. Otherwise,If the price penetrates below the $22,900 range, the possibility of further correction can be considered.
Keep in mind that for the $36,300 target, it is important to stabilize above the $32,000 range.
❎ (DYOR)...⚠⚜
WHAT DO YOU THINK ABOUT THIS ANALYSIS? I will be glad to know your idea 🙂✌
IF you like my analysis please LIKE and comment 🙏✌
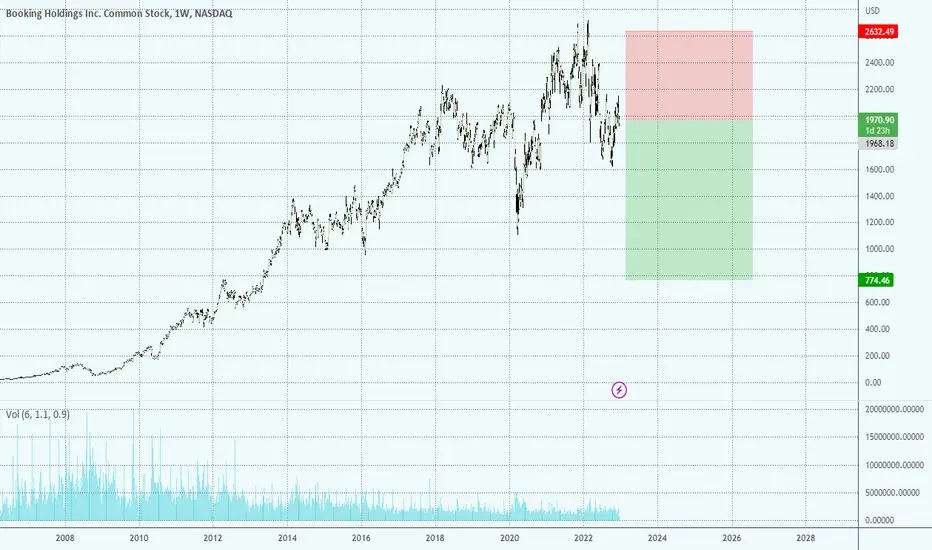
BKNG Recession comingEconomic bubble is about to explode around the world, first signals are already here, it's a good time to close your operation and go short to the market
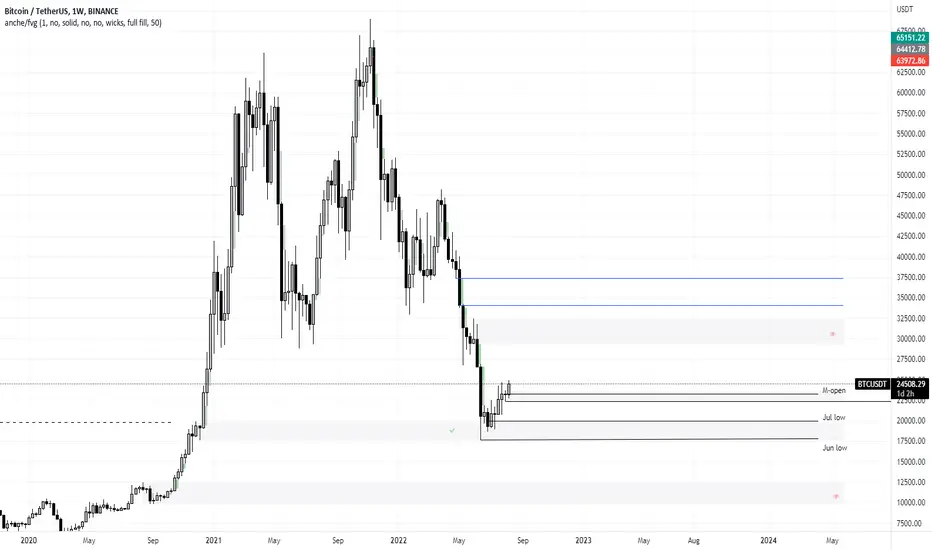
BTC 1W With the available information from chart, I would stay bullish as long as the price trades above monthly low. Would consider swipe but not more then that for now.
Ideally want to see monthly open test and further move upwards to 27k & 30k areas where I might consider some short positions.
In case we fail to reach above areas and the price will get below monthly low(except of swipe) I might looking for short positions straight away and the first target gonna be June Low.
ERJ reverse ?i jsut noticed on ERJ on 1W timeframe H&S theres a possibility of big reverse on ERJ jsut my own thought you can ignore it if you want to CAPITALCOM:ERJ

Sol -1W - Jan / 2022 OverviewHappy New to All !
We are going for a quick look to the charts just to get a bigger picture.
Share You thoughts, likes and TA!
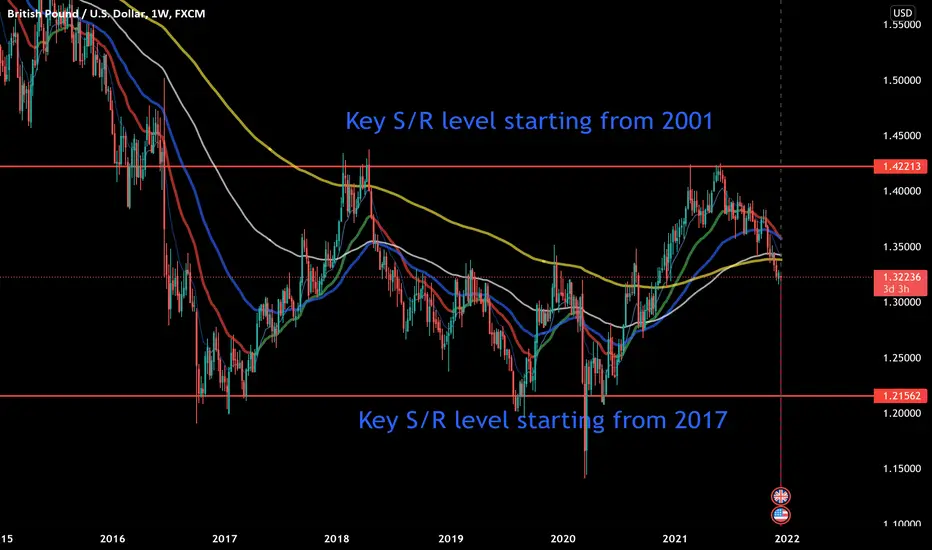
GBP-USD Deep TA - Part 1/4 - 1WGBP USD TA part 1 from the 4 parts. Overview of 1W chart and establishing key S/R levels. Also , we are stepping back a few steps and overviewing whole trend picture and direction . We’ve got general picture over here and we are heading to the part 2 - 1D charts for the further TA.
Can you see bouncing back from the key S/R levels? In the past same levels played as key levels for reverse of trend .Share your TA and thoughts as well please!
Deep dive for a Gold on the 1W chartsIf you had a look in the previous 1M Gold chart, you still do remember about sell possibility. Like as you see 25,25,50 EMAs taken down already. You can observe some hesitation on 100EMA and most likely after hesistation going to head for the 200EMA.
It is just main observations only and I would like to hear yours opinion and/or TA as well.
Right know we a heading for 1D charts to look closer for “our” GOLD!

Bitcoin ascending triangle 1WCan we entertain that BTC could be potentially be in a huge ascending triangle, the recent dump bounced perfectly off this level and could be a very valid pattern, I’d like to see another touchpoint on the upside before this is confirmed but when this breaks it is going to be massive.

BTC/USDT - 1W - Time to Bounce? Hoping BTC bounces here - price already tapping the blue 21W EMA and also retracing to the 0.382 fib extension.
First green CPR (R1) meets the 100% fib extension. Good TP zone.
Second green CPR (R2) crosses a long term white trend line. Good TP zone.
Third green CPR (R3) taps the 1.618 fib extension. Good TP zone.
Should price break down below the green trend line, look for the 50 EMA (green) and even 100 EMA (yellow) for DCA options.
Come on the Bitcoin.

Tesla Will CrashI think Tesla is overbought and the signals are pretty clear, I predict a retracement of 40-50% in the next weeks.

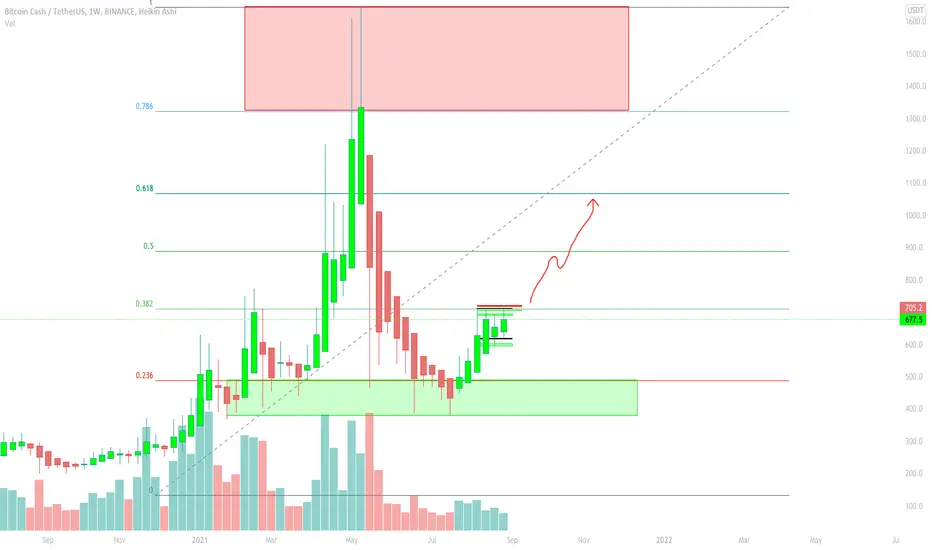
BCH/USDT 1WAs you can see on the Weekly chart, Bitcoin Cash still has a lot of options in the long run and I definitely recommend adding to the HODL portfolio, as well as Litecoin, which has not yet reached its ATH.
Bitcoin Cash is currently below the Fibonacci retracement of 0.382 and on the resistance wall, if we break through and confirm there will be a BULLISH movement up to the area of 0.5 or 0.618.
MACD and RSI normal for growth
Long-term analysis 1W
Target: 720
Short-term: 801
Mid-term: 885.3
Long-term: 1062.1
STOP: 600
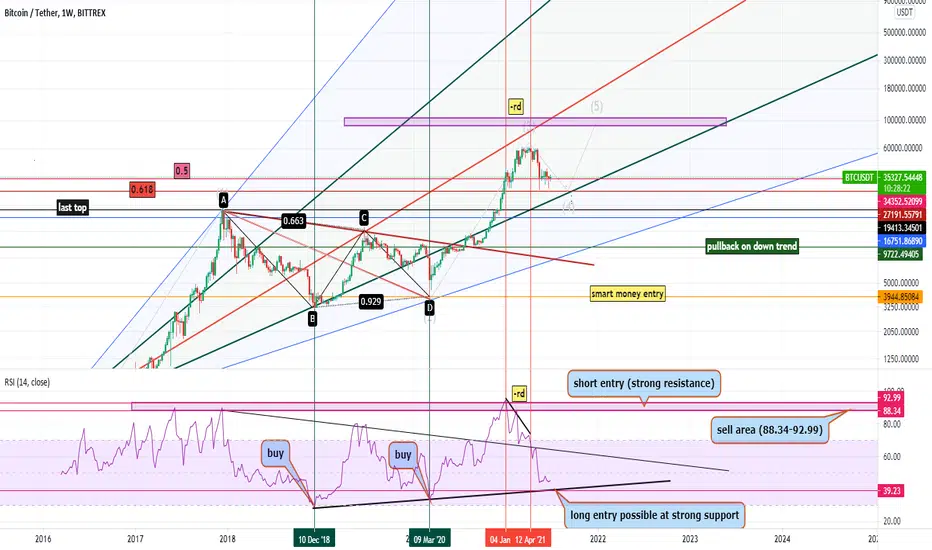
BTCUSDT/1WIn weekly chart you can see what's happened for price.
price is very close to strong support zone (it's possible to see more drop for price) and I don't think we're going to see last top again ( last price ), So I think best time for long entry is on strong support line but you must be aware that to take stop loss under this zone .
It seems that we are at 4th wave of impulse wave (4th wave never kiss the 1st wave of impulse).
According to weekly chart holders and gainers are the final winners of future.
BTC Must hold 3 month long bottom on weekly. We are all hoping that today was the bottom. But $BTC still must hold above this weekly trend line at the end of today (Sunday) and hopefully going forward.
Good luck and trade safe.
Not Financial advice.

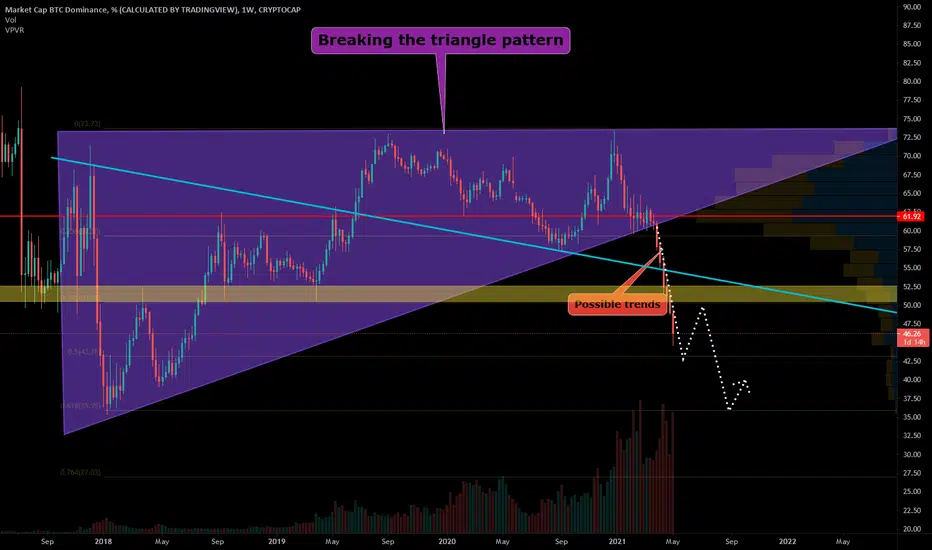
BTC.DBitcoin investment has plummeted
The volume of bitcoin is one of the most influential factors in the digital currency market.
Now the trend of investment volume on bitcoin has broken the border of the greatest investment pressure and triangles and even the line of its previous trend.
Now we expect Altcoins to be affected by this and experience a growing trend.
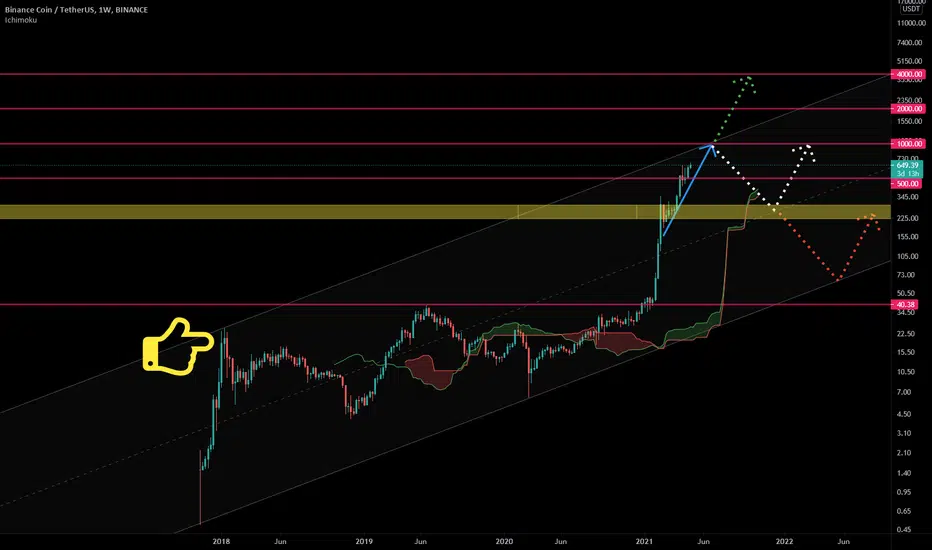
BNBUSDTThe next step is currency BNB
According to the path that he has taken during his life and as can be seen in the chart, BNB currency has formed an ascending channel.
We are now at a time when it is after a great growth and due to the unpredictable behaviors of the market, we can not say exactly what will happen in the future, but according to the factors affecting the technical analysis, we can get closer to the truth. Guess what.
Probabilities;
First - The breaking of the channel ceiling and the flight of the price of the popular Bainance currency, which, of course, some experts have predicted.
Second - repeat the date and copy the trend pattern in January 2018
Third - the collapse of the digital currency market, which of course is very, very unlikely to happen.
44K next week if the actual 61K break out failsProbably this is the moment where BTC will revert the monthly bullish tendency and give us a reverse of tendency. I think that exists a probability to go back to 44K the next week (probably in the half of the week) and check again if the tendency will be bullish or back to a bearish trend.
