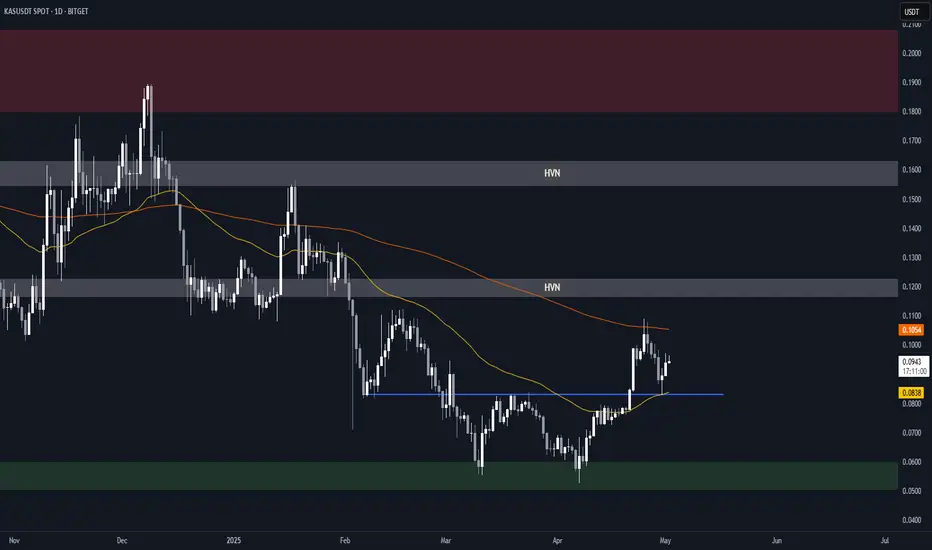
KASPA Structure Analysis – Downtrend BreakoutAfter retesting the $0.05 demand zone (previous resistance dating back to August 2023), BITGET:KASUSDT reclaimed the 50-day EMA (yellow) and tested the 200-day EMA (orange), before a brief pullback with the 50-day EMA acting as support.
Key Levels
• $0.050-$0.060: Main demand zone
• $0.083: Current support, reinforced by 50-day EMA
• $0.105: Current resistance, reinforced by 200-day EMA
• ~$0.120: HVN and potential resistance
• $0.155-$0.160: HVN, previous S/R and potential resistance
• $0.180-$0.200: Main supply zone
Here's a weekly chart with volume profiles for more context:
Considerations
• The breakout from the recent downtrend, and the break above the 50-day EMA followed by a retest as support, is a good sign for the bulls.
• If the 200-day EMA is successfully reclaimed, it could offer a good shot at retesting the main supply zone in the $0.180-$0.200 area.
• Conversely, a sustained break back below the 50-day EMA could lead to another test of the $0.050-$0.060 main demand zone.
Neutral outlook until a break above 200-day EMA or below 50-day EMA.
200-DAY
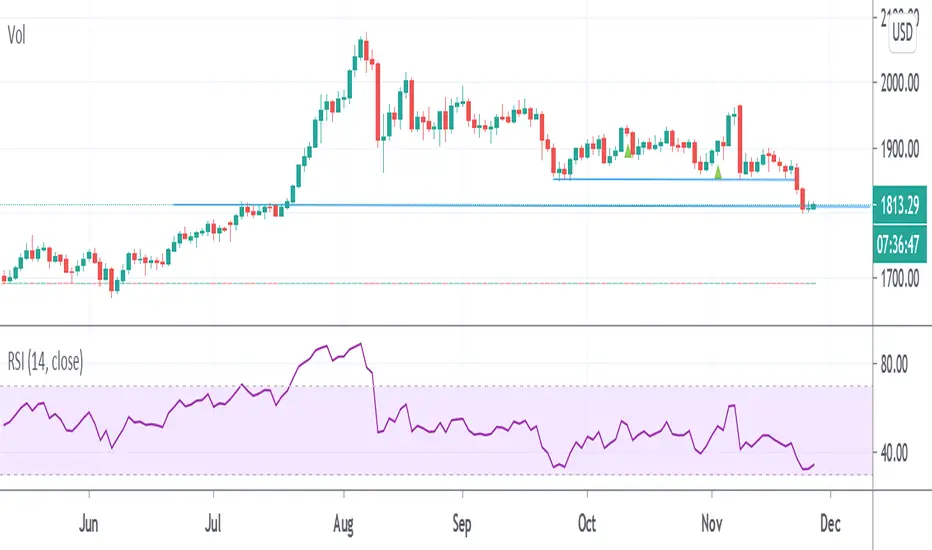
Bitcoin 200-day EMA Rejection ShortPlay on rejection of 200-day EMA after bulls fail to break the downtrend with tight stop loss.
Entry: 41,000
Stop Loss: 44,000
Target Price #1: 35,000
Target Price #2: 30,000
Target Price #3: 25,000
At each price target move stop loss to 10% over target value.
Reasoning:
First dip below 200-day EMA of the bull run. Sharp rejection possible.
Potential government intervention in US and China.
High volume selling along with increased volatility.
Risks:
Celebrity pumps can trigger tight stop losses on shorts.
Rapid bounce after first drop indicates strong buying power ready to deploy.
Bullish L2 news could cause rapid trend reversal to highs.

GOLD200 DAY MOVING AVERAGE HAS BEEN THE KEY FOR GOLD FOR A LONG TIME. WE HAVE REACHED THAT AREA TO BUY BY DECEMBER 15 IT WILL HAVE ALREADY STARTED THE MOVE UPWARDS
S&P expanded flat & 200 day moving averageAny Elliott Wave people out there want to take a look at this expanded flat pattern, as we approach the 200-day moving average around 3000 on the S&P 500. Major bear market top resistance. What do you think is going to happen? Could be a dramatic overnight trading session and big important day tomorrow. To see if we stay in the bear market area, or cross over into a bull market.

KNOWN CRYPTO CAVE 50 DAY 200 DAY TEST TEST KNOWN CRYPTO CAVE 50 DAY 200 DAY TEST TEST
Just checking to see if this works, haven't don this much before :)

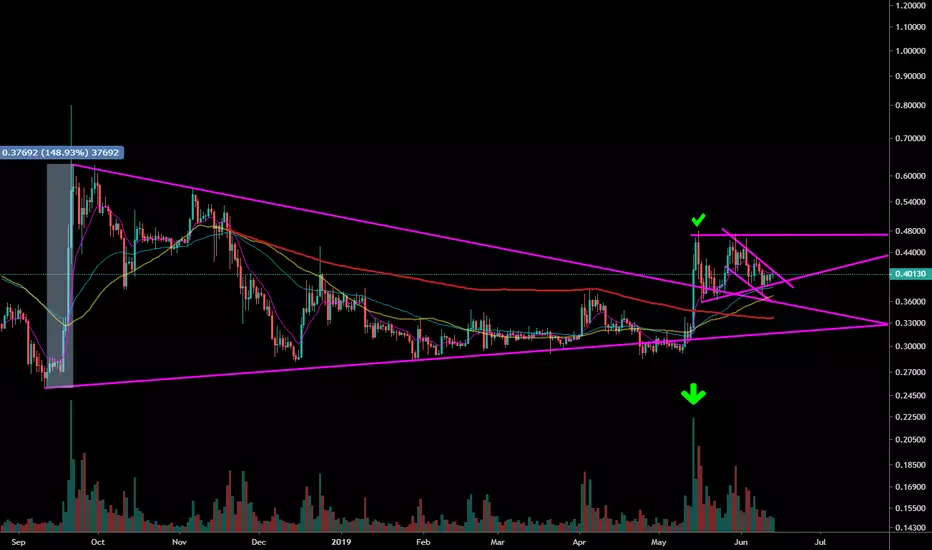
#XRPUSDT Up or Down From Here?- Bullish break of the 200 DAY MA on great volume.
- Currently consolidating nicely above cluster of daily candle closes back in Dec. '18 and April '19
- Possible Bull Flag Formation short to -mid term and ascending triangle pattern.
- Still possibility to Retest 200 Day MA confirm as support if BTC Dumps