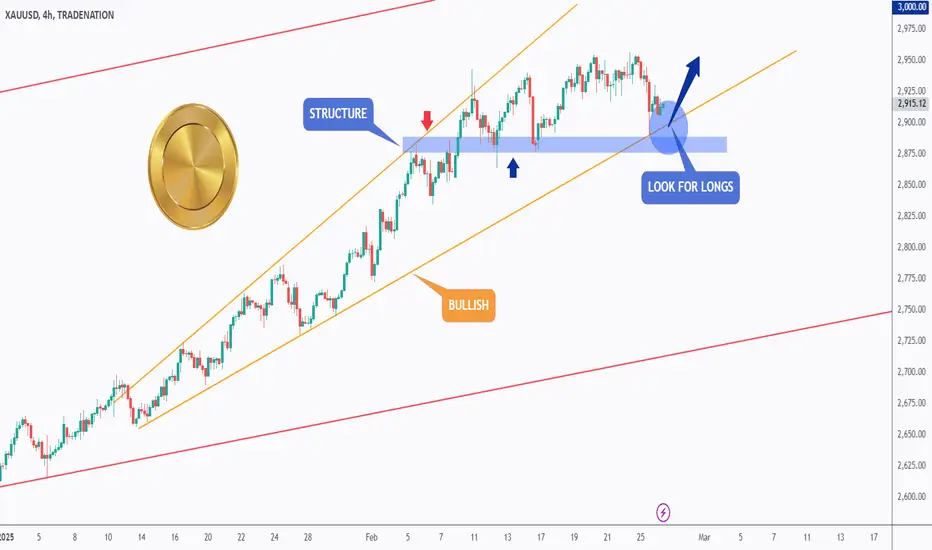
GOLD - Still Bullish Indeed!Hello TradingView Family / Fellow Traders. This is Richard, also known as theSignalyst.
📈XAUUSD has been overall bullish, trading within the rising wedge marked in orange.
Moreover, the blue zone is a strong structure and support.
🏹 Thus, the highlighted blue circle is a strong area to look for buy setups as it is the intersection of structure and lower blue trendline acting as a non-horizontal support.
📚 As per my trading style:
As #GOLD is around the the blue circle zone, I will be looking for bullish reversal setups (like a double bottom pattern, trendline break , and so on...)
If the blue zone is broken downward, a deeper bearish movement towards the $2,775 demand zone would be expected.
📚 Always follow your trading plan regarding entry, risk management, and trade management.
Good luck!
All Strategies Are Good; If Managed Properly!
~Rich
Disclosure: I am part of Trade Nation's Influencer program and receive a monthly fee for using their TradingView charts in my analysis.
2025
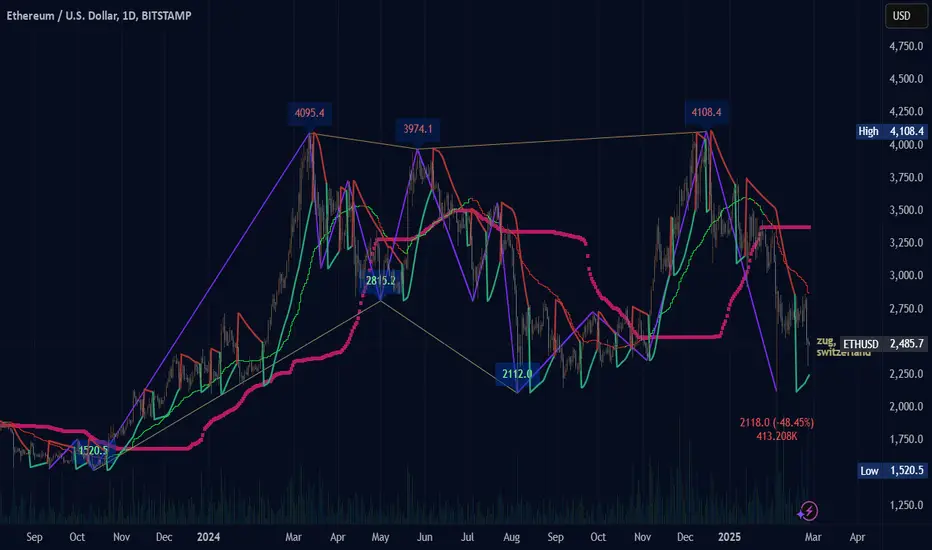
(ETH) ethereumWhen can we expect to see reports on the new concepts about Ethereum in the future?
Buying mode, price of Ethereum well under the dotted line. Ethereum has not had a strong position for some time and is likely to find profits. One large drop in price does not usually follow another than another than another and especially not with such large volume and capital. Am I in control of the flow, no. Do I have billions to make heavy movements, no. Am I interested in the progress of Ethereum despite holding little to no value in Ethereum, yes.
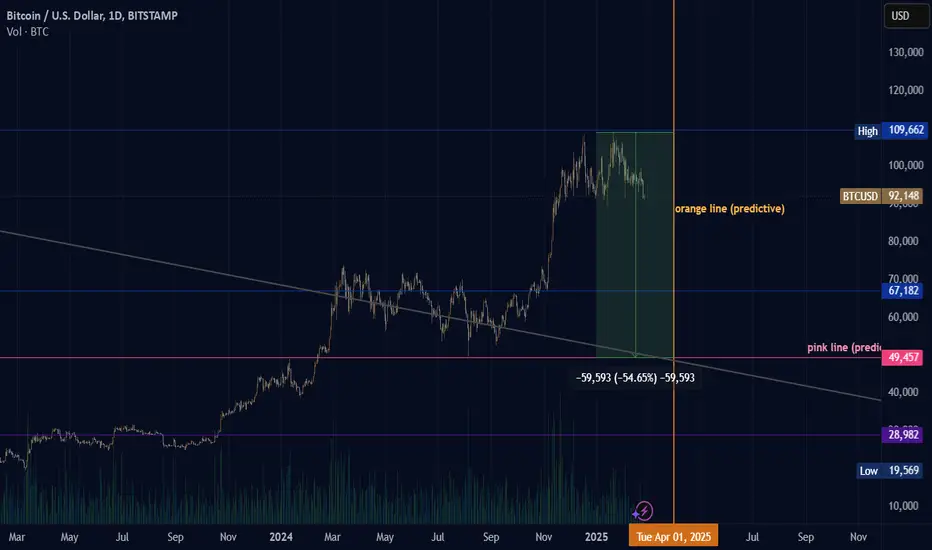
(BTC) bitcoin - updatepreviously, an image with the same template was shared showing a predictive point of view for the price of BTC. Now I am sharing the same template with the current price to compare how the price has changed since first posting using the same graph information.
Solana (SOL/USDT) Showing Bearish Signs – Further Downside 1DSolana (SOL) is currently displaying bearish price action on the charts. After failing to hold key support levels, the price has started trending downward, signaling potential further downside.
Large market participants appear to be interested in accumulating Solana at lower price levels. Current price action suggests that smart money is patiently waiting for a deeper pullback before stepping in with significant buy orders.
Potentially interesting entry points for Solana could be approaching very soon. With the current bearish price action, the market may offer attractive opportunities for buyers looking to enter at discounted levels.

Polkadot (DOT/USDT) - Key Levels To Watch Polkadot (DOT) is showing interesting price action, and traders should keep an eye on key levels for potential opportunities.

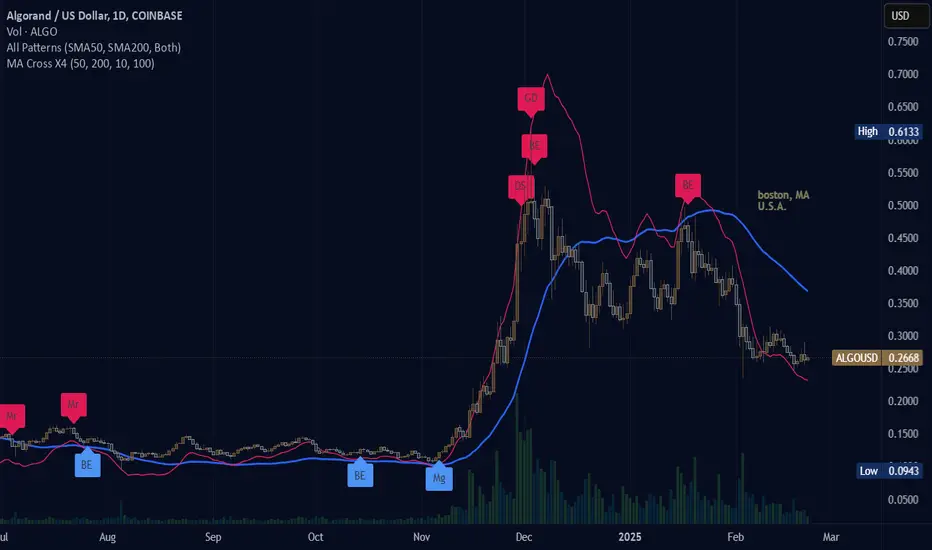
(ALGO) ALGORAND "gravestone doji"At the peak of price of Algorand the chart pattern formed a gravestone doji candle before depleting and falling into the reckoning wave of losses along with most other cryptourrency.
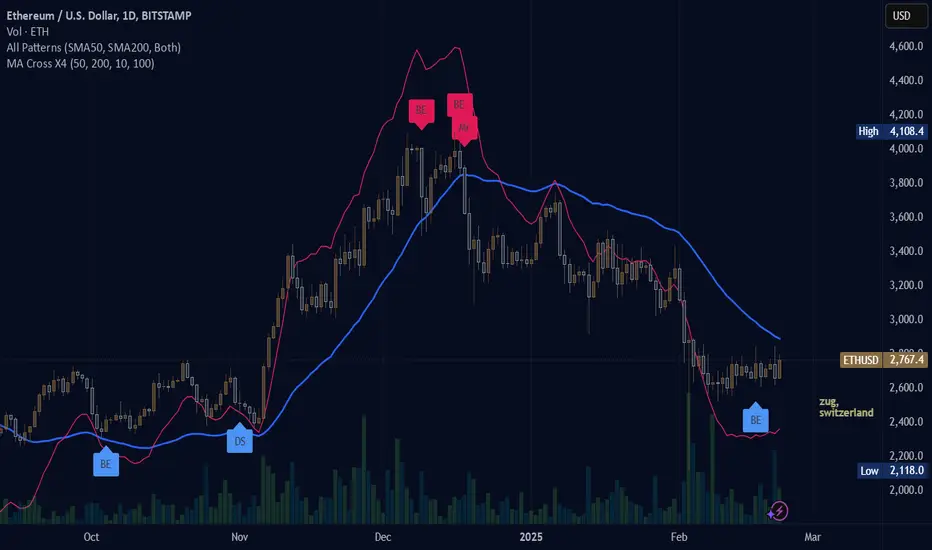
(ETH) ethereum "BE"bearish engulfing trend candle. potential reversal. chart view. There is too much optimism when losing occurs and too much negative when winning happens, with cryptocurrency.
candles shown marubozu red, doji star, bearish engulfing (blue)/bullish engulfing (red)
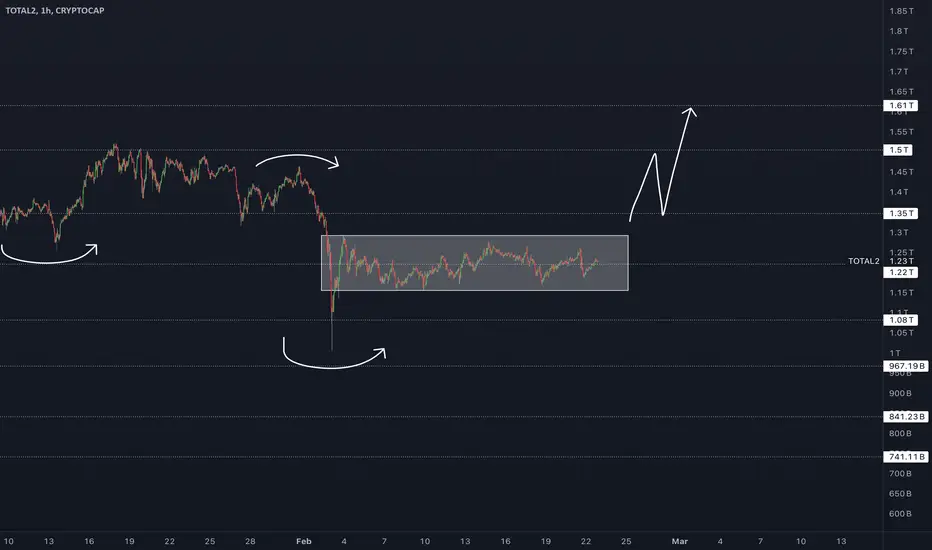
Total2 Bullish Setup: Potential Altcoin Breakout IncomingThe Total2 chart, representing the total market cap of all cryptocurrencies excluding Bitcoin, is showing strong bullish signs, suggesting a potential altcoin breakout.
Should watch for confirmation signals such as increased volume, BTC dominance trends, and key breakout levels to position for potential high-reward altcoin opportunities.
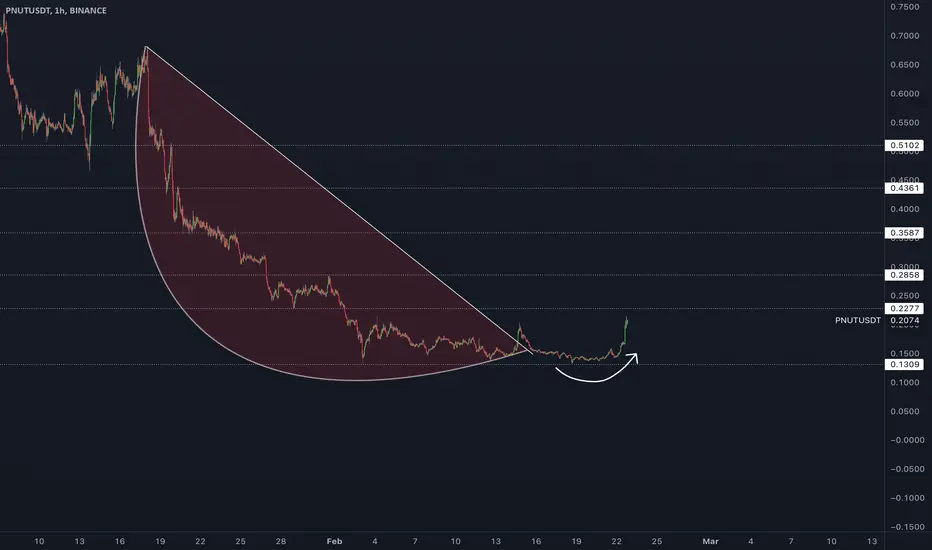
Peanut the Squirrel (PNUT/USDT) - Bullish Setup 1HPNUT is showing strong bullish signals on the 1H chart. Several technical factors suggest a potential upward move:
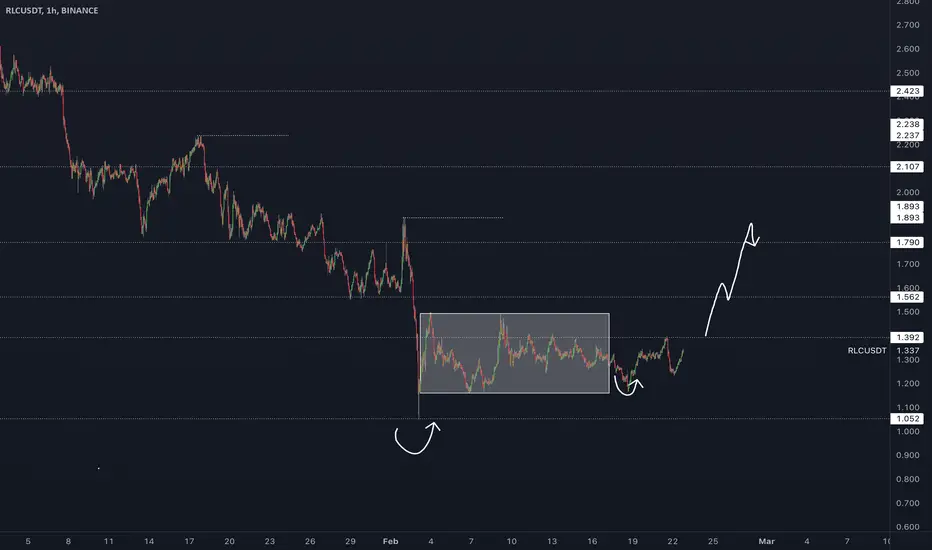
iExec RLC (RLC/USDT) - Key Levels To Watch 1HRLC is showing strong bullish momentum, currently trading around $1.34, with a potential breakout on the horizon.
A breakout above resistance with strong volume could lead to an explosive move!
Keep an eye on price action and confirmation signals.
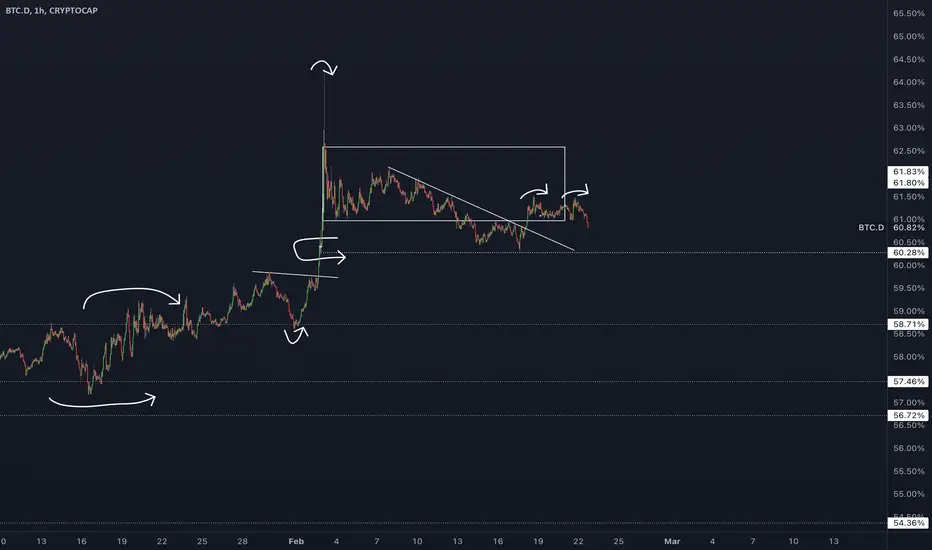
Bitcoin Dominance Likely to Drop – Key Levels to WatchBitcoin dominance is showing signs of weakness and may be heading for a drop. The dominance chart suggests a potential reversal as key resistance levels are being tested and rejected.
Should monitor price action closely. If BTC.D falls further, altcoins might experience a strong relief rally. Stay prepared!
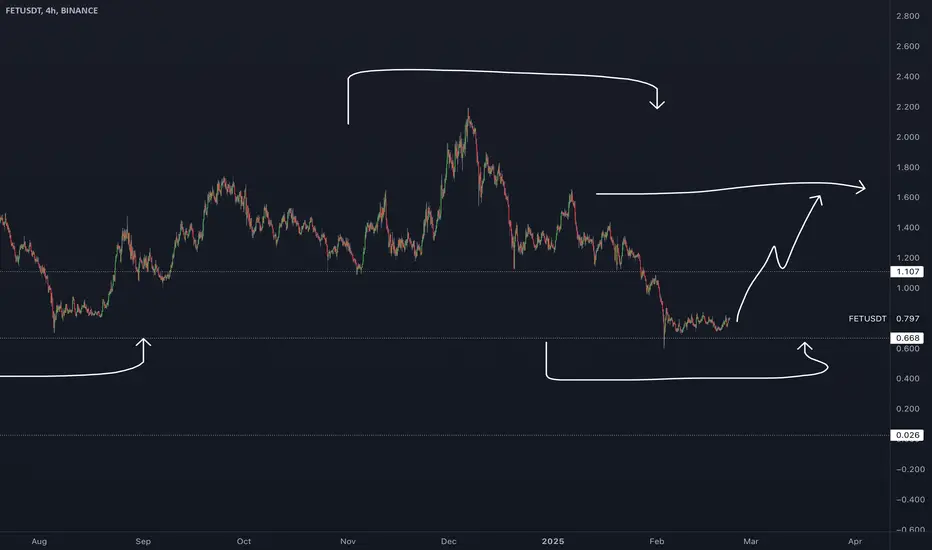
Fetch.AI (Fetch.AI/USDT) Bullish Setup Analysis 4HFetch.AI is showing strong bullish momentum with a breakout above key resistance levels.
(BTC) bitcoinan indicator to show the price of BTC is beginning a new phase based on whatever I did with this indicator. .dev
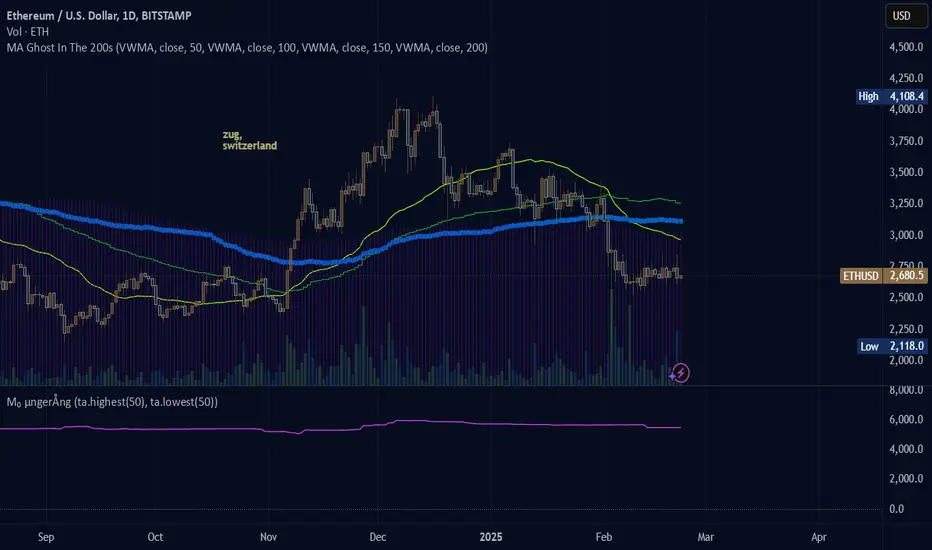
(ETH) ethereum "buying"When the price is hidden behind the purple curtain this is a sign of a buying moment, for consistent cryptocurrency, not so accurate with minor crypto tokens. As you can see the price of ethereum is behind the curtain of the 200 day moving average. Buying?
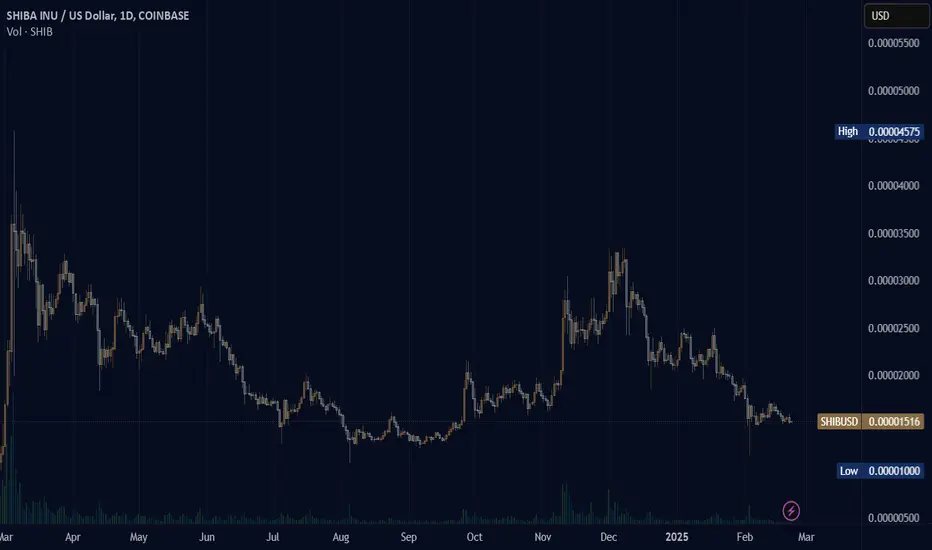
(SHIB) shiba inuThere is no cup and handle coming. The activity online by community programmer Kusama and other people seem to have led to a disgracing of the SHIB token and all that has happened is losing. Too much talk, not enough action. Silence is golden inu. There is still hope for Shiba Inu on the likes the acceptance of Shiba came far before many other meme tokens. Right now the Solana craze is being phased out in favor of Base chain memes. Base seems to be countering the popularity of Ethereum. Shiba Inu on Ethereum is not seen as trending the same way Solana memes and now Base memes are trending.
(SOL) solana "big gulp"The price of Solana is looking like it is going to go into a big gulp phase with a potential for a bottom (buying zone) and a recovery (ramp up) out of the big gulp moment.

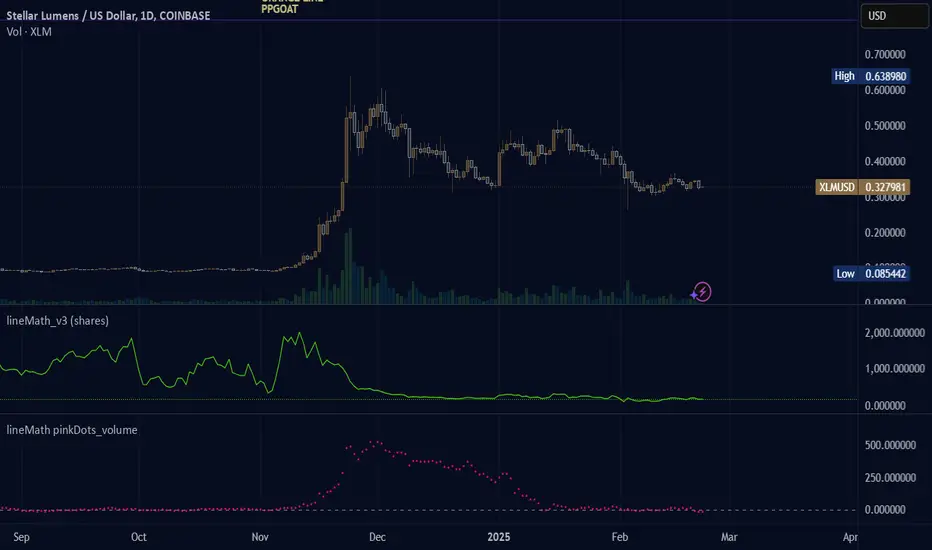
(XLM) stellarStellar, an inactive pond with ducks wading graciously through the water while those sitting by steadily view the inactive activity of peaceful animal life living among the life of humans, no voices, only the sound of trees rustling and wind blowing through the air.
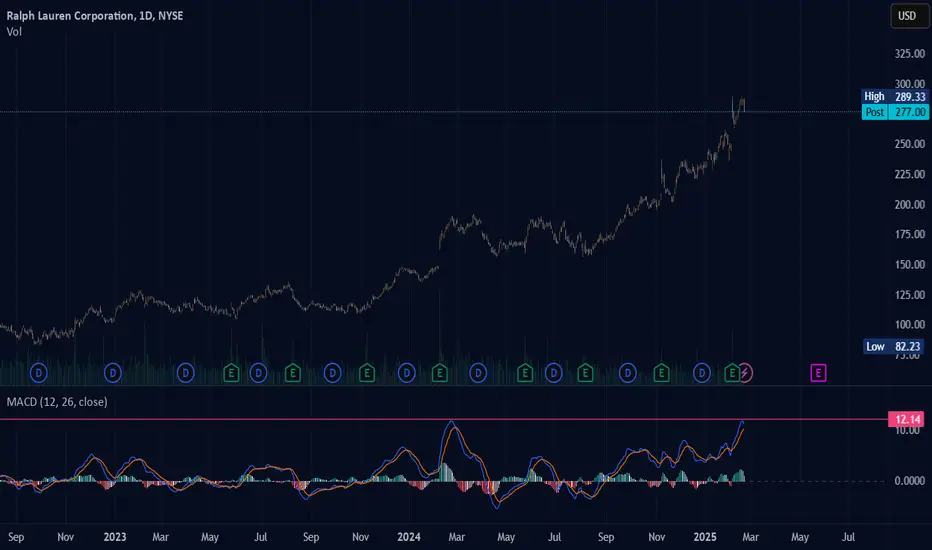
(RL) ralph lauren A chart to view Ralph Lauren through some visual of my indicators for anyone who wants to see. Make what you will from the image and make up your own mind about the fear and greed concept for Ralph Lauren right now. Will the price continue, or will the price not?
The shares represents shares bought. The green line would then mean there are few shares bought and the shares are soon to go negative against the price of the stock. The more shares bought the higher the line spikes, pertaining to the lineMath_v3 (shares) indicator.

(RL) ralph lauren Crazy high price for Ralph Lauren right now. The RL stock is doing excellently; as I just noticed today. I was unable to find any clothing that fit me or fashion styles that looked both vintage and modern at the same time during the Holidays this year; or any year. On average, inside the RL store in Lehi, UT the quality of styles is limited and the prices are typical of what one would expect from RL. I wish RL would offer more styles that they used to based on the 90s and early 2000s here in Utah. I wish the discounted styles in my size were offered or not completely gone as soon as the sale arrives during the Holidays. RL is a highly sought after brand but I've only ever owned one piece of cotton blue button up Ralph Lauren Levi's-esque shirt that ripped at the elbow due to the cotton material being so tender. I'm not rating RL as a short due to the fact that I don't own the clothing and can't afford the clothing. The MACD is really high right now.
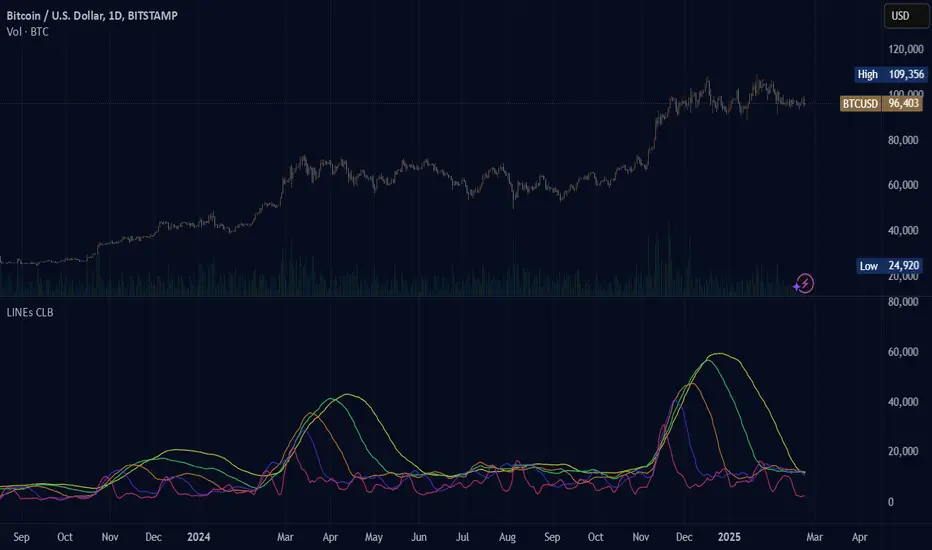
Bitcoin Weekly Update: 2025 Boom Boom Bull-Market Confirmed!If this week closes green it will be the first green close after three weeks red. This would confirm that the small retrace that we experienced recently is over. That the early February flash-crash was a market flush. That the consolidation phase we've been talking about is reaching its end. That the 2025 bull-market is now on! (We have only 2 days left!)
Good morning my very much and highly appreciated reader, how are you feeling in this wonderful now?
The fact that the retrace is over and the consolidation phase is over means that the next move is starting. The start of the next move is no small feat, no; this is something huge, it is something big.
It is not the same to say that Bitcoin is going up; know that Bitcoin is going up and waiting for Bitcoin to go up vs seeing the actual Bitcoin going up.
It is not the same knowing vs experiencing.
When Bitcoin starts to grow we are officially in the 2025 bull-market bullish wave. When Bitcoin starts growing, the entire world will move, the entire world will shake.
As Bitcoin grows, everything will change, for the better.
New players will enter the different markets all across the world.
New personalities will come to the front. New laws, new life, new energy; freedom and prosperity, the Altcoins also will grow.
It is not a small event, we are in front of a very strong market, many millionaires will be created during this bullish phase.
Plan calm. Be smart. Do what it takes. Do your own thing.
Your results are yours. You are special and you deserve the best.
The market offers endless opportunities, it is for you to take action and prepare to accept abundance, wealth, health and growth.
The bottom is in, Bitcoin is super strong.
This is the start of the next bullish wave. This bullish wave will produce a very strong bull-run at the end.
We are likely to witness slow and steady rising prices for a while and then bullish momentum will grow. We will have months and months and months to enjoy a positive market, a growing market, and this bull-market might evolve and give us more than what was initially thought.
Whatever the market does, you will be rewarded based on your own actions. What you get will be defined by your thoughts.
Develop a positive attitude, a positive mind. Visualize yourself achieving your goals. There is no limit, you can aim as high as you want.
Namaste.

BTC (BTC/USDT) 4H Chart: Bullish Momentum BuildingThe 4-hour Bitcoin chart is showing clear signs of bullish continuation. Price action is forming a series of higher lows, supported by an increase in volume, signaling strong buying interest. The RSI is trending upward but remains below overbought levels, leaving room for further upside.
Support remains well-defined, providing a solid foundation for this setup and a favorable risk-to-reward ratio. Traders should watch for a clean retest of the breakout zone or a confirmation candle for potential entry.
Overall, market structure, volume dynamics, and momentum indicators are aligning for a possible bullish continuation on the 4-hour timeframe.

Ethereum (ETH/USD) Long Setup on 1D – Bullish Breakout Ahead Ethereum (ETH) stands at a crucial crossroads on the 1-day chart. After weeks of consolidation, the battle between bulls and bears intensifies. Yesterday’s candle closed above the critical $2,800 resistance—a level the market has respected for weeks. This isn’t just a line on a chart; it’s a signal that the tides may be turning.
Markets reward those who act with insight, not impulse. Is this the moment Ethereum reclaims its momentum?
do you trust the breakout or expect a fake-out? Let’s discuss below! 👇

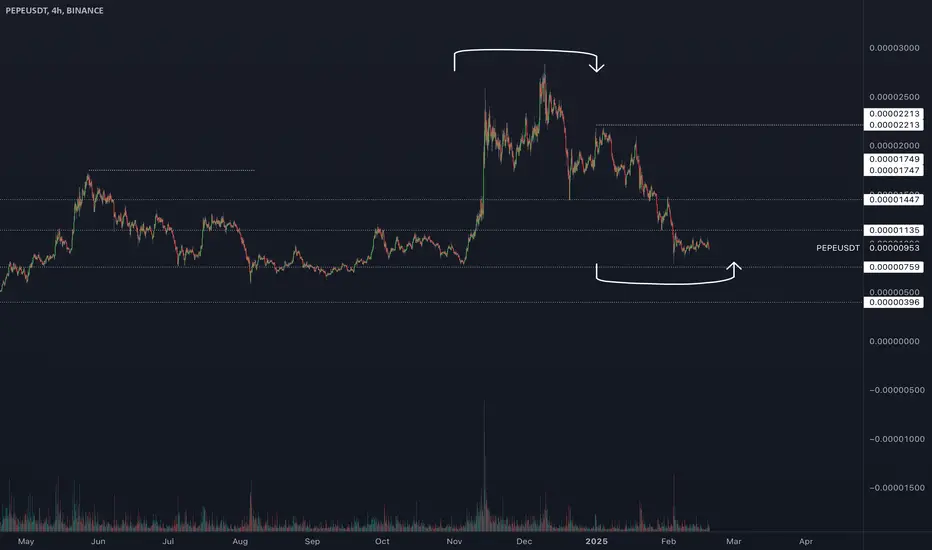
PEPE (PEPE/USDT) Potential Bottom and Key Levels to Watch 4HPepe Coin (PEPE) has been showing some interesting price action recently, and many traders are keeping a close eye on its movements. At current levels, there is a possibility that the asset is approaching a potential bottom, making it an intriguing spot for both spot and leverage orders.
Looking at the charts we can see that Pepe is testing some critical support levels. If these levels hold, we could be looking at a reversal or at least a stabilization phase that offers solid entry points for traders.
Strategically placing both spot and leverage orders around these levels could lead to favorable outcomes, but as always, make sure to use proper risk management and assess market conditions closely.