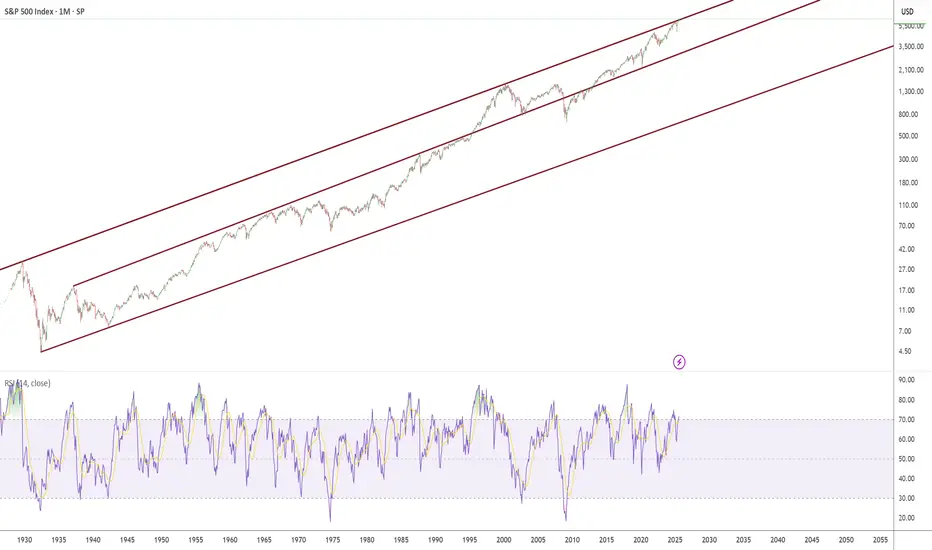
1929 to Present day Trendline Channels The chart represents some very meaningful and powerful trendlines.
I have magnetised these trend lines to be exactly on the peak of September 1929 and exactly on the peak March 2000.
I drew these lines to the high of day on the given peak days in Sep 1929 and March 2000, combined with a line extension.
(Meaning its not a manual placement this is the exact trendline channel)
Trendline validation (how many times have we tagged it per month - it has also been tagged many more days):
August 1929
September 1929
March 2000
November 2024
December 2024
January 2025
February 2025
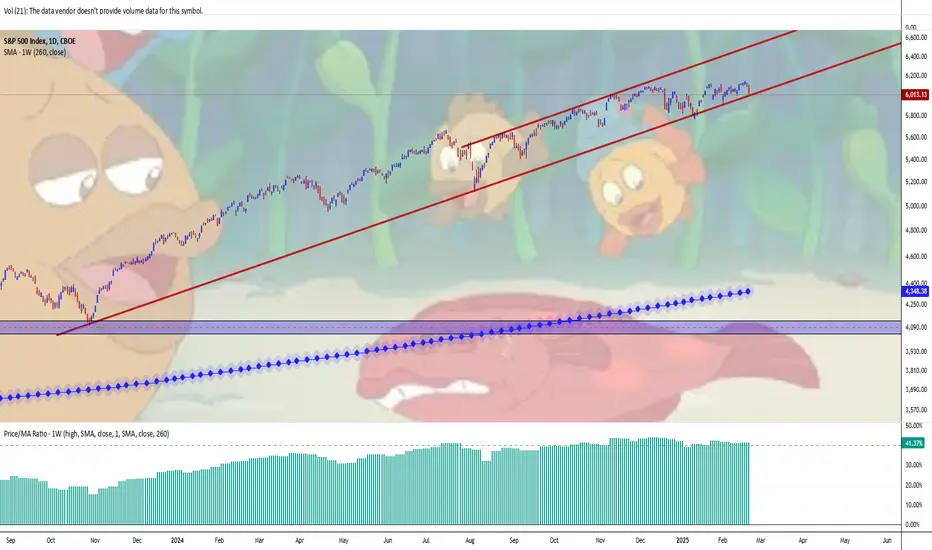
When you zoom in to our present year/months/weeks/days, you can see we tagged the trendline November 2024 to February 2025.
We have now broken above the trendline for July and August 2025.
You will also notice a middle trendline this support formed on the 1st of March 1937 and acted as resistance until it broke through on the 1st of May 1995 about the time when everyone had a home computer and windows 95.
This middle support held strong during the 2000-2003 dotcom crash
The middle support broke during the 2008 financial crisis.
However it regained its support in 2013 and then tagging it in the 2020 covid crash.
Over nearly 100 years these channels have remained strong, it is honestly crazy to think we have now broken a 96 year old trendline in 2025.
The question is does this trendline become support or resistance?
2025forecast
S&P500 Index Goes 'Floundering', ahead of Bearish HarvestWhile the S&P 500 is generally expected to perform well in 2025, with forecasts suggesting gains ranging from 9% to 14.7% depending on the source, there are several factors that could lead to a less favorable performance or even a decline:
High Valuations: The S&P 500 is currently trading at high valuations, with a P/E multiple of 22 times projected earnings, which is above historical averages. This elevated valuation increases the risk of market downturns if there are negative economic shocks.
Economic Uncertainties: The economic landscape is filled with uncertainties, including potential inflation increases and geopolitical tensions. These factors can impact investor confidence and lead to market volatility.
Interest Rates and Bond Yields: Higher bond yields can reduce the attractiveness of stocks compared to bonds, potentially leading to a decline in stock prices.
Earnings Growth Expectations: While earnings are expected to grow, there is a risk that actual growth may not meet these expectations, which could negatively impact the market.
Policy Risks: Changes in trade policies, such as tariffs, and shifts in fiscal policy could also affect the market's performance.
Historical Patterns: Achieving three consecutive years of high returns (above 20%) is rare for the S&P 500, suggesting that 2025 might not see such strong gains.
Overall, while there are positive forecasts for the S&P 500 in 2025, these potential risks could lead to a less robust performance or even a decline if they materialize.
// While salmon make up the bulk of their diet, Coastal Brown Bears also enjoy a fresh flounder now, and again.
Best wishes,
PandorraResearch Team 😎
Bitcoin Year 2025Market analysts and crypto experts anticipate that Bitcoin could soar to $600K this year, fueled by supportive policies and growing institutional adoption. Key drivers include deregulation efforts and pro-crypto measures under the current administration. President Trump has also reshaped the political landscape by appointing lawmakers who strongly advocate for cryptocurrency, setting the stage for a potential rally.

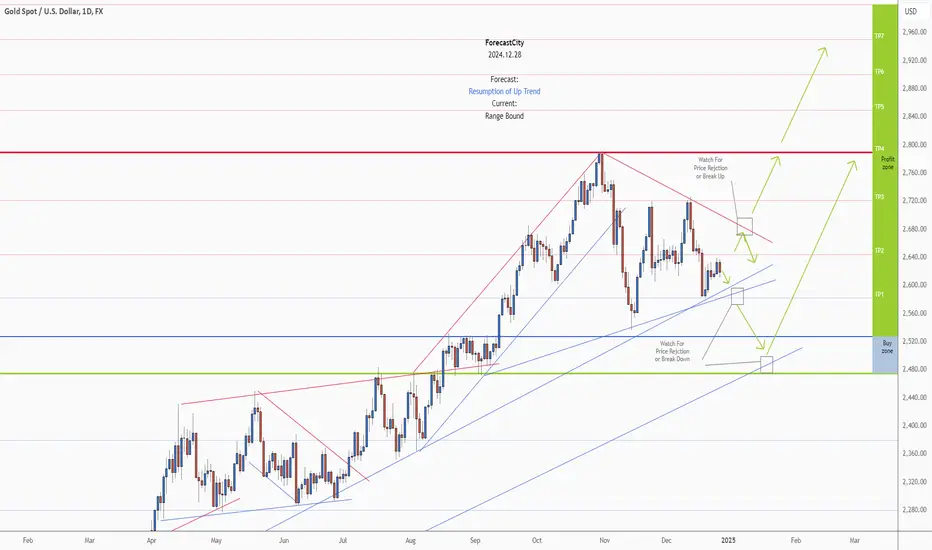
GOLD - 2025 Forecast - Technical Analysis & Trading Ideas! 2025 forecast:
While the price is above the support 2475.27, resumption of uptrend is expected.
We make sure when the resistance at 2789.95 breaks.
If the support at 2475.27 is broken, the short-term forecast -resumption of uptrend- will be invalid.
Technical analysis:
A peak is formed in daily chart at 2726.10 on 12/12/2024, so more losses to support(s) 2582.31, 2527.50 and minimum to Major Support (2475.27) is expected.
Trading suggestion:
There is possibility of temporary retracement to suggested Trend Hunter Buy Zone (2527.50 to 2475.27). We wait during the retracement, until the price tests the zone, whether approaching, touching or entering the zone.
We would set buy orders based on Daily-Trading-Opportunities and expect to reach short-term targets.
Beginning of entry zone (2527.50)
Ending of entry zone (2475.27)
Take Profits:
2582.31
2644.20
2721.30
2789.95
2850.00
2900.00
2950.00
3000.00
__________________________________________________________________
❤️ If you find this helpful and want more FREE forecasts in TradingView,
. . . . . Please show your support back,
. . . . . . . . Hit the 👍 BOOST button,
. . . . . . . . . . . Drop some feedback below in the comment!
🙏 Your Support is appreciated!
Let us know how you see this opportunity and forecast.
Have a successful week,
ForecastCity Support Team