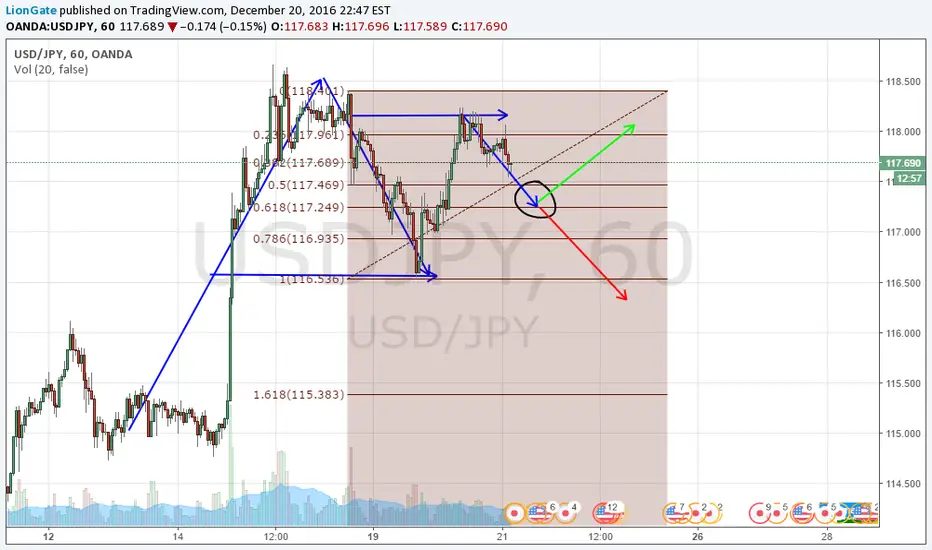
Going Bearish on USDJPYNow last week I went short on this pair and banked a couple hundred pips. I just put out a video on how I will be looking to do the same thing this week. youtu.be
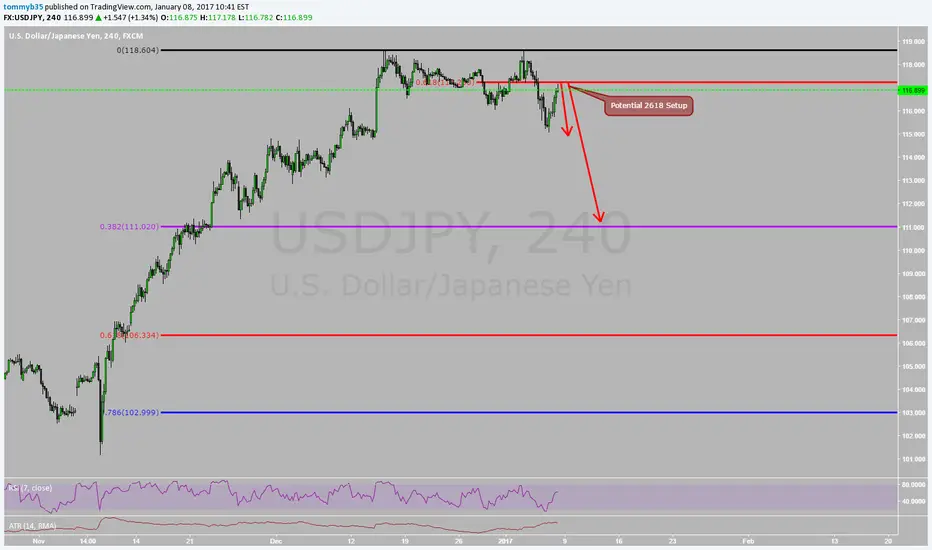
I do believe that its not out of the realm of possibility to see this pair retrace down to 111.000. Which as you can see is only a 38.2 Fibonacci retracement of the entire leg up.
Here on the chart we have a potential 2618 setup that can be used to enter on the short side.
I myself will be looking to take off the first half of my position around 115.26. That way I can lock in some profits and then look for some extended targets around 111.05.
Now I know that the popular opinion out there is "Dollar Strength" but I think we might start seeing some relief in the dollar, and I believe that this potential setup my provide a great opportunity.
As always, follow your rules and trade your plan.
Good Luck and Good Trading
2618 Trade
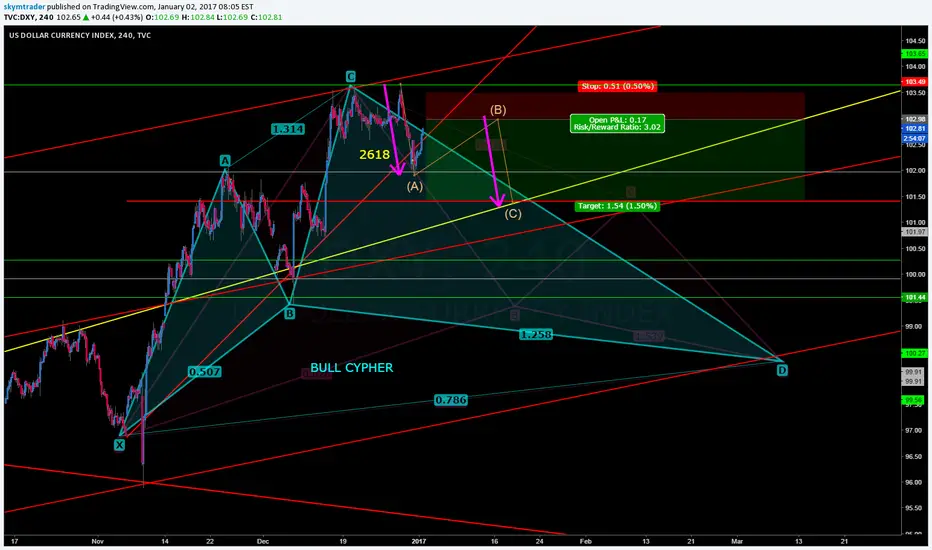
US DOLLAR SHORT TERM WEAKNESSHAPPY NEW YEAR!
Something to consider as we look for trades om opposing currencies!!!
Good Luck!
KEEP THE RADARS UP!!!

Two Different Trading Strategies, Same BiasOn the left I am showing how a wave theorist would look for a trade based on impulses and corrections.
On the right I am showing how a 2618 trade setup works.
As you can see, these are two totally different trading strategies but they are both giving the consensus of a short bias for the pair.

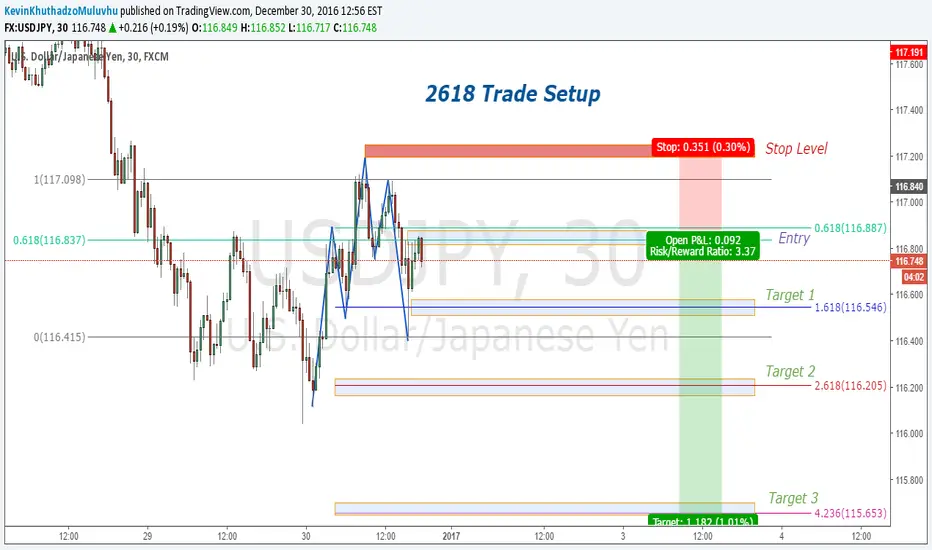
USDJPY 2618 Trade SetupA 2618 Trade Setup has just emerged on the 30M time frame. We are now Short at 116.887 with Stop level at 117.200 and Targets 1 - 116.546 Target 2 - 116.205 Target 3 - 115.653
Goodluck!!
GBPUSD 2618 SETUP A 2618 Trade setup looks to be developing on the daily time frame. Price action broke through Trendline support of the correction channel. If price retraces to 1.26000 which is also a retest of the trendline and psychological resistance area, we are looking to short this pair. Stoplosses at the previous high - 1.27800 and Profit Target 1 - 1.24000 area Target 2 - 1.22000 area.
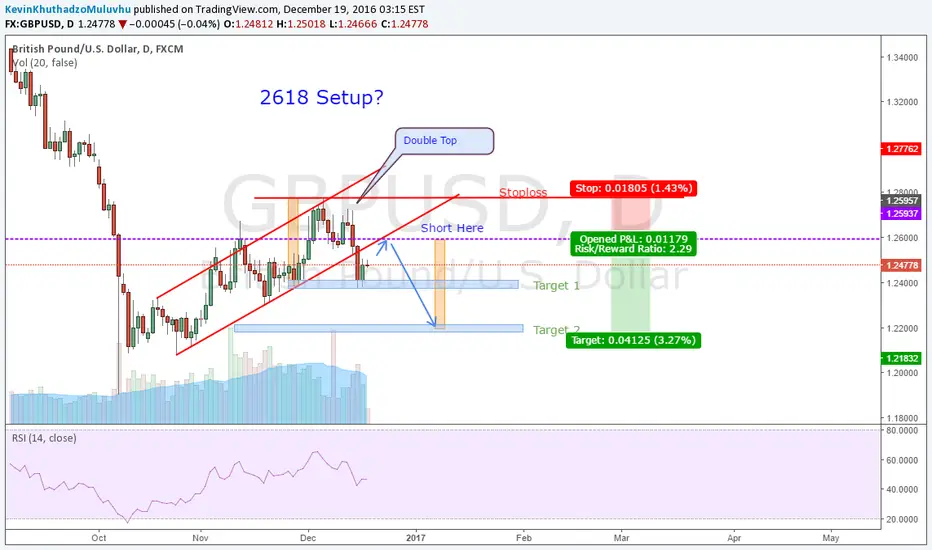
Double Top FormationFormation of a .2618 appears to be imminent. Direction is ambiguous (leaning towards short/bearish trend).
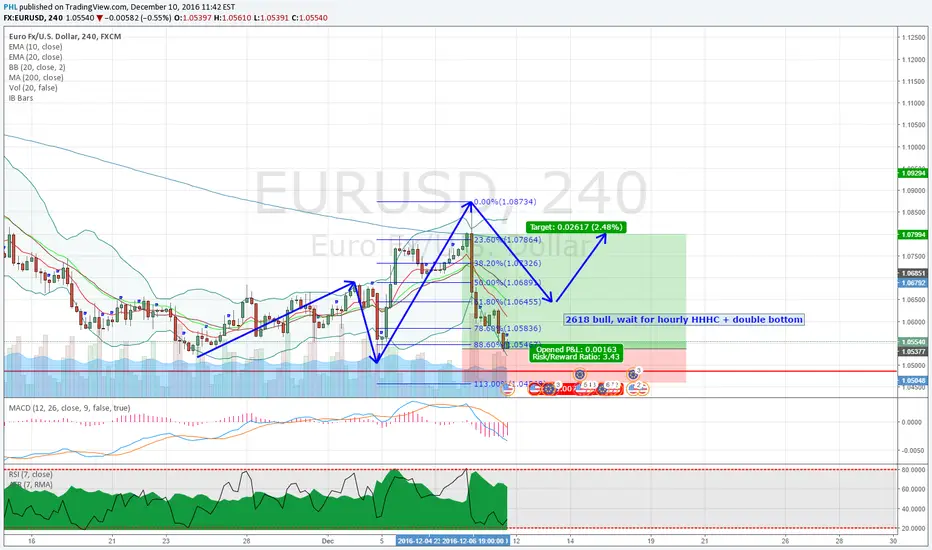
EURUSD potential 2618 trade setup on 4H chartWe are already in the killzone to buy here at market prices. The orignal idea and setup was to buy at the 61.8 which would have been the aggressive option. But looking at the sharp reversal from recent highs, particulary visible on the weekly and daily chart I would suggest a more conservative entry here. It was worth the waiting as we have blown way past the 61.8% retracement. Right now we have a splendid risk/reward profile and I would be a buyer if we get a double bottom on the hourly time frame and then a higher high higher close candle. I expect this will lower the R/R but at least it leaves one more comfortable. On the other hand, those who reduce their stops after a double bottom could increase their R/R instead.
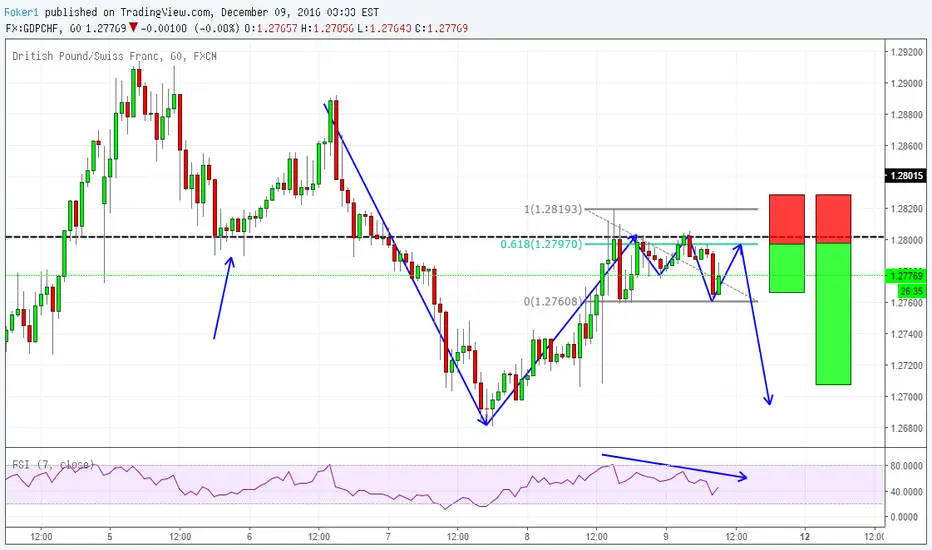
Trend continuation 2618 on GBPCHFHi guys,
here we have a nice 2618 on a trend continuation setup, You can see we broke to the downside the last support level (black line) and now we are retesting it. We know that when broken, support could turn into resistance. In addition price is finding some troubles at this level.
We have a double top with rsi divergence that's been broken to the downside. So we have ultra confiirmation of our analysis.
Now we can exploit the market using the 2618 strategy. I'm going to sell the market if and when price will reach .618 level, stops above the highest high, first target at a retest. Second target down along with structure.
Let's see.
If you have any question, please fill the comment section below.
Otherwise, see you in the next chart!
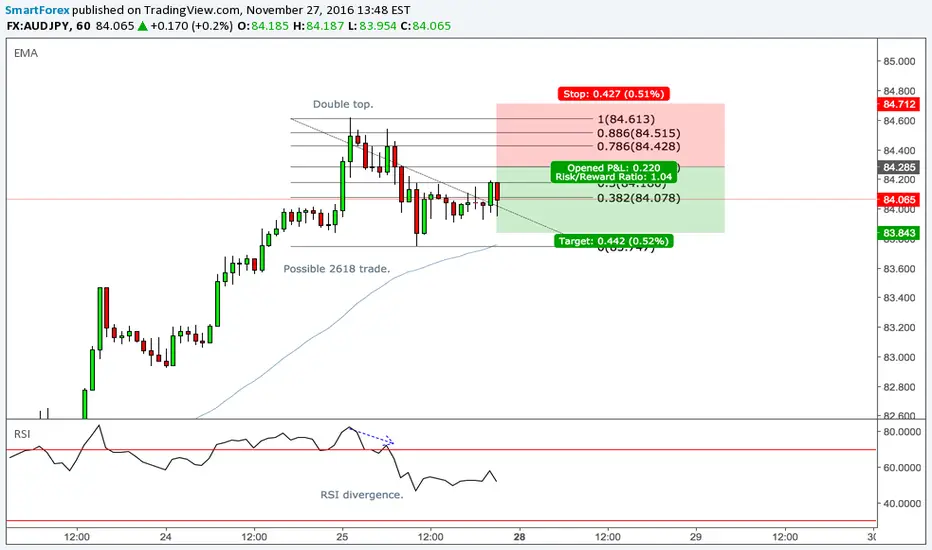
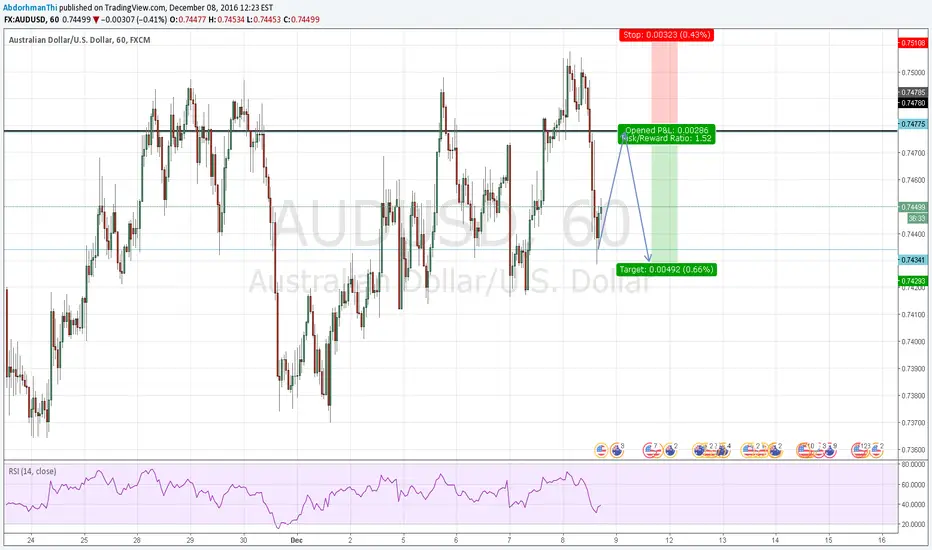
AUDUSD: Short term sell 2618 setupAUDUSD failed to break new highs. It formed a double top and now it has a potential to move up to the .618 fib level for a 2618 completion for a further downside.
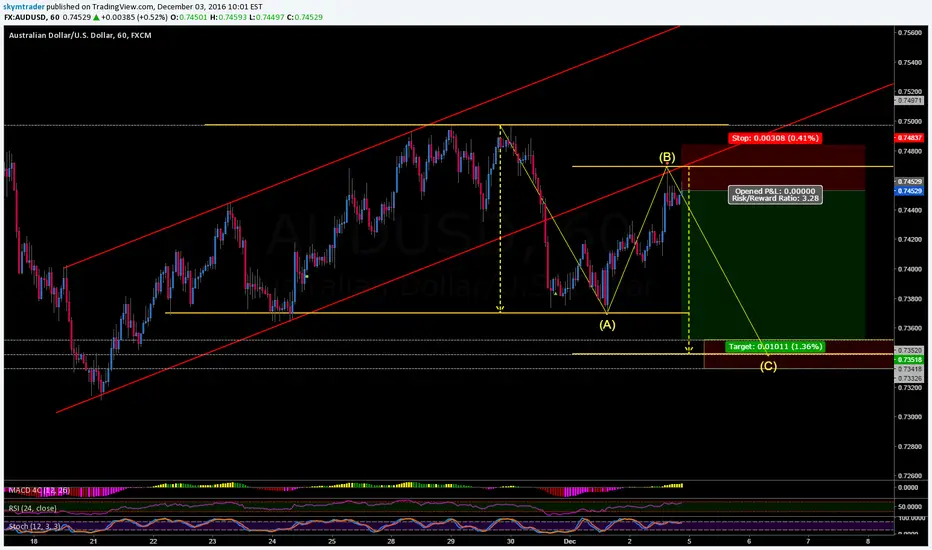
AUD/USD SETUPS, Currently Sellaustralian and us dollar
double top formed, broke previous support, 2618 trade, fib is strongly in play, 1400 pips to be captured.
if price doesnt break the A leg of our formation we could be looking at a long opportunity at -27 fib level to capture 1600 pips back up to previous structure resistance.
300 pip stop, 1400 pip profit, excellent risk reward ratio

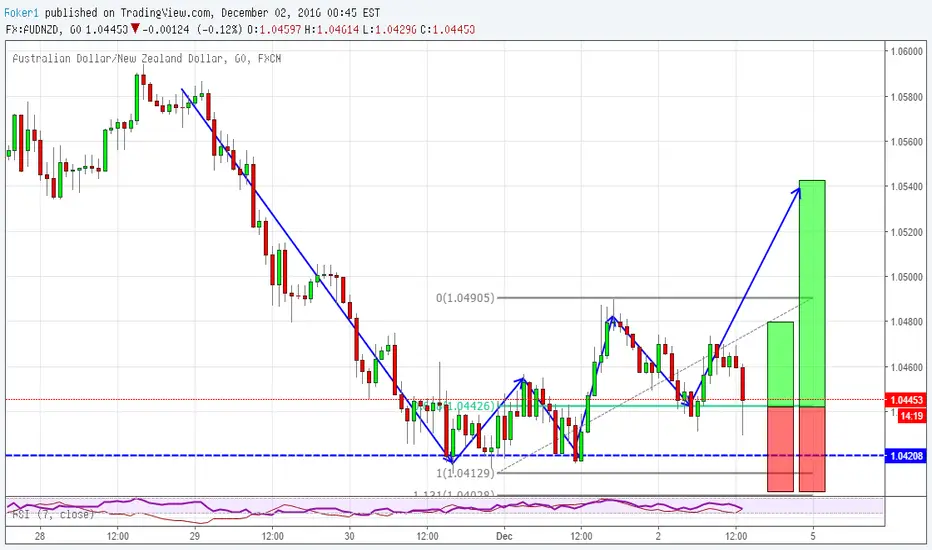
Aother 2618 on AUDNZDHi traders,
this setup is similar to the USDJPY's one. We are testing a resistance level (blue line) and we created a double bottom with rsi divergence and then we broke that to the upside, giving us reason to believe in a change of trend.
So we wait for a .618 retracement of the impulse leg that broke the double bottom and then we buy the market.
First target at the retest, with roughly a 1:1 RR, and second target for a bigger move to the upside.
If you have any comment, please do underneath.
Otherwise, see you in the next chart!
long-short-long1.turn down at 0.74503 under the 2618 pressure.
2.turn up at 0.7332 under the cypherpattern
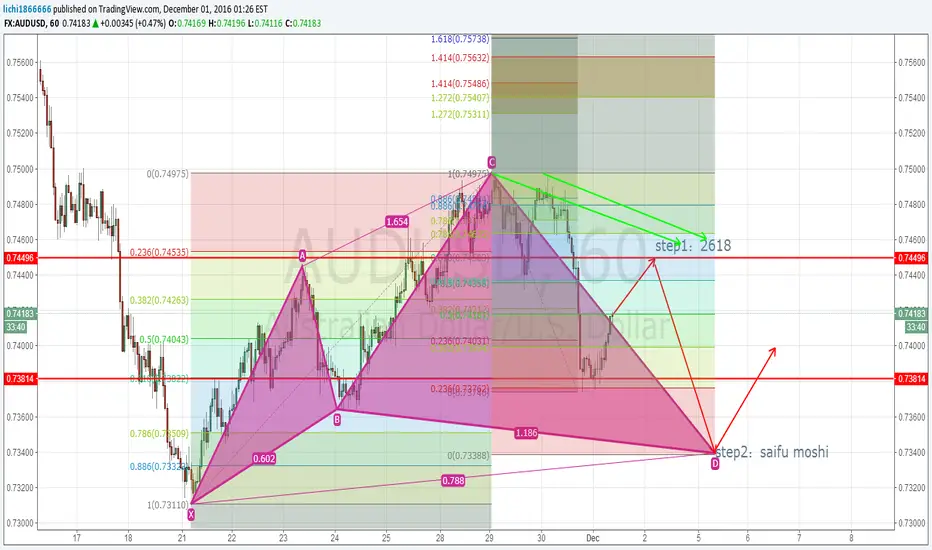
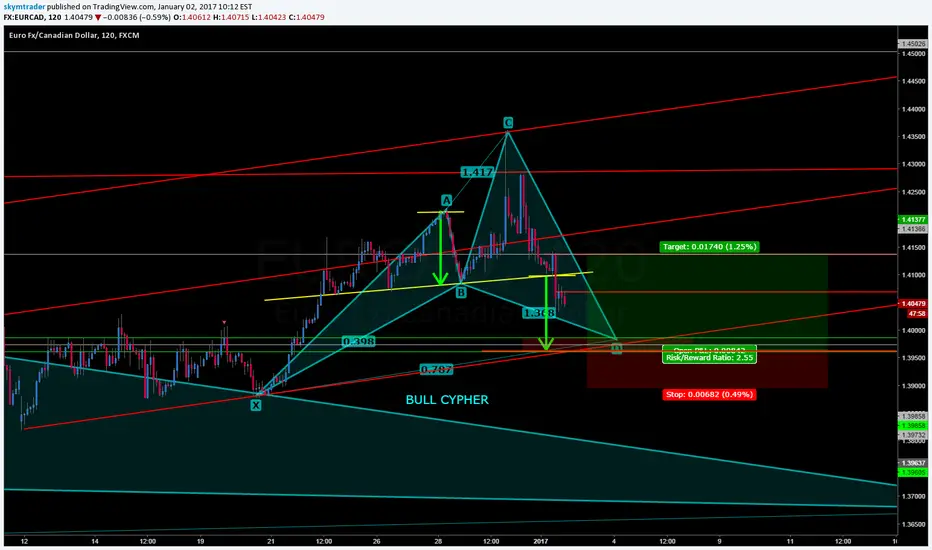
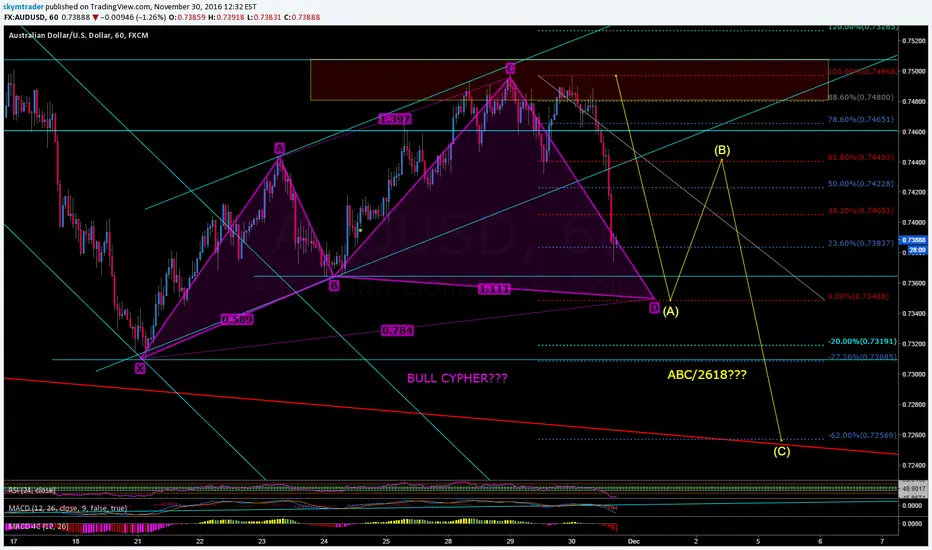
AUDUSD BULL CYPHER AND 2618 POSSIBLEGot the impulse leg down...be on alert!!! The continuation sell should be very nice...
75+ Pips BUY at Cypher D completion
100+ Pips SELL after pullback
Good Luck!
KEEP THE RADARS UP!!!
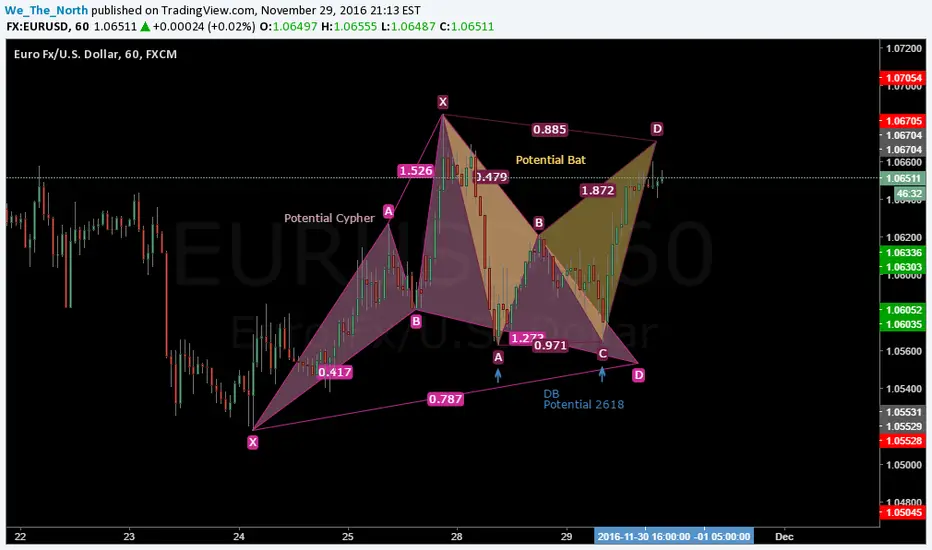
EURUSD Potential Cypher + Potential Bat + Potential 2618Three different opportunities here on the 60min. Potential Bullish Cypher, potential Bearish Bat, and a potential 2618 opportunity with the double bottom coming from the "A" and "C" points of the Bat. Price action might be too choppy for some people to consider the Cypher valid, but if it's still valid in your rules, then here you go. Have fun!
2618 trade on USDJPYHi traders,
here on USDJPY we just broke above an important daily structure level, the next level would be near to 114 flat. With that being the case, i want to be involved only in buying opportunities; recently in 1hr chart we had a good double bottom and after that price broke that to the upside, signaling also in this timeframe a bullish tendency.
A 2618 is a technique developed by Jason Stapleton used after a double top or bottom broke to the upside or downside. After the broke we are going to wait for a .618 retracement in order to hop on the trend.
Stops below lower low, first target at the retest of the highest close, second target for the long run.
If you have any comment, please do underneath.
Otherwise, see you in the next chart.

And USDJPY continues to provide us with more trading optionsToday I would like to continue my analysis on the USDJPY. IF price can rally to 113.599 we will have the D completion point of a bear bat. We also had a completion of a 2618 trade set up. I did not get filled the 2618 yet. IF price does come back down into the 112.111 level I will get long and ride price up into the completion of the D point of the Bat pattern for a stop & reerse trade.

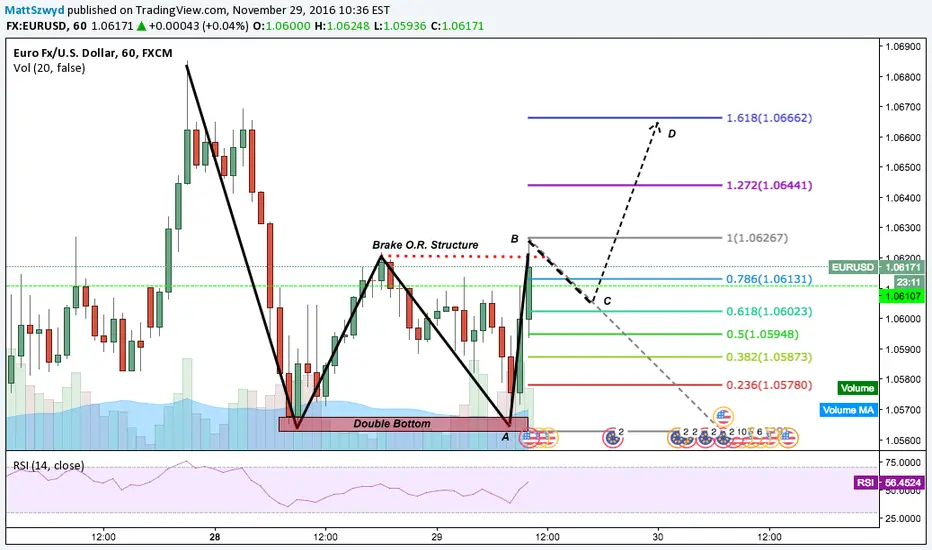
Potential 2618 Trade Taking ShapeA double bottom appears to be forming on the EURUSD, which has the potential to set up a 2618 trade should the bullish candlestick close above the previous outside return before retracing to the .618 of leg AB. This technical setup will, inevitably, face heavy headwinds with regards to fundamental outlook on USD strength. This trade is currently forming in a consolidation zone on EURUSD, so my question is... will this be the break we're looking for?