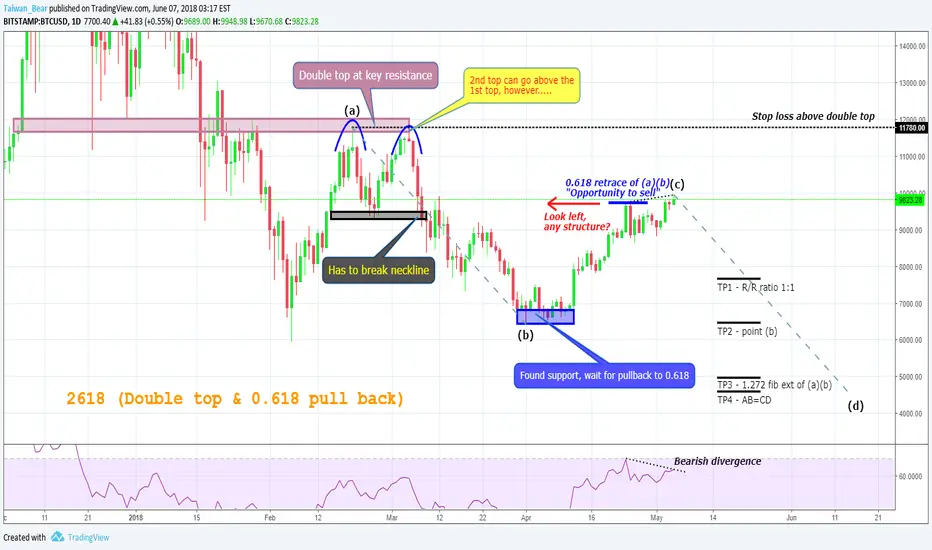
2618 (Double top & 0.618 pull-back) - do not miss it!!In the last couple of TAs I have mentioned the “2618 pattern” and have been asked what 2618 means. Sorry for taking it so long as it took me quite a while to put everything altogether. But, as promised, I have explained below the rules and trade setups for the 2618 pattern.
What are the rules/setups/steps for 2618?
1. Form a double top (Note #1)
2. Neckline has to be broken
3. After price found support at point (b), wait for pull back to 0.618 fib retracement of (a)(b)
4. After price retraced to 0.618, look for confluence and sell (eg. Structures, trendlines , double top on a lower time frame, rsi divergence, bearish pin bar , inside bar break down etc.) (Note #2)
5. Stop loss to be set above double top
6. Set Take Profit levels (Note #3)
Note #1 (Double top):
The first step for the formation of 2618 is to form a double top at key resistance levels. Why at key resistance levels? Because we want to avoid fake double tops which can occur occasionally.
There are some variations between various resources (books, websites) regarding the definitions of “double top”. The main differences occur where:
a) Some said for a double top to be valid, the wick of the 2nd top cannot exceed the wick of the 1st top; whereas, others said:
b) The wick of the 2nd top can exceed the wick of the 1st top but the candle close of the 2nd top CANNOT exceed the wick of the 1st top; or
c) The wick of the 2nd top can exceed the wick of the 1st top and the candle close of the 2nd top CAN exceed the wick of the 1st top; or
d) The wick of the 2nd top meets at least the candle close of the 1st top; or
e) The body of the 2nd top cannot exceed the body of the 1st top
Personally, I would say all the above definitions work just fine although I do prefer definition a) because it means that the selling pressure is strong and the bulls fail to make a higher high. When there is a higher high formed in a downtrend, it can mean the downtrend has reversed and therefore you might not want to sell when the price pulls back to the 0.618 fib retracement.
Note #2 (0.618 retracement):
When the price pulls back to 0.618, it does not mean to sell straight away. There must be more than one reason to sell other than the 0.618 retrace. The more reasons the better. In this example, you can see there are certainly structures (key resistance levels) at the 0.618 retrace. As well, there was a double top formed on the lower time frame. Consequently, you can sell.
After BTC hit the 0.618 retrace the first time, the price dropped from $9735 to $8650. but quickly bounced back to the 0.618 retrace level. That was a second & better opportunity to sell. Not only did BTC form a double top on the larger time frame, but also with a bearish divergence on the 4hr time frame. Accordingly, you have more reasons to sell.
Note #3 (Set take profit)
Same as the rules of “Double top”, there are some variations as to which price level should you take profits. Personally, I would stick to the below:
1) First, take profit when risk/reward ratio hits 1:1 (recommend to take 30% - 50% profits and adjust the SL of the remaining positions to break-even)
2) When price hits the same price level as the low after the neckline is broken ((b) point in this example)
3) When price hits 1.272 fib extension of (a)(b)
4) When price hits point (d) (using AB=CD pattern. If you are not sure what the rules of AB=CD are, you can refer to my previous TA in which I have attached the link below)
5) If in a one-way market (heavily bearish/bullish), you can always keep 10% to 20% of your positions and take profits when risk/reward ratio hits 1:5 or even 1:10
If you have enjoyed this post and would like me to do more of this kind of educational post going forward, please give it a "LIKE" as this post has taken me more than 4 hours to put everything together.
Lots of love,
Taiwan Bear
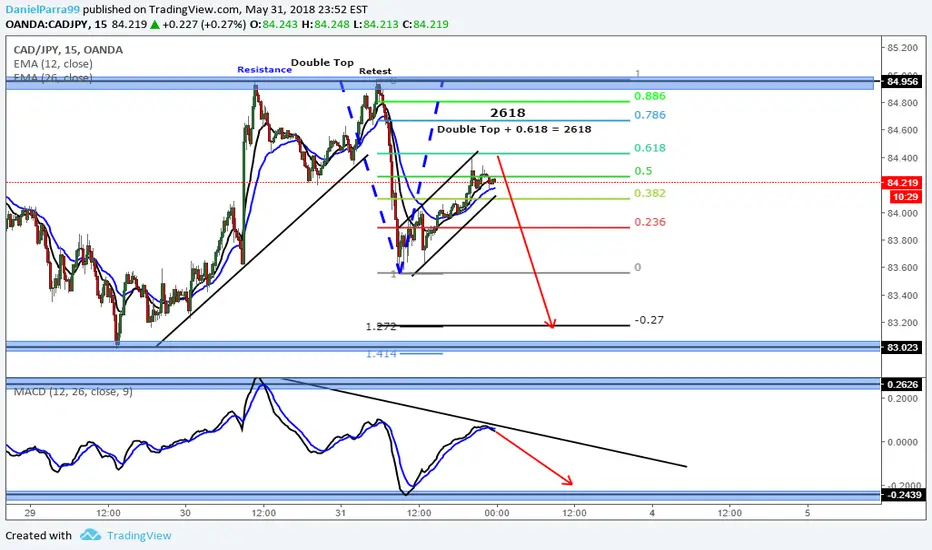
2618 Trade
CADJPY (2618) -15M ChartConfirmations for 2618:
- double Top
- measure bearish impulse
- retracement at 0.618 (on this case a pullback)
- sell towards -0.27 (take profit)
Double Top + 0.618 = 2618
Good Trading.
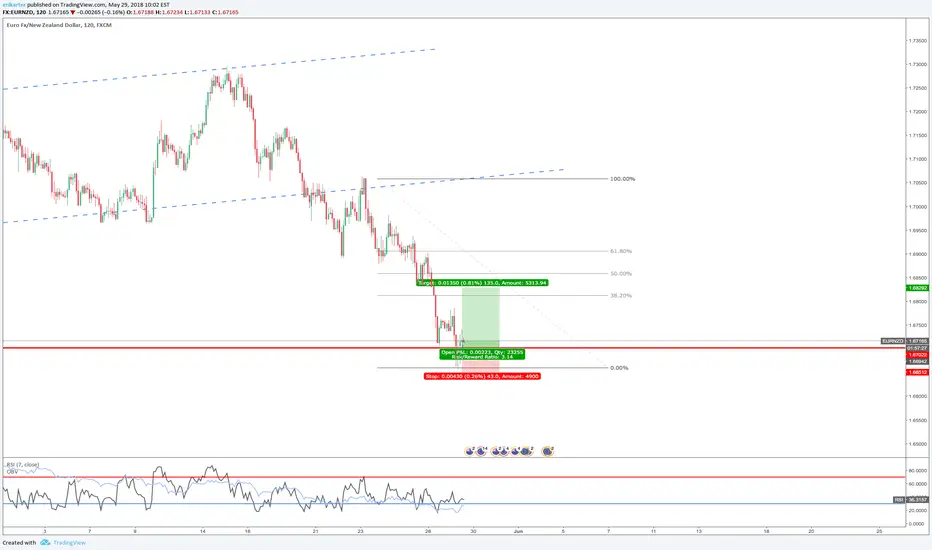
Long on EUR/NZDI enter on this idea after a retest of a double_bottom (2618), with a minimal stop loss and very good risk rewarding.
USDCAD LONGAverage trade is 7 bars on this strat im aming for 6 most importantly fib levels
Entry 1.27682

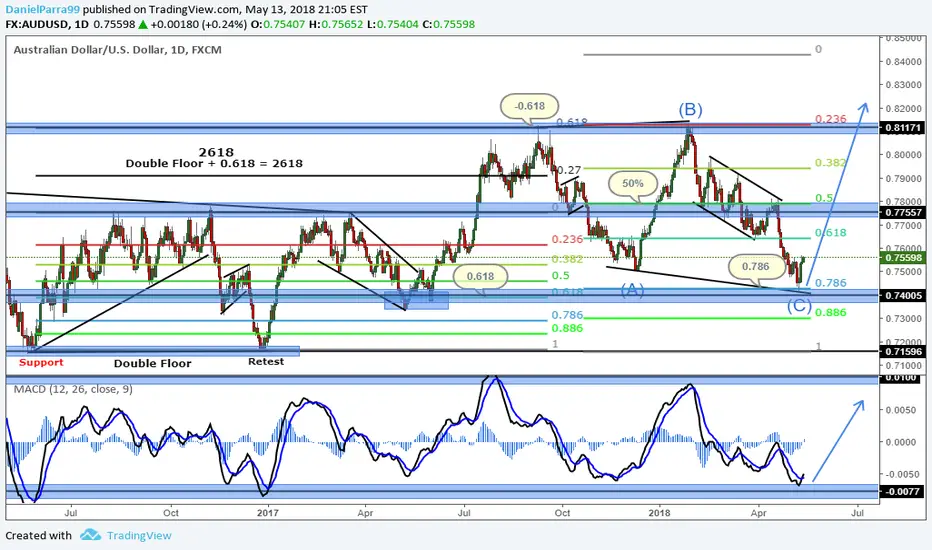
AUDUSD (2618 and ABCs) - Daily Chart2618 Setup
- double floor
- measure impulse
- retracement at 0.618
- TP at -0.27 and -0.618
Double Flooe + 0.618 = 2618
There's a perfect support and retest for that double floor that gave us this bullish impulse towards -0.618, at this point a major retracement is needed for further bullish movement, ABCs gave us that by consolidating and reaching 0.786 for major retracement.
MACD shows lower low expecting bullish impulse.
Good Trading. - Daily Chart
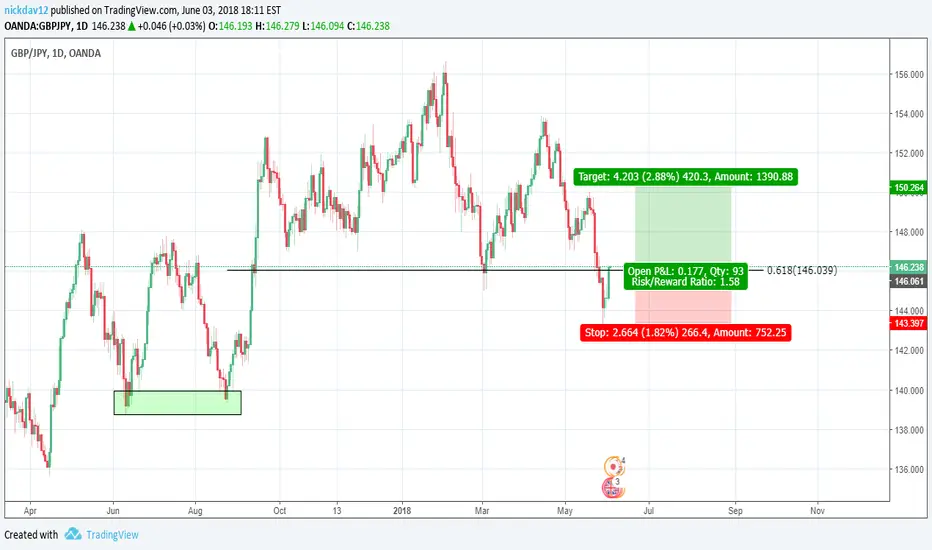
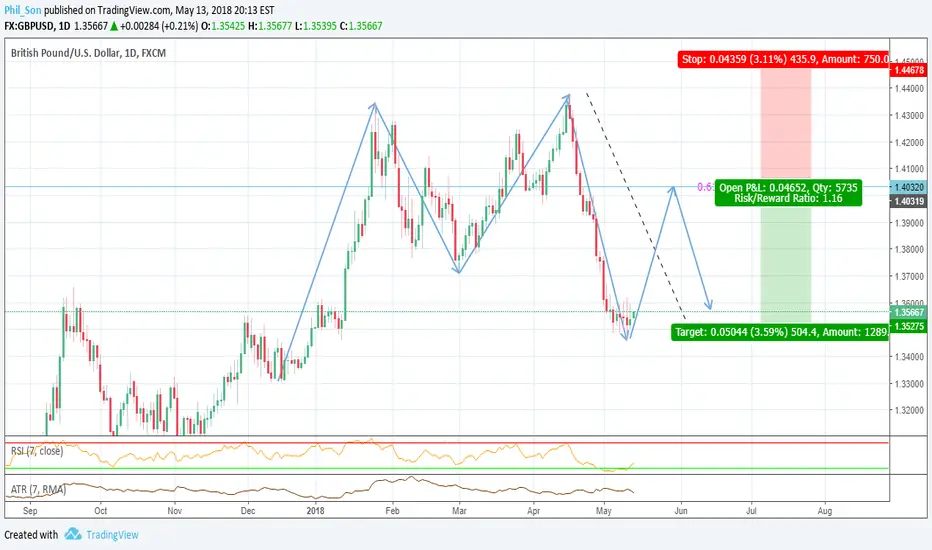
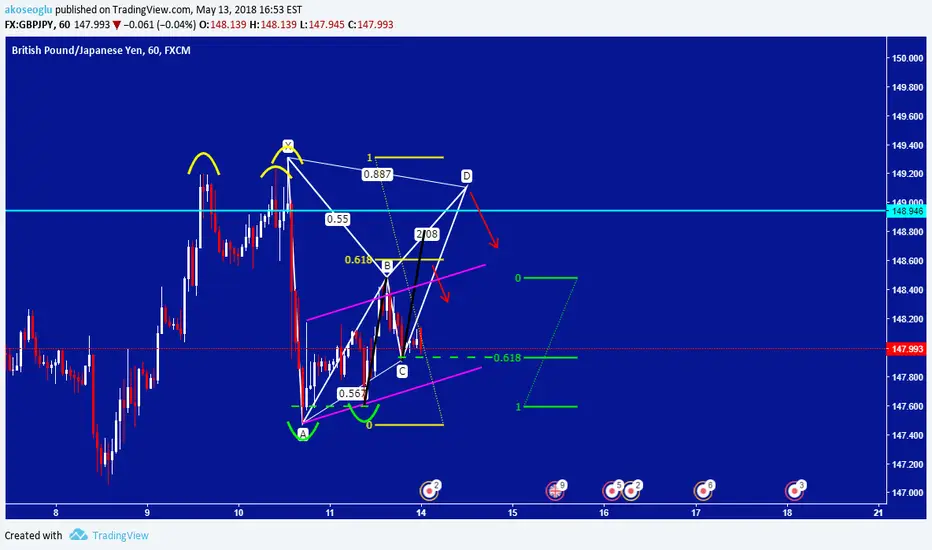
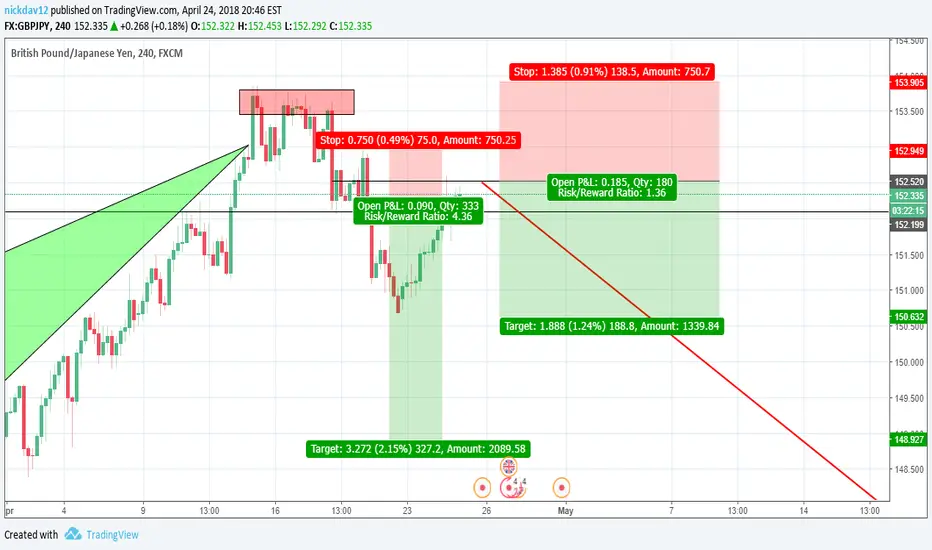
GBPUS Daily potential bear 2618Market, after that long drop, has shown an oversold condition on the RSI. If it decides to rally up, there might be a potential selling opportunity using the 2618 strategy. The 618 Fibonacci retracement lines up right some structure levels, so it might be a great area for entry. Stop loss will be above the previous top, using the ATR, and target would be a retest of the lower structure. Risk reward is a little over 1:1, so not a bad opportunity for swing traders trading the 2618.
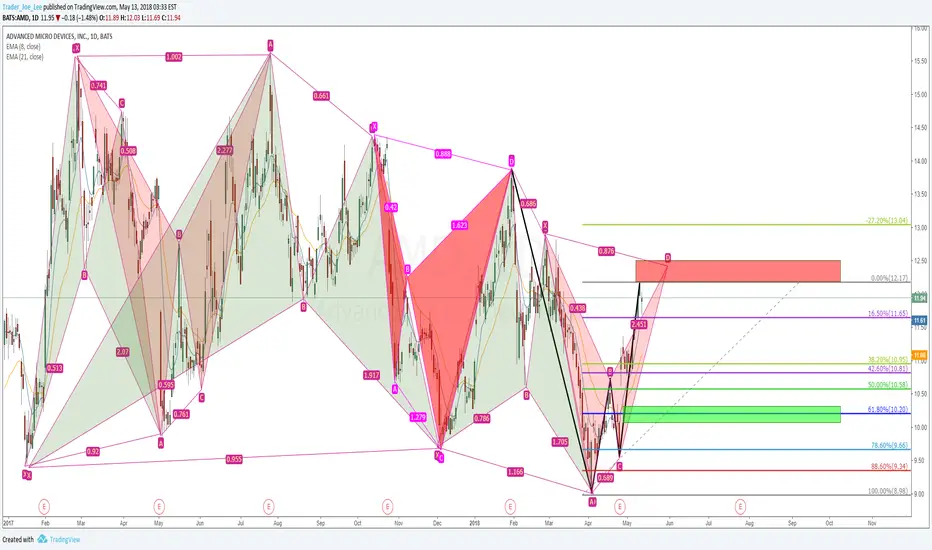
AMD bullish 2618 and bearish batAMD has been another quite great example for harmonic patterns trading since 2017.
This one should be my 7th idea about AMD on TradingView,basically all of which are shown in this chart.
Like BABA, I am more bullish on AMD and I still hold some longs from the last butterfly,
so I won't take the bearish bat to short; I'll take some profit around here instead
.
To buy it back, this bullish 2618 will also be a confirmation entry for the same butterfly,
so I'll focus on another opportunity to long around 10.00-10.20.
Let's see how it goes!
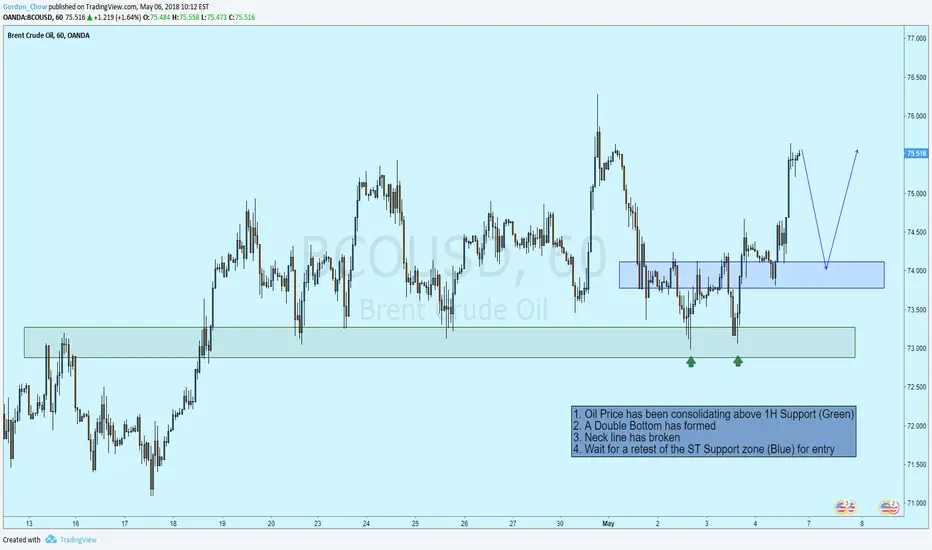
Oil / 1H / 2.618 Trade Set-up2018-5-06
1. Oil Price has been consolidating above 1H Support (Green)
2. A Double Bottom has formed
3. Neck line has broken
4. Wait for a retest of the ST Support zone (Blue) for entry
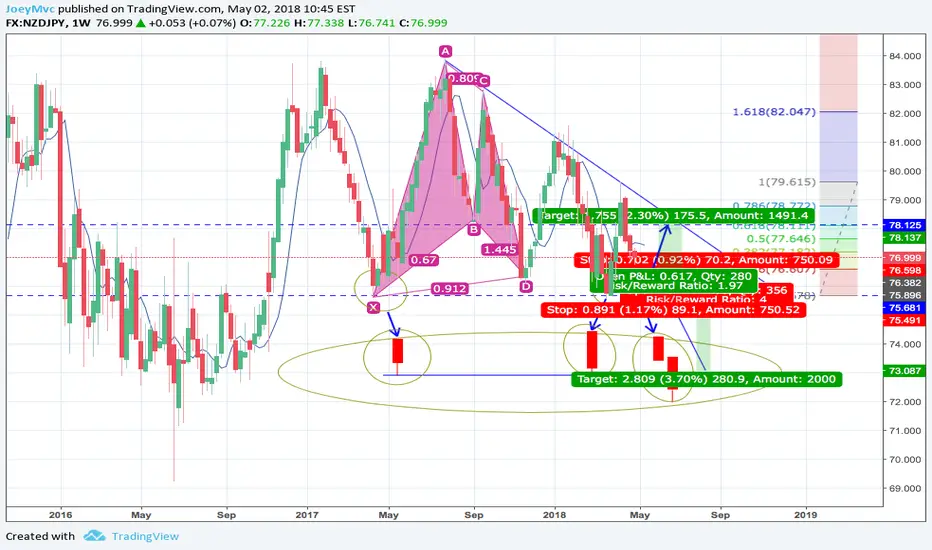
Potential NZDJPY Moves on Weekly - Very TextbookThe NZDJPY has been making textbook moves for the past 5 or so months and nows the perfect time to see some changes. We had a wedge pattern forming, as well as a bat pattern within the wedge as a little reassurance to buy. Following the leg formed by the bat pattern, we turned around at the .618 giving us a very nice 2618 formation. Going on, theres now a couple of scenarios we could have here;
1. Long position continuing on with wedge pattern.
- Look for a reversal around the NZDJPY 75.80 area.
- Stop loss - just make sure you don't get a lower low lower close candle. If you do then close the trade and take the loss.
- Take profit @ 78.04. Would recommend either trailing your stops as price goes up, or closing half your position @ 77.07
The other alternative;
2. Short position due to breakout. In this case;
-When price gets to that 75.8 area, look for a lower low lower close candle (L3C). The magnified areas in the photo explain this.
- You must wait for the close. Use the Daily chart to find the L3C candle.
- Confirm the close on the weekly. There may be a retest of structure following the L3C so beware of a slight retracement.
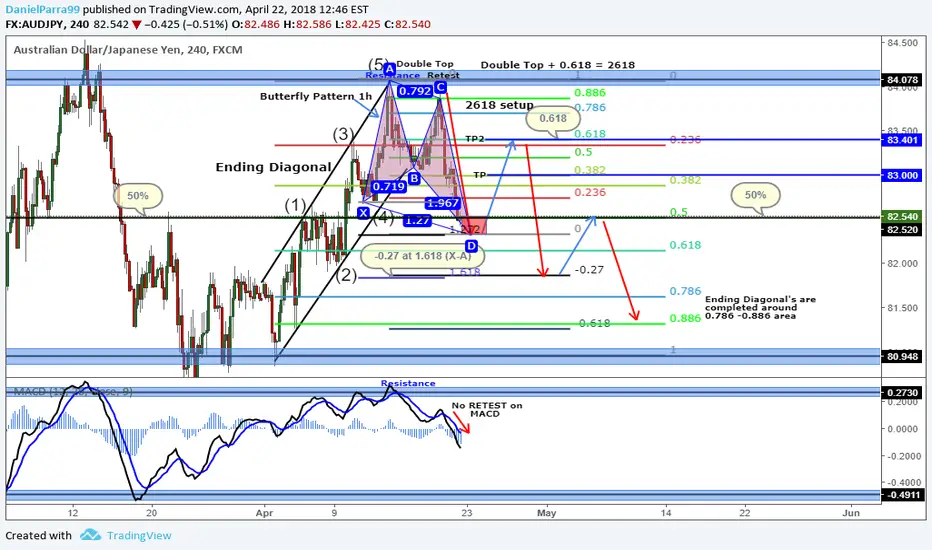
AUDJPY (Ending Diagonal, Butterfly Pattern and 2618) -4hEnding Diagonal confirmations:
- 1 and 4 at same price
- 5 clear points
- take profits between 0.786 - 0.886
Butterfly Pattern confirmations:
- A-B must touch 0.786, but cannot exceed X
- B-C touches 0.382, but sometimes goes further (does not exceed A)
- ABCD formation. D has to reach outside X and touch 1.272 or 1.618
- TP 0.382 TP2 0.618 (Fibo A-D)
2618 confirmations:
- double top
- measure impulse
- retracement at 0.618
- TP at -0.27 and -0.618
Double Top + 0.618 = 2618
I expect price to go bullish towards 0.618 for 2618 bearish impulse, TP would be at -0.27 where I expect some type of pullback before bearish continuation from 50% to 0.786 -0.886 area, that's TP for Ending Diagonal.
Good Trading
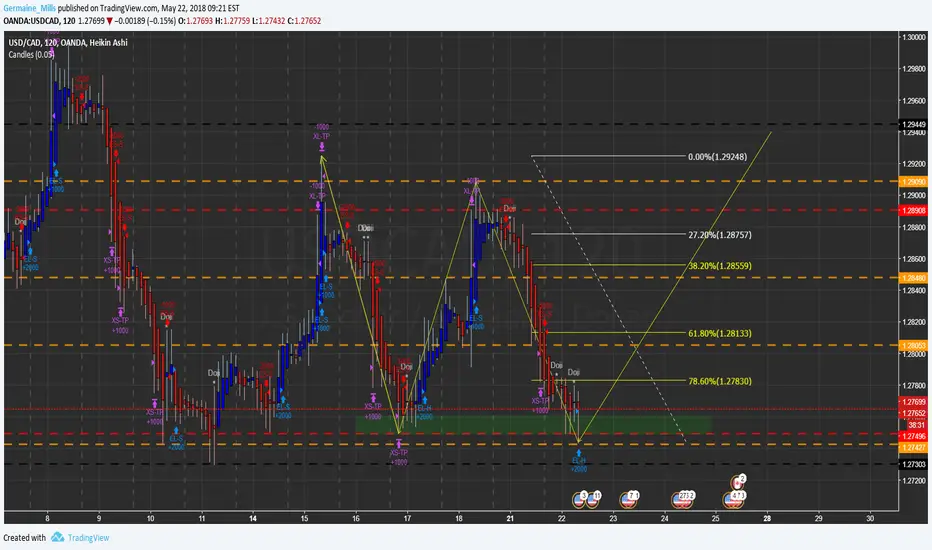
USDCAD (Butterfly Pattern and 2618 Setup) -1h Butterfly Pattern confirmations:
- A-B must touch 0.786, but cannot exceed X
- B-C touches 0.382, but sometimes goes further (does not exceed A)
- ABCD formation. D has to reach outside X and touch 1.272 or 1.618
- TP 0.382 TP2 0.618 (Fibo A-D)
2618 confirmations:
- double top
- measure impulse
- retracement at 0.618
- TP at -0.27 and -0.618
Double Top + 0.618 = 2618
I expect price to continue bearish towards 1.618 (extension) where Butterfly Pattern will be completed and our bullish retracement will begin for 2618 Setup, wait for retracement at 0.618 and sell all the way down.
Good Trading. -1h Chart


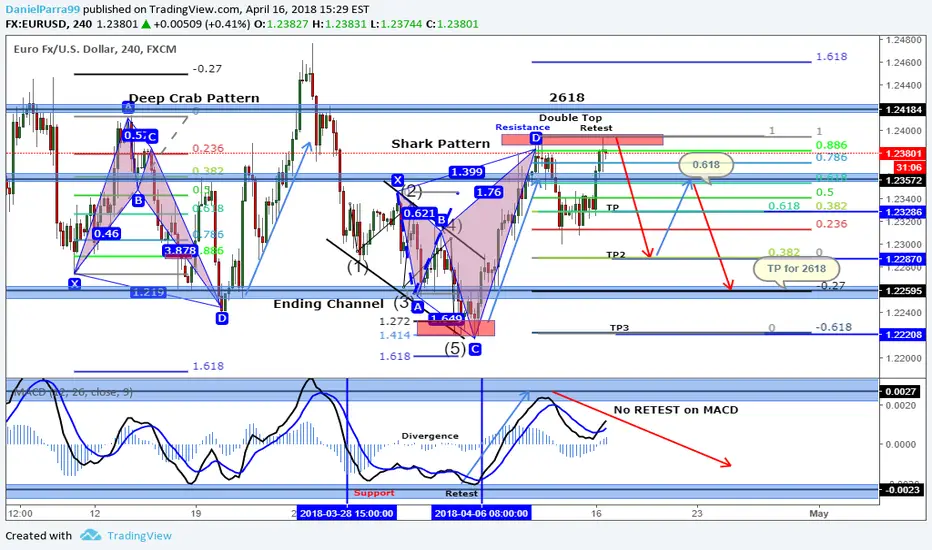
EURUSD (2618 and Shark Pattern) -4h ChartFirst there was a Deep Crab formation, which was completed by going bullish to previous resistance, after marking higher high it went bearish forming an Ending Channel, at that point I saw divergence, because the entire consolidation made a double floor insdie MACD, which gave us that bullish impulse for D completion of a Shark Pattern.
At D there's a possible Double Top for our 2618 setup:
- double top
- measure impulse
- retracement at 0.618
- TP at -0.27 and -0.618
Double Top + 0.618 = 2618
Take profits for Shark Pattern would be those 3 blue lines, first one is at 0.618 where 0.382 is, second one is at 0.382 where 0 is and third line would be at point C where point 5 of the Ending Channel is (back to where it all started)
Good Trading.
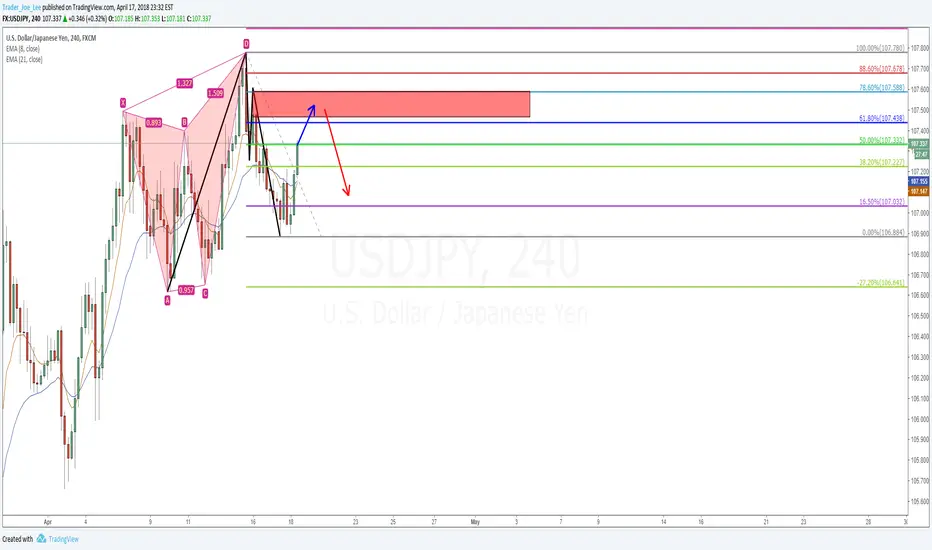
USDJPY Butterfly,2618 and supply zone short opportunityUSDJPY has a butterfly, 2618, and supply zone combination short opportunity.
It also has a tiny, imperfect bearish bat is forming.
So 2618 and bat 2 entries with same out could be a solid trade, if it can have an hourly reversal sign there,
it could be even better!
Let's see how it goes!
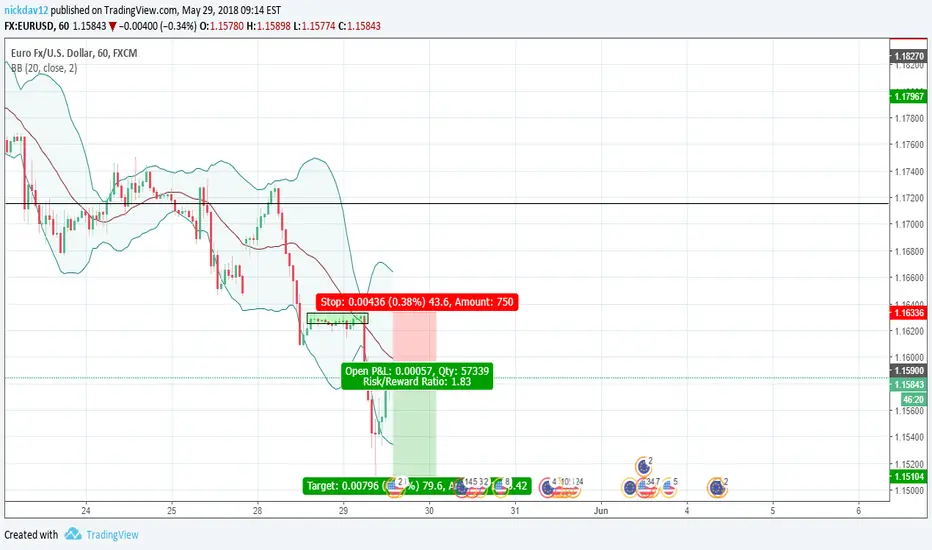
Update On My Bitcoin Prediction!We have had the breakdown out of the ascending channel, like I predicted in the last video. Now, since that has happened we have another opportunity to get involved on the breakdown using a 2618 setup.
Plus we can look to trade this down on a stop and reverse at our major level between 7440 and 7200.
So Phase 1 has played out like I predicted. Let us see if phase 2 will as well.
As always, "follow your plan."
Good luck and good trading!
