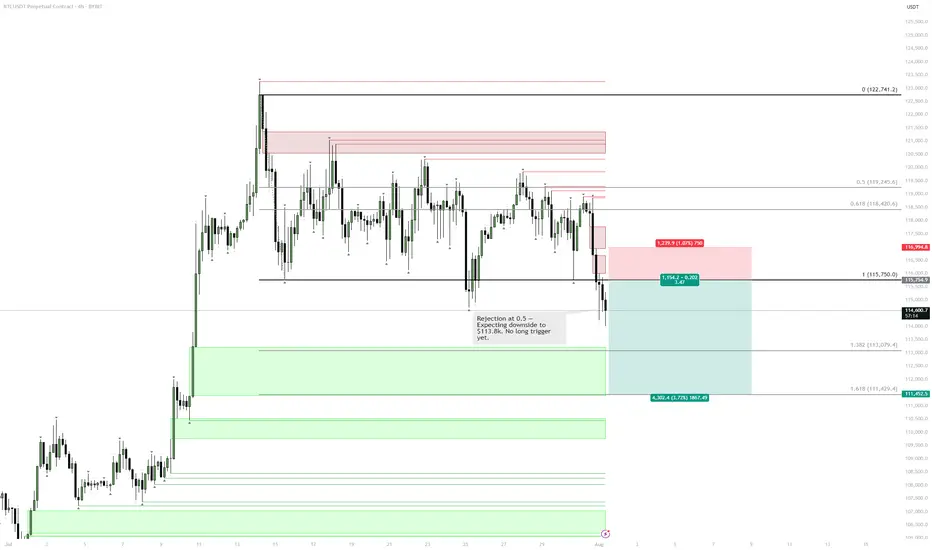
BTC | Short Bias — Targeting $113kPrice rejected perfectly off the 0.5 retracement and is now filling the previous imbalance.
Yesterday's daily close was decisively bearish, confirming downside momentum.
There’s a lack of convincing reversal signals at current levels.
Plan:
Main expectation is continued downside toward the $113k support.
Not interested in longs until price stabilizes at or below that level.
4h
PUMP | Watching for Base ConfirmationThe sharp downtrend is showing signs of exhaustion as price starts to consolidate and build a potential range.
If we see a sweep and reclaim of the range low, that would confirm the start of a new accumulation phase and signal a potential reversal.
The invalidation for any long attempt is a confirmed breakdown below the deviation or the origin of the reclaim.
Plan:
Wait for a clean sweep and reclaim of the range low to trigger a long entry.
Target resistance levels above, with stops set below the reclaim origin.
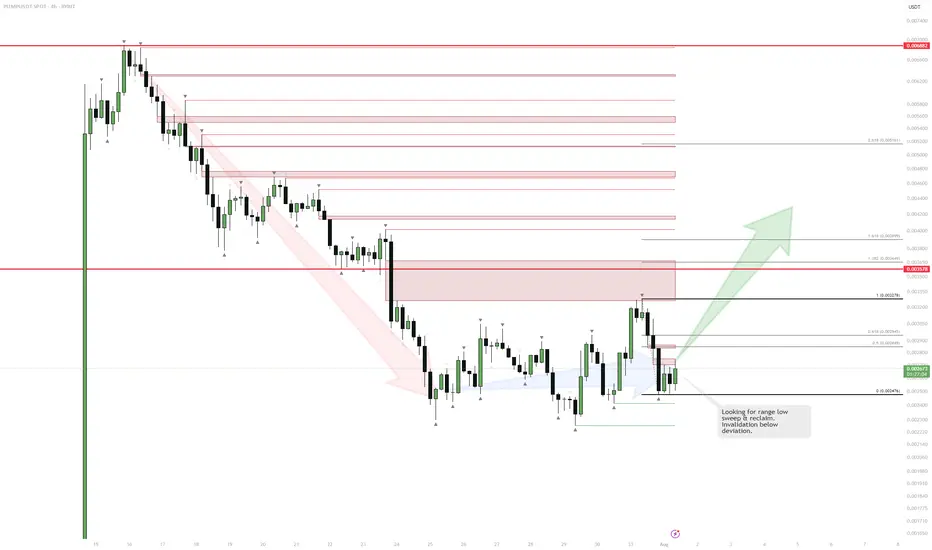
SEI | Setup: Sweep & Reclaim Scenario:Wait for a sweep of the range low (RL) into the Daily FVG (gray box).
Look for a reclaim of RL as the trigger for a long.
Reasoning:
Sweep into FVG traps late sellers and sets up liquidity for a reversal.
Reclaiming RL after the sweep signals strength and confirms a local bottom.
No need to chase entries—best R:R is after liquidity is cleared and level is retaken.

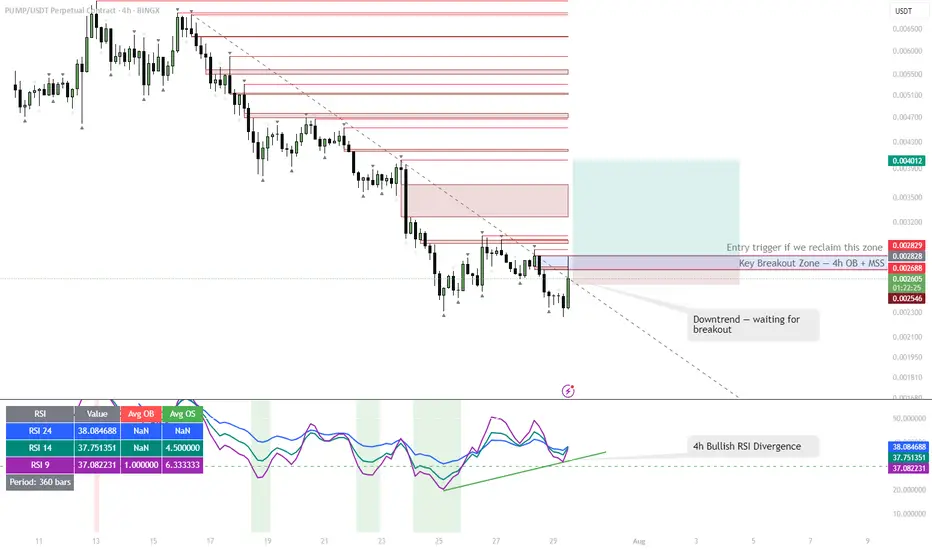
PUMP | #4h #long — Watching for Breakout Confirmation Early signals for a reversal, but not rushing in.
Some clear bullish divergence on the 4h RSI — first positive sign after an extended downtrend. Price can pop from here, but my plan is to wait for a break and hold above the 4h Order Block + MSS zone (red box) before taking any long entry.
Confirmation is key — I only want to get involved if we reclaim this area with momentum.
Scenario:
If we get a strong breakout and close above the red OB + MSS zone, that’s the first entry trigger for a potential trend reversal.
Until then — standing aside, letting the setup prove itself.
Reasoning:
Bullish RSI divergence often marks the beginning of a reversal, but without a structural breakout, the move can easily fail.
Patience pays off in these high-risk, low-liquidity coins.
HYPE | #12h #long — Major Reversal Setup from 200 EMA & DemandStarted building a position around 42.7 due to the under/over of the H4 EMA 200 and the prior consolidation high. However, there's an untapped H4 demand zone beneath — if we get a flush into that area and then reclaim 41.2 and the H4 EMA 200, I'll be adding to my position.
Invalidation:
Losing the H4 demand would be my cut-off, potentially opening the door for a sweep of the equal lows near 30.
Scenario:
— If the 200 EMA holds or we see #OneMoreLow to trap sellers and reclaim, the setup remains very bullish.
— Targets: At minimum, a stab into ATH, with the potential for a full extension up to 55.3 and beyond.
Reasoning:
This is a classic under/over setup with demand untested and a clear invalidation level. If buyers step in and reclaim key levels, expect explosive continuation.

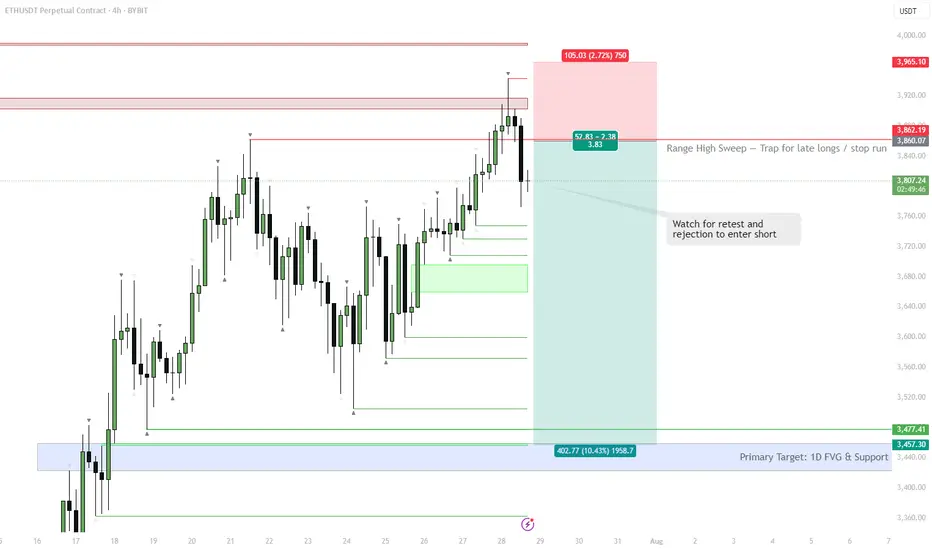
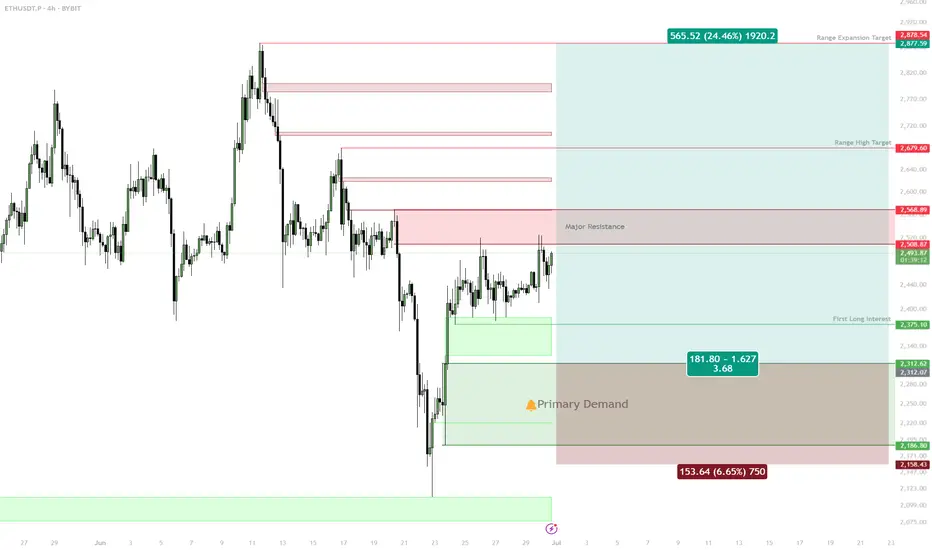
ETH | #4h #short — Range High Sweep & Short SetupScenario:
ETH swept the range high at $3,860, trapping late buyers and triggering stops. Watching for a retest of this level — if it holds as resistance and we see rejection, that’s a short trigger.
Target:
Main target is the 1D FVG at $3,457–$3,477. Possible extension: sweep of range low if selling accelerates.
Why:
Failed breakout setups are classic mean reversion triggers, especially when supported by a visible liquidity pool (FVG) below.
Plan:
Wait for a retest and rejection to confirm short. Partial TP at the FVG zone, manage risk above the sweep high.
$CRV Equal Lows ShortExtended Range
CRV has been ranging for almost week with no clear direction.
Price has respected resistance above $1.10 multiple times.
Obvious Liquidity Pool
Multiple equal lows are sitting at the $0.90 level, a textbook liquidity magnet.
Market makers are likely to target this area before any substantial move higher.
Short Entry
Short from just above $1.00, stop above the range high.
Target is a sweep of the $0.90 lows.
Next Steps
Watch for signs of absorption or reversal if price wicks below $0.90.
Consider flipping long if strong buyback or deviation forms after the liquidity sweep.
Reasoning
CRV has spent week ranging, building up an obvious set of equal lows. This is classic “liquidity sitting on a platter” for larger players. Short setups are favored while the range top holds, aiming for a stop run below $0.90. After the sweep, be open to a fast reversal or potential swing long if bulls reclaim the level.

DOGE H4 – Demand Zone Reclaim as Bullish Trigger
Price is currently testing the H4 demand zone (~0.227–0.254).
Watch for price to reclaim the demand zone and close back above 0.254.
If confirmed, expect a move up toward the red resistance cluster at 0.271–0.275.
Consolidation above this area (highlighted in blue) would be a strong signal for continuation.
Invalidation: clean breakdown and acceptance below 0.227 signals failure of demand and deeper retrace.
This setup aims to capitalize on a classic liquidity sweep and demand reclaim. Typically, after taking out the flat open and collecting late shorts/stop losses, strong buying often steps in if demand is genuine. A successful reclaim and consolidation above the previous resistance will set the stage for bullish continuation. If this zone fails to hold, the move is invalidated and lower targets come into play. Waiting for confirmation reduces the risk of a failed bounce.

CRCL – Classic Crypto IPO Fractal in Play?Initial Pump:
Price launched rapidly after listing, forming a local high.
Sideways Phase:
Market settled into a sideways consolidation, typical after the first pump.
Retrace:
A retrace toward the 0.5 Fibonacci zone (~$181.50) is developing. Typical retracement in similar "crypto stonks" ranges from 60-80%.
Accumulation in Demand Zone:
Multiple support levels are stacked between $180–$140, indicating a strong demand zone for accumulation.
True Move Potential:
If the support holds, a new bullish leg could start, targeting Fibonacci extensions ($299, $362, $444). If the support is lost, the next levels are $143 and $100.
This scenario is based on the repeating behavioral fractal seen in high-profile crypto listings: explosive initial move, multi-week consolidation, and a deep retracement before the real trend emerges. Current price is entering the key demand area, which aligns with previous market structure seen on token launches. The risk/reward for new longs becomes attractive here if buyers defend the zone. However, invalidation is clear if price breaks below $140.

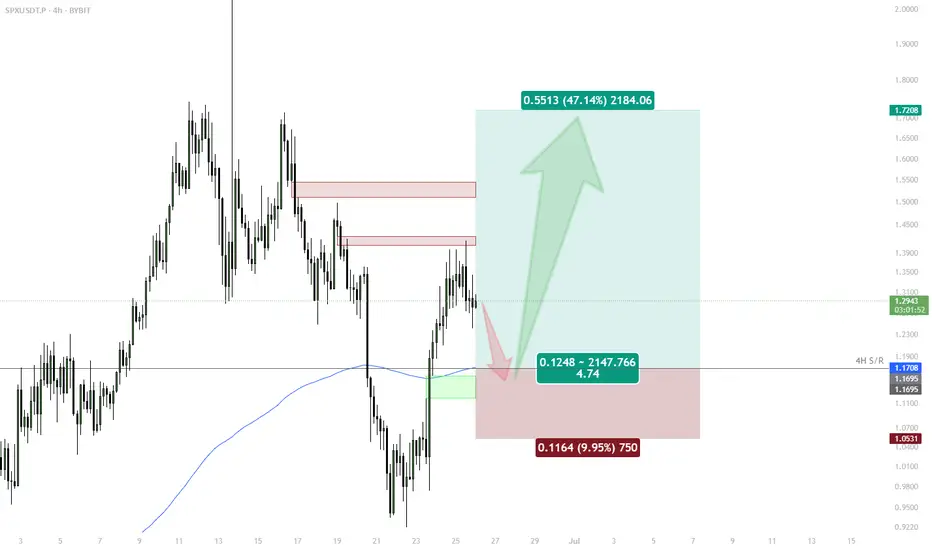
SPX6900 Bidding 4H S/R + FVG Zone — Looking for New Highs✅ 4H S/R + FVG provides strong support and bid opportunity
✅ 200EMA adds further confluence to the setup
✅ Invalidation = 1h closes/consolidates below $1.14
Active Setup:
Long Entry: In $1.08–$1.14 zone (confirmation: reclaim or bullish trigger in area)
Target: $1.72 (new highs/ATH)
Manual Invalidation: Cut if 1h candles close and consolidate below $1.14
🔔 Triggers & Confirmations:
Only bid on strong reaction or reversal in FVG/S/R zone
Exit if 1h PA settles below $1.14 (red pattern bars area)
🚨 Risk Warning:
Aggressive longs — keep risk tight, cut quickly if invalidated
USDT.D — 1W FVG Test & RSI Bull Div | Caution for RiskUSDT Dominance is testing a major 1W FVG support area while developing bullish divergences on the 4H RSI. Although a short-term bounce and market correction are likely, the overall bullish trend in BTC means a sharp reversal is not guaranteed. Risk management is a priority here — no high-risk positions until the RSI resets and market context is clearer.
1W FVG support + 4H RSI bull div
Bounce likely = correction on risk assets
RSI needs reset to 50 before reassessing
If lost — risk-off, possible slice down
Reasoning: Support + momentum, but trend is bullish — not risking gains here

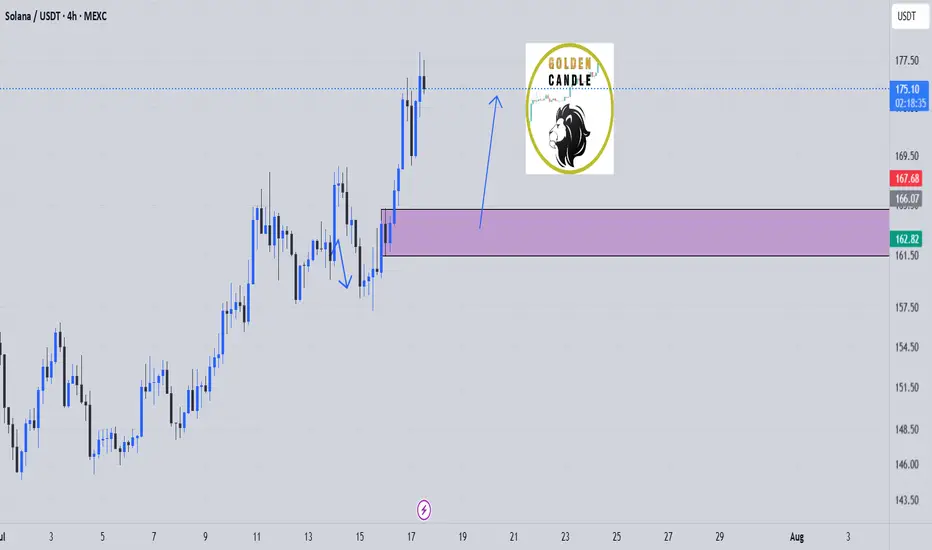
sol buy midterm"🌟 Welcome to Golden Candle! 🌟
We're a team of 📈 passionate traders 📉 who love sharing our 🔍 technical analysis insights 🔎 with the TradingView community. 🌎
Our goal is to provide 💡 valuable perspectives 💡 on market trends and patterns, but 🚫 please note that our analyses are not intended as buy or sell recommendations. 🚫
Instead, they reflect our own 💭 personal attitudes and thoughts. 💭
Follow along and 📚 learn 📚 from our analyses! 📊💡"
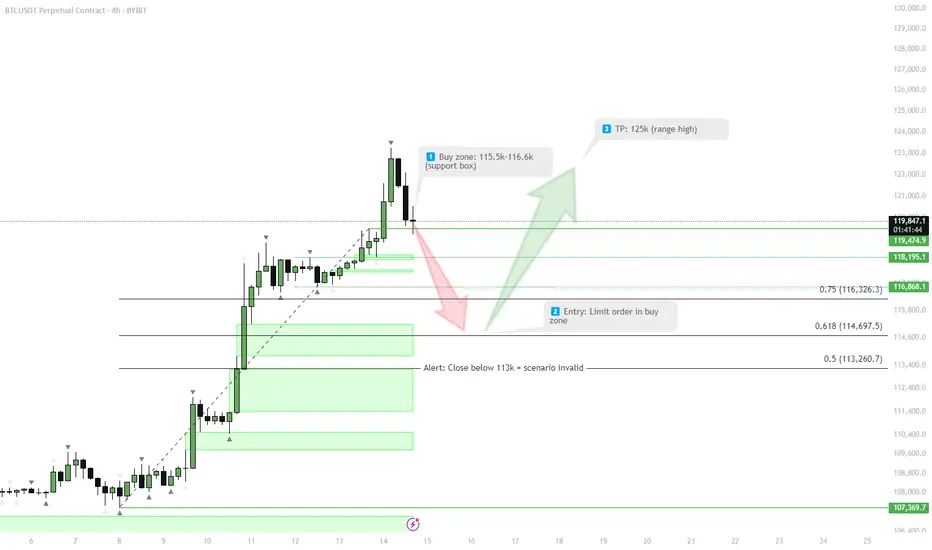
BTC — Long from Support Box (#4h) | BULLISH1. Buy: Limit order 115.5k–116.6k
2. Alert: If close < 113k, scenario invalid
3. Target: 125k
ETH: Deep Retrace or Shallow? Two Key Long Zones into Next Week✅ Two main long setups: Equal Lows @ $2,376, Untapped Demand $2,250–$2,314
✅ Best R/R from deeper demand zone, but will watch both levels
✅ Targets: $2,738 (range high), ~$3,000 (expansion)
✅ Shallow retrace may limit upside to a new local high, not full expansion
Setup 1:
Buy trigger on sweep and reclaim of $2,376 (equal lows)
Target: $2,508, then $2,738
Setup 2:
Preferred: Buy trigger into $2,250–$2,314 untapped demand
Target: $2,738, $3,000
Risk:
Wait for reaction/confirmation at both zones; no FOMO in between
🚨 Risk Warning:
If no strong bounce from these levels, stand aside — don't force the setup.
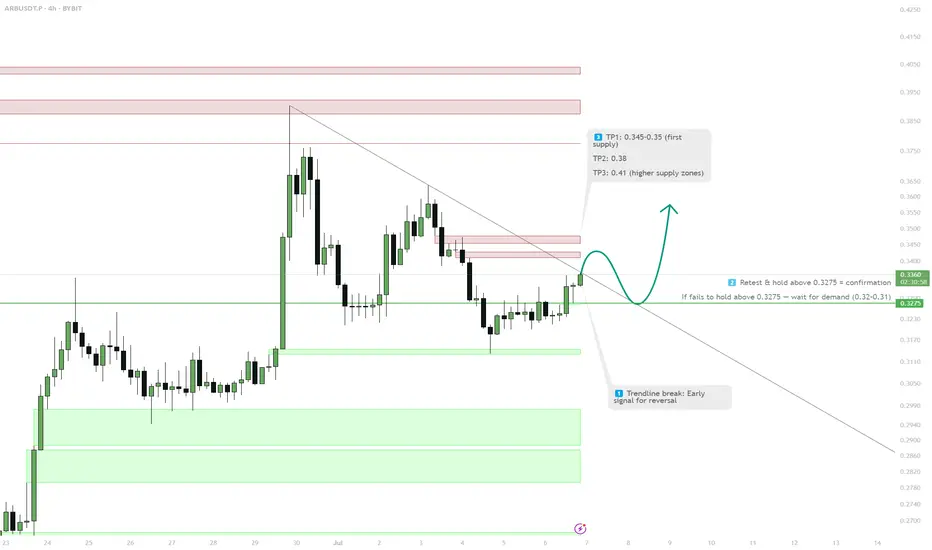
ARB — 4H Supply Break & Trend Reversal1. Watch for confirmed trendline break
2. Retest & hold above 0.3275 for entry
3. TP1: 0.345–0.35 / TP2: 0.38 / TP3: 0.41
4. If fails, watch demand zones below
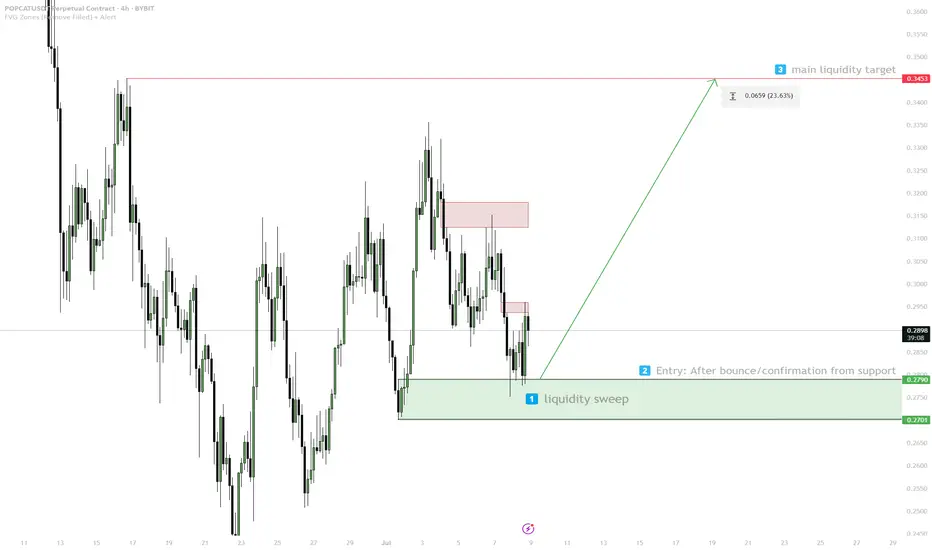
POPCAT — Liquidity Target Play1. Watch for sweep/liquidity grab in 0.270–0.279
2. Enter on confirmed bounce
3. Target: 0.3453 (liquidity zone)
4. Stop: below 0.270 — invalid
LQTY — 4H 200MA Hold & Squeeze Trigger1. Price holds above 4H 200MA
2. Flip blue box (1.21) to support for entry
3. Entry: Confirmed hold above blue box
4. Squeeze target: Quick move higher
5. Stop: Below 4H 200MA

BTC — Major Resistance & Long TP Zone1. TP longs in red resistance zone (110k–111k)
2. Watch for rejection: possible short setup on bearish reaction
3. Key support at 105k — monitor for bounce
4. If price holds above red zone, scenario invalid — look for breakout

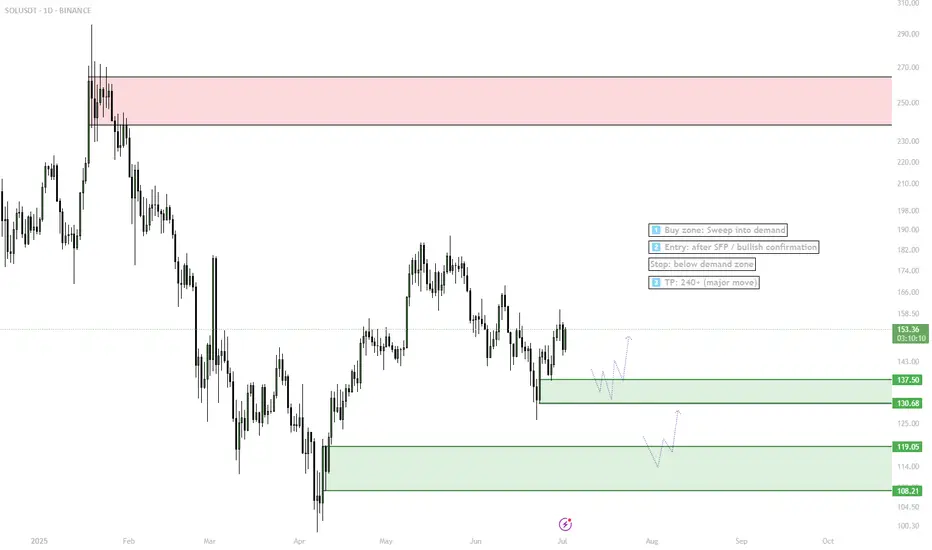
SOL — Liquidity Sweep & Demand Play1. Wait for price to sweep into demand
2. Enter long on SFP or strong bounce
3. Target: 240+
4. Stop: below demand zone
If no sweep, stay flat or wait for clear reclaim
XRP — Liquidity Sweep & Range Play1. Wait for sweep into demand (2.07–1.95)
2. Enter long on SFP/bullish confirmation
3. Target: 2.33 (equal highs)
4. Stop: below demand zone
5. If stop triggered — next watch 1.77 for triple tap setup

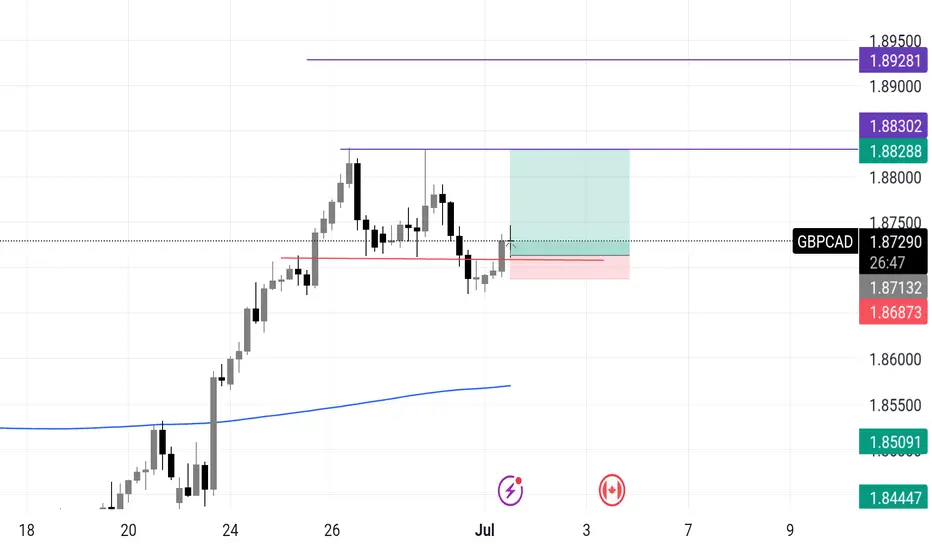
GBPCAD 4H long setupGBPCAD 4H Spring 💡 | Smart Money Accumulation Before Expansion
Watching a textbook Wyckoff spring unfold here on the 4H.
After a multi-day rally, price retraced, and liquidity built up just above 1.8713. What happened next?
🔻 We got a liquidity sweep, tagging below 1.8687 — then a sharp rejection wick back into the range. That’s the spring.
🧠 Why this matters:
Liquidity below the range is now likely cleared.
Smart money triggered stops and may now flip positioning.
Buyer momentum reclaiming the broken zone signals strength returning.
🎯 My Play:
Long entry after reclaim above 1.8713
Stop below 1.8687 wick low
Targeting 1.8828 > 1.8830 as TP1
Extended TP at 1.8928 — aligning with prior supply zone
⚠️ Invalidation if we lose 1.8685 with momentum and no absorption.
This is not a chase trade — it’s a calculated entry after weak hands were shaken out. Let the market prove strength, then ride the reversion.
📈 If this spring holds, I expect continuation toward prior highs.
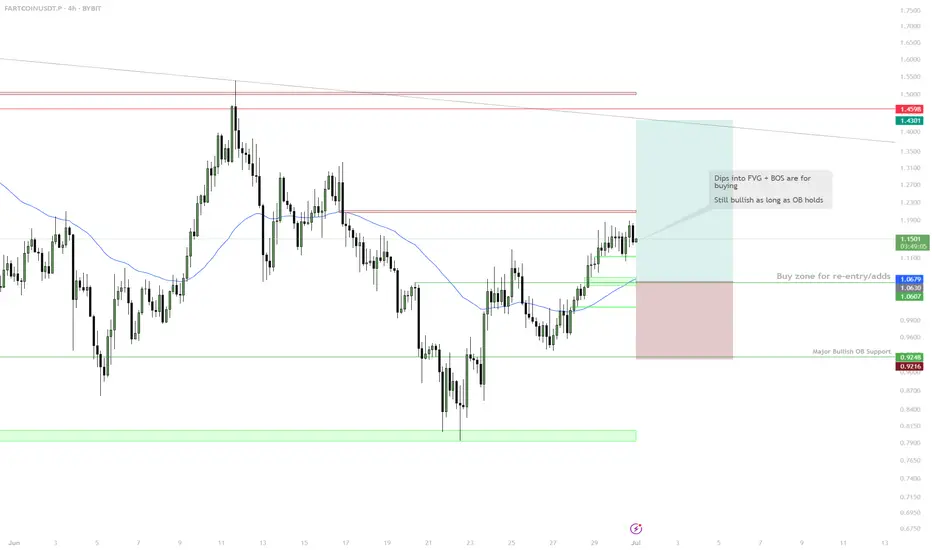
FARTCOIN — Perfect Swing Long Up 27%, Dips Are for BuyingDips into $1.06–1.09 (1H FVG + BOS) are for buying.
Still bullish while above $0.92–0.93 OB. Eyeing $1.43 next.
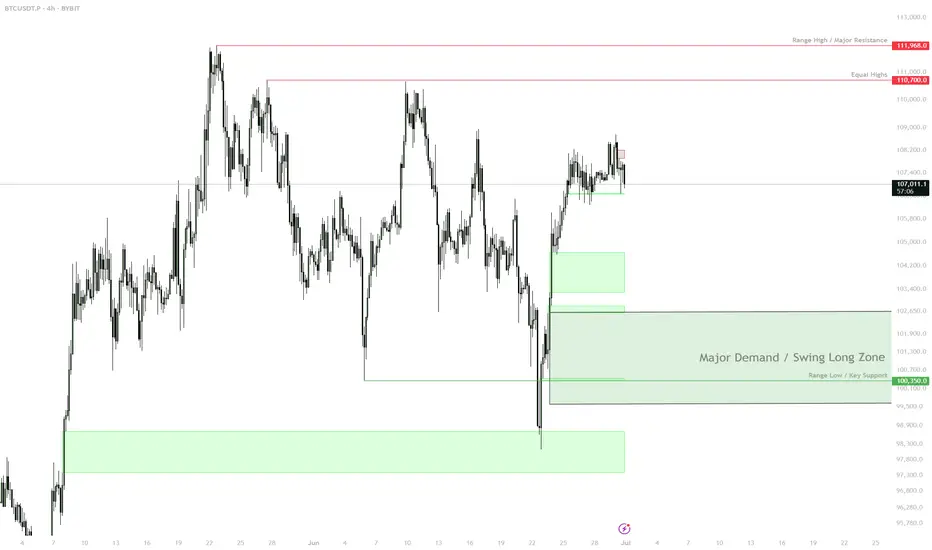
BTC — ATH or Lower High? Patience for the Next SwingBINANCE:BTCUSDT | 4h
Patience here — waiting for the next high-probability swing.
Major levels to watch: $111,990 (range high), $108,950 (weekly), $100,300–103,000 (demand).
Next move: ATH attempt or another lower high? Will act when the reaction sets up.