CHZUSDT - LONG - ADAM & EVE Hello Hello Traders .
By looking at the charts we can see an Adam & Eve pattern. A lesser known bullish reversal pattern is Adam & Eve double bottom. The pattern usually followed with a large up swing or trend higher after its second eve bottom. In this particular case the Adam & Eve pattern can also be considered as an ascending triangle pattern.
For the entry of this trade you should wait until the price breaks out on the upside of the pattern. After this happened the target could be targeted.
All further details are shown on the chart.
Make big profits.
Good Luck .
4h

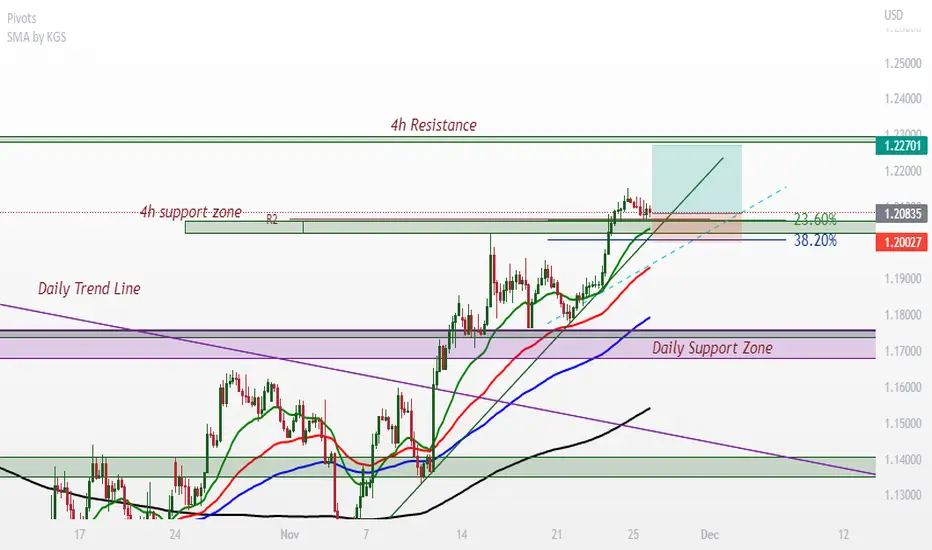
GBPUSD long position Hello
There might be a long position on GBPUSD as the policy makers at central bank agreed to slow down the pace of interest hike so fundamentally we could have a bullish signal. other upside signals are:
2. Daily TL breakout
3. R2 (Traditional) Monthly Pivot breakout
4. 4h Trend Line
5. EMA 20,50,100 & SMA 200 upside
Please consider risk riward ratio and do not forget to set a stop loss
Bitcoin - (BTC-USD) Bitcoin is currently traded at 16550. And made an arrow shape in a 4H chart frame. if the price breaks the arrow shape, then resistance is at 18250 and support is 14250, which is already shown in the graph.

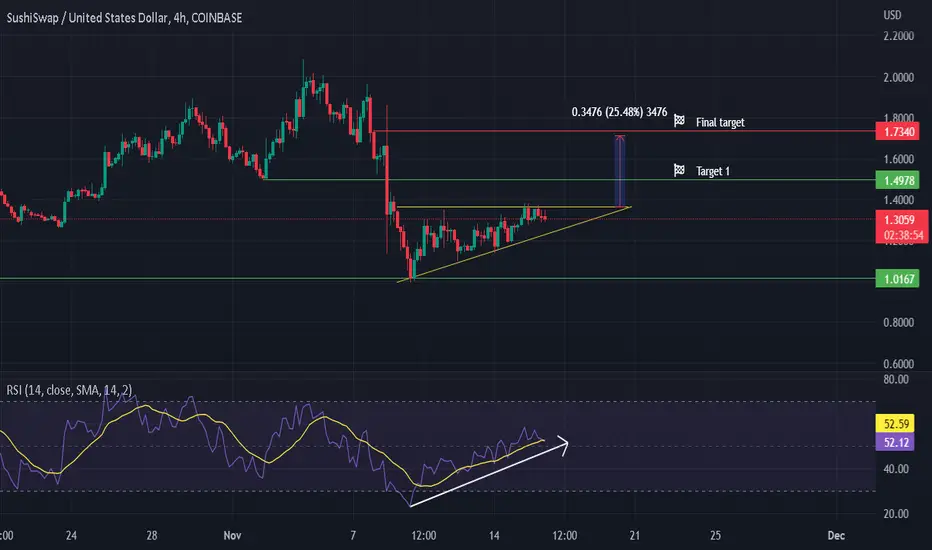
SUSHIUSD - Long - Ascending triangleOn the chart we can see a ascending triangle appearing. An ascending triangle is a bullish pattern. Enter the trade once the price breaks out to the upside.
Beside the pattern we can see that the RSI is picking up more and more momentum. So the pattern combined with the increasing momentum it´s likely that the price will go up.
All the details are shown on the chart.
Goodluck!
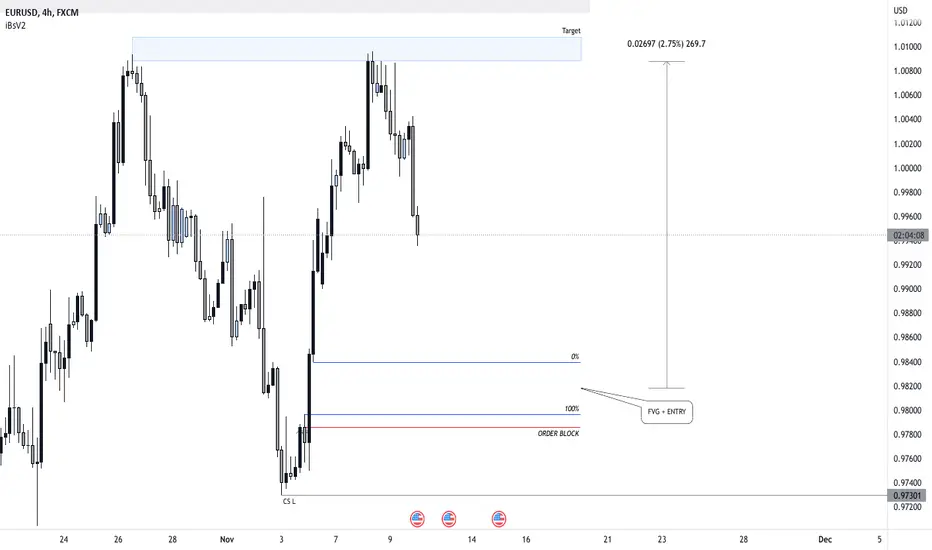
EUR/USD LONGFair Value Gap (FVG) ON 4h
This trade is only active after fvg is tapped
reasons for believing its buying once reaches buy zone is because theres a Fair Value Gap coupled with a Order Block in the buy zone and this analysis goes hand n hand with my daily analysis for this pair
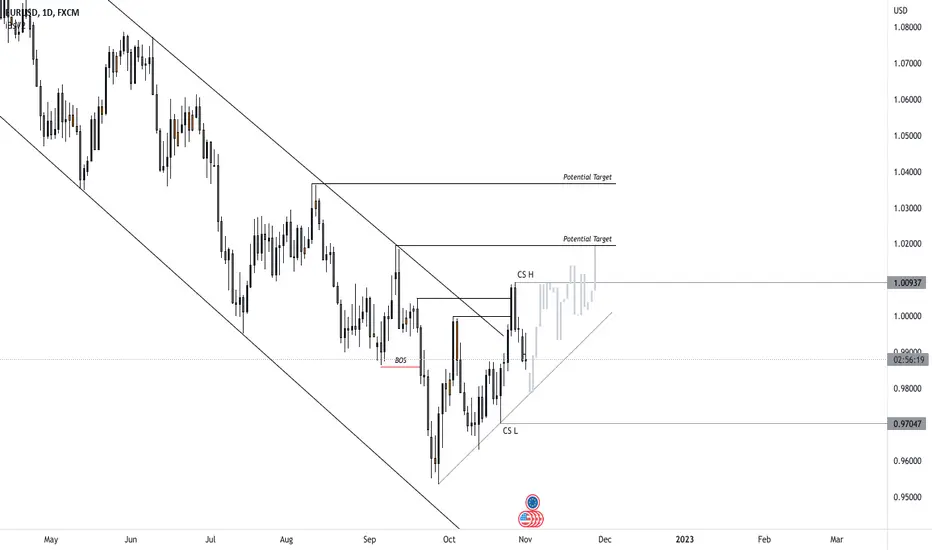
EUR/USD LONGPrice broke trend we could see buys in 0.98000 ~ 0.98200 area
price took out 2 highs indicating diminished sell momentum
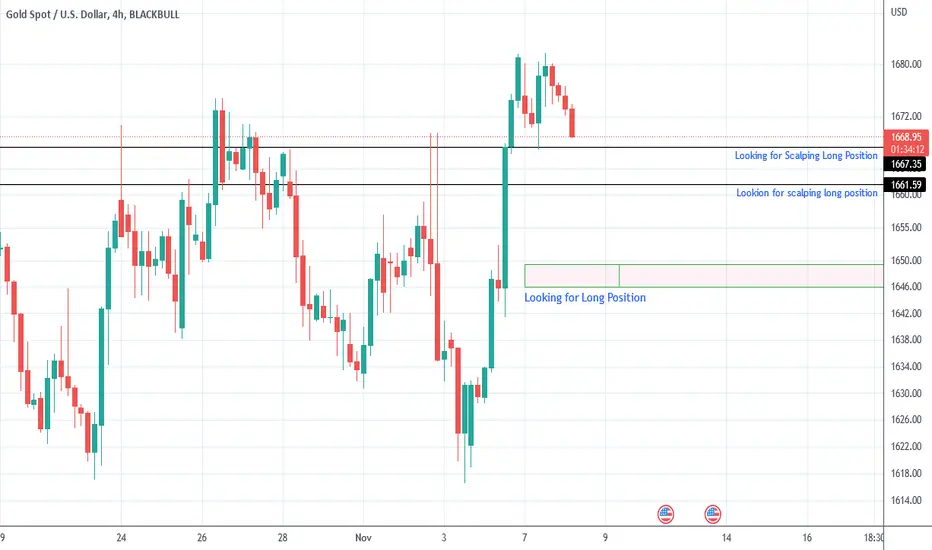
XAUUSD Long Positions-4H Timeframe analysis4H timeframe analysis on GOLD (XAUUSD).
Have fun with trading, despite of SL or TP hit....
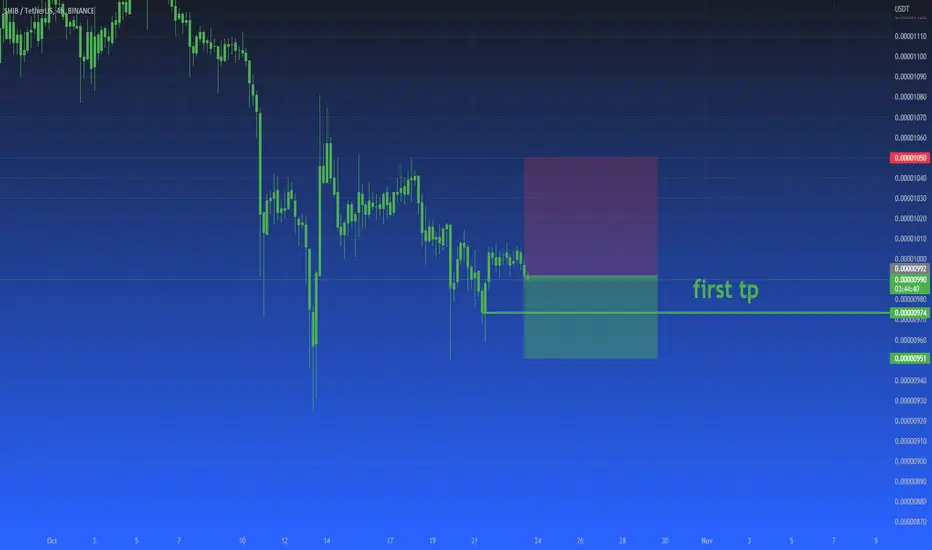
SHIBUSDT Analysis - 23 OctoberSHIBUSDT Analysis - 23 October
Hello Guys, Today's Analysis is on the SHIBUSDT Symbol in a 4H Time frame, I Hope it Will be Useful for You, Don't Forget to Like, Follow, Comment
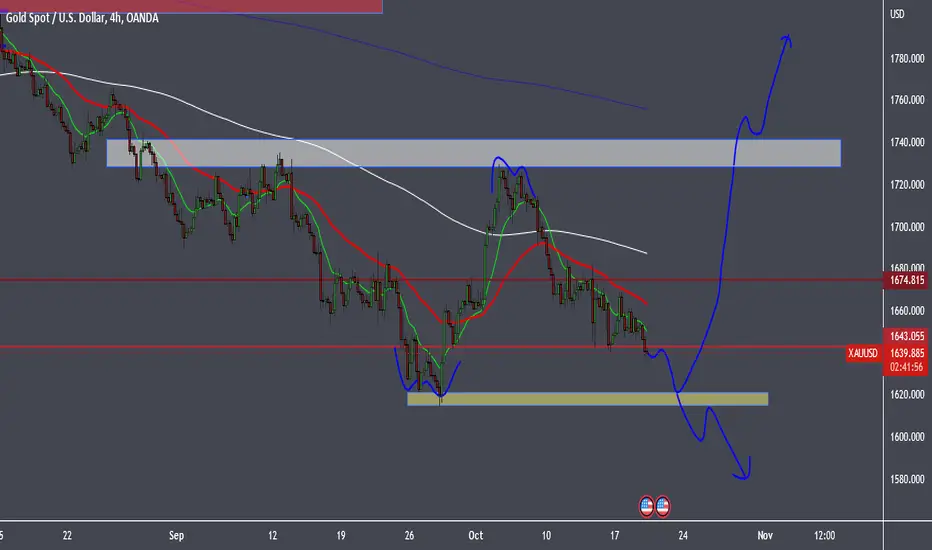
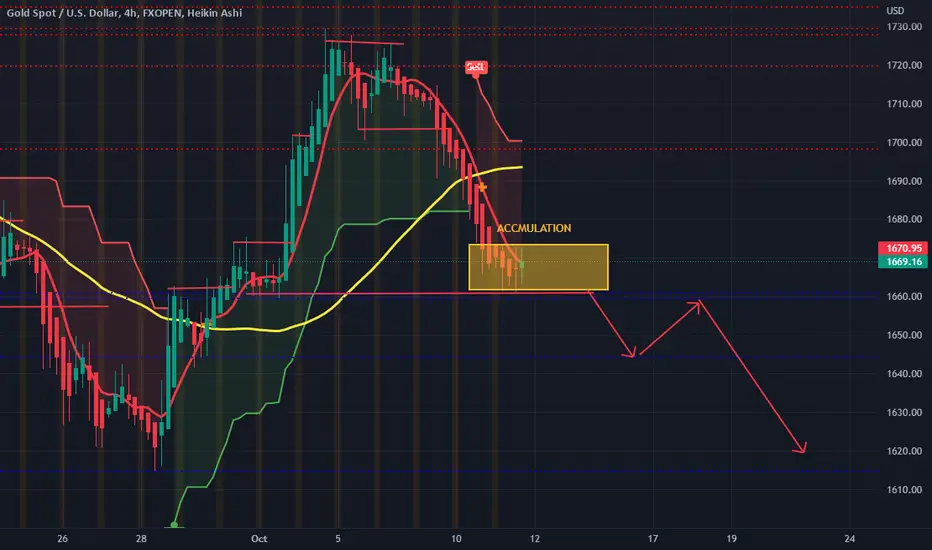
Gold 4hr analysisGold formed a double top on 6 October, if you go further back in my charts you will see I highlighting that. As I have said, the market moves in 3 levels most times. And on the 4hr it has made 3 intraday levels down from last week.
If you look at the yellow box support, the price should go back down to test this structure. This is a very dangerous zone, because on the daily chart, we have made 3 levels down from the second leg of a massive double top on the 19th of April , and as the picture paints, I predict a very strong double bottom formation on the daily as well as on the 4hr. So I am in a small sell now, down to that zone, and then I will wait for confirmation of the buy from the zone, and buy it back up
So flip into the daily, give it a look and let me know if you see what I see.
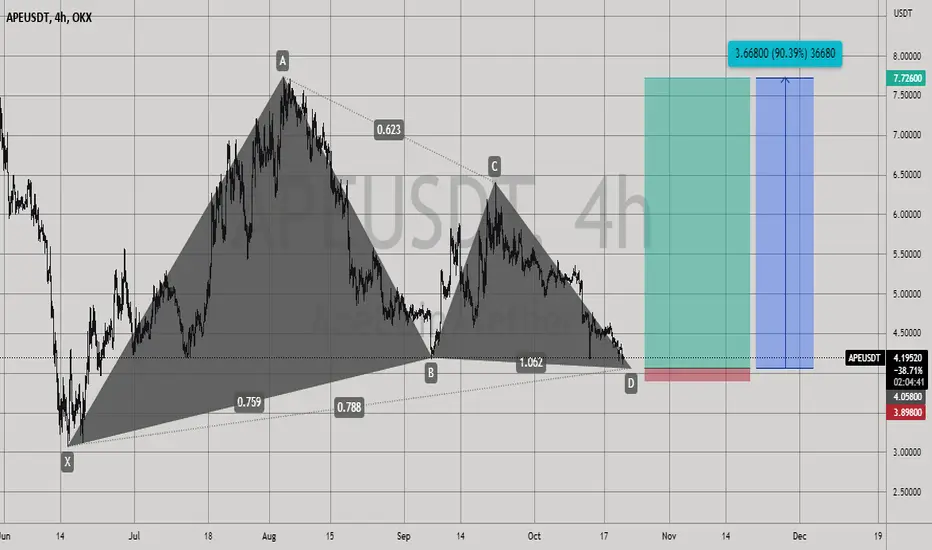
APEUSDT Long IdeaAPEUSDT Swing Long Idea
Potential PNL upon completion is +90% multiply your leverage
Remember to entry with confirmation
GBPJPY Midweek reversal? If price closes under this zonre4hr chart on GJ shows a potential double top, with a smaller structure double top on the first leg, price has now broken the support of 168.580, and is currently testing it as a resistance. Smaller time frames show shapes for a sell, so I anticipate a sell on this market. I will wait for the 4hr stick to end so I can make a better decision on the pair. My earlier analysis of GJ is invalid.
Patience

Bitcoin: what can you expect in October?Let's think about it... After all, the fate and further vector of the BTC price will be crucial for the entire crypto market. BTC is stuck in a sideways trend between $18,500 - $20,400. Now we are in the middle of these prices... Locally, the price is in an upward channel, but more globally, the price is still in a bearish cycle... Sooner or later, there will be an exit from one or the other channel. I think, the decision will appear closer to November.
Therefore, just be careful when the price approaches the junctions of these channels. In the meantime, you can carefully trade both ways... This is what many people are successfully doing now. There is enough liquidity in this zone, the takeaway is guaranteed!
This is just the beginning...

ATOM Pull-back Reversal - SHORT SETUPHello, I am Tommy.
If this is your first time coming to my idea, thank you very much for taking the time to pay attention to it. My opinions are all subjective and personal. It might be right, or wrong, but there is one thing I can guarantee you will never go wrong - always set the SL for each entry before setting the TP for it.
ATOM Price Chart is building a pull-back reversal, create a price compression with the MA21 line. It's a short setup.
Entry ~ 11.7

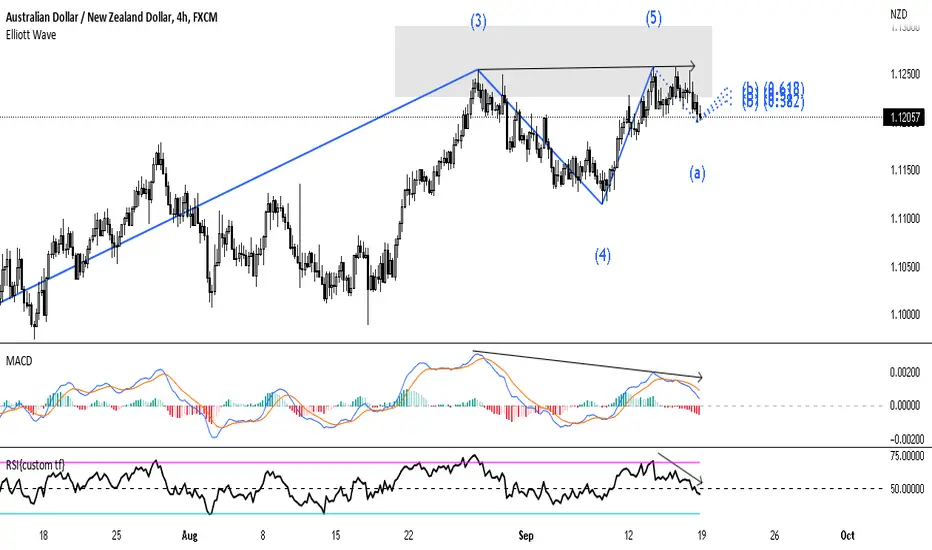
AUDNZD | 4Hr | Elliott WaveAUDNZD is ready for correction. It is indicated by 3 factors:
(1) Elliott wave tool by tv - it shows us the 5th wave is completed on 4hr tf, and wave A (correction) has started.
(2) 4hr BOS - Break Of Structure on 4hr shows potential change in character of the current trend.
(3) Divergence in MACD + RSI on top of that RSI is below 50 which shows bearishness and MACD below 0 too.
im short!
Note: Analysis is only for education purpose.
ALL THE BEST!
ETH/USDT NEW SETUP 💰Hello 🌝
It is expected that the price will advance to the level of 1655 dollars to 1684 dollars and then the targets of 1629 dollars and 1695 dollars will react. This is my new trading setup, what do you think?
Thanks.⚡

LUNC 4HLUNC well supported on 0.0003 and bought well
So RSI has broken the trend line and as long as main chart do it .
Good luck .

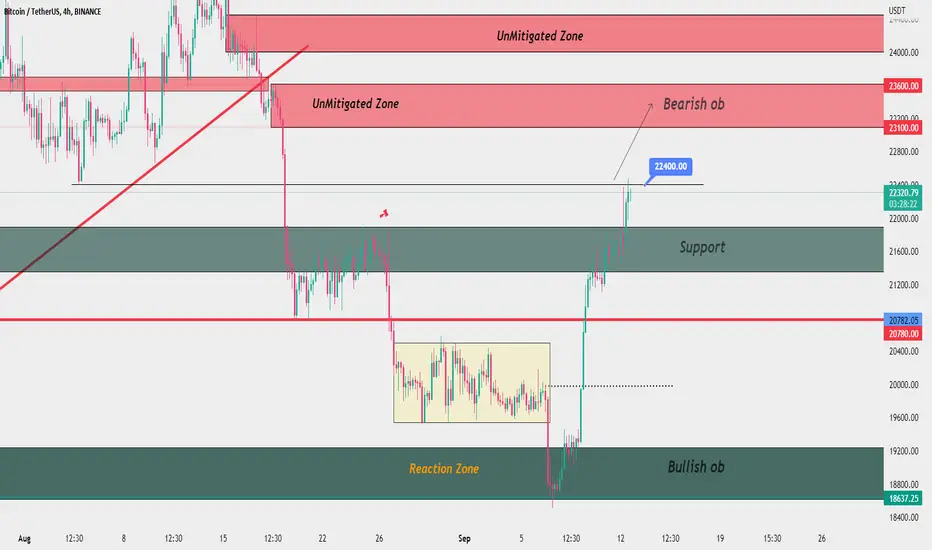
BTC/USDT In 4 Hour 🚀Hello Trading View members🖐
The price hitting the resistance range of $21,700 reduced the strength of the upward trend of this cryptocurrency, and we expected the sellers to react, but the price increased and hit the level of $22,400.
Currently, the price has touched the level of $22,400, and in fact, according to the current trend, if Bitcoin manages to stabilize above $22,400, the price is expected to advance to the range of $23,100 and $23,600.
Otherwise, if it fails to stabilize, we expect a change in the nature of the price.
Arztoday Team ⚜🌹
ATOM/USDT Analysis Update 4H 🌝Hello Guys ⚜
As we said in the 4-hour analysis of this cryptocurrency in the previous post, with the breaking of the ceiling of the red channel, the price has grown to the resistance area of $17 (the second target), which has caused the price to react and return from this resistance area, and the RSI indicator It also shows the saturation of the price in the red circle.
If this cryptocurrency stabilizes above the resistance area of $17, it has the ability to reach the targets of $19 and $20, otherwise, with the loss of the support level of $15, it is expected that the price will fall to the levels of $14 and $13.
If you like our ideas. Support us by liking and commenting, so that we can get more energy from you dear ones 🙏
Arztoday🌟

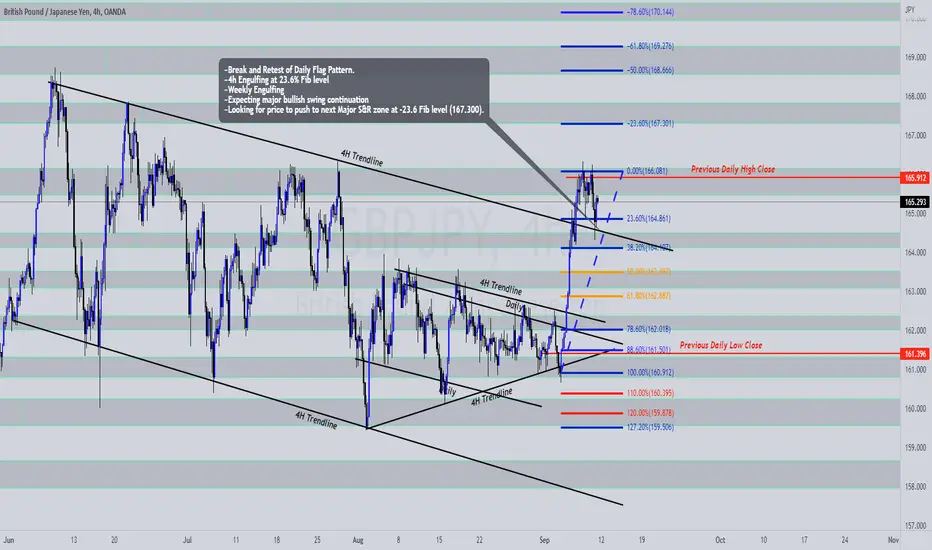
GBPJPY Break & Retest Swing~Break and Retest of Daily Flag Pattern.
~4h Engulfing at 23.6% Fib level
~Weekly Engulfing
~Expecting major bullish swing continuation
~Looking for price to push to next Major S&R zone at -23.6 Fib level (167.300).
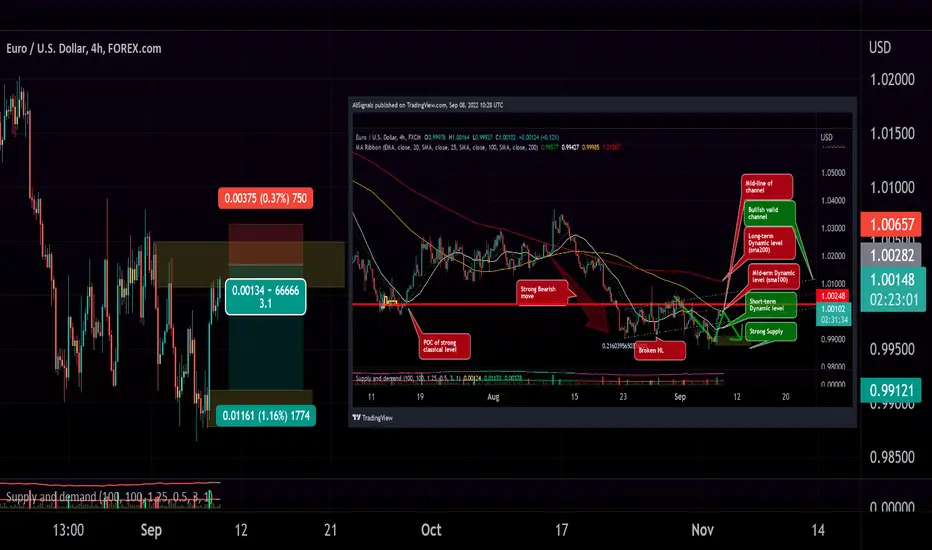
EURUSD Still bearishThere are still strong levels and I think regarding bias there is a good chance to short EURUSD from the supply to the demand!
Bears: 6
Bulls: 3
*** supply level in the chart is actually the demand
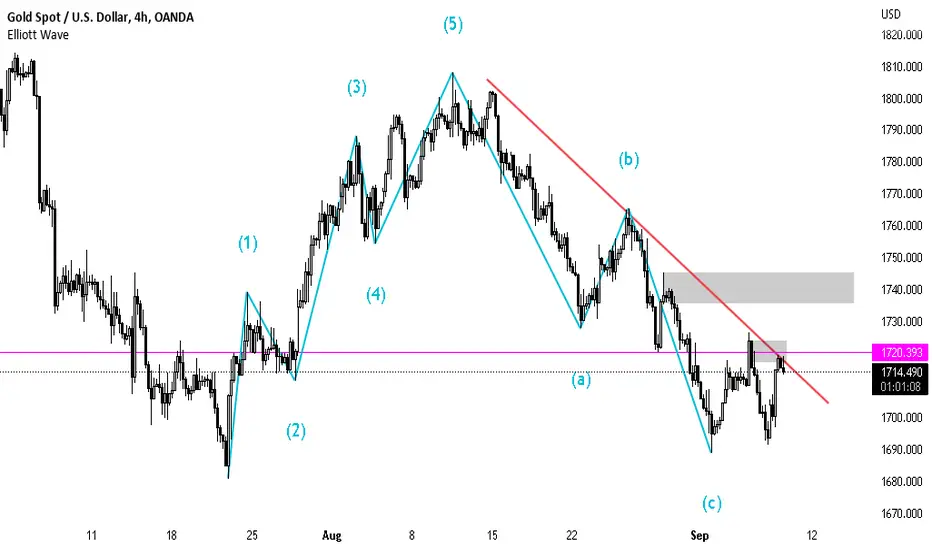
XAUUSD | 4Hr | Elliott Wavebase on tv's elliott wave tool xauusd (Gold) is currently down and on further analysis it looks gold will be down more.
I'm Short!
All the Best!
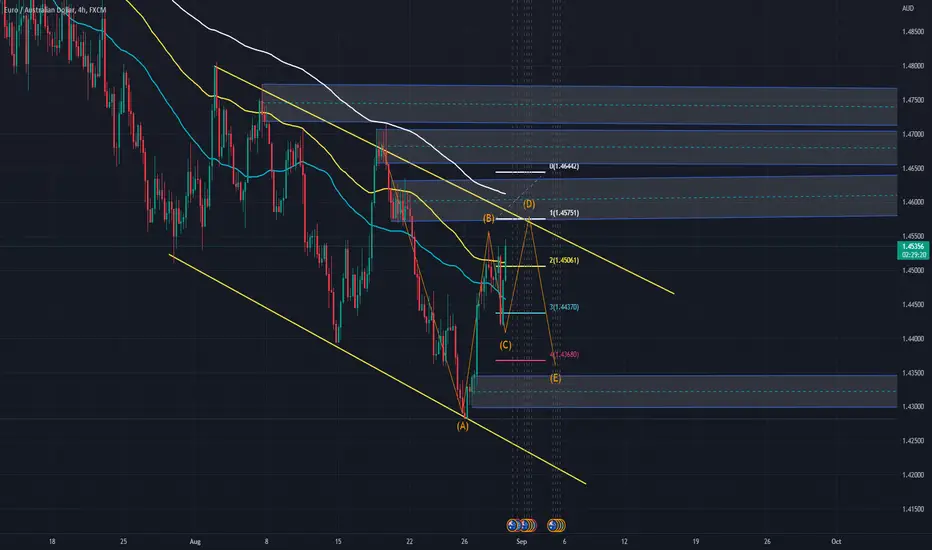
EURAUD 4H= down tren
- supply confluence with ema 200
- ABCDE pattern
- I expect bearish move from 1.45751 and the stop los 1.46442
= TP1 1.45061
- TP 2 1.44370
- TP 3 1.43680