ADA/USDT 4HOUR 😉✔Hello Dear Trading view Members
ADA is currently near the weekly support area of 0.4030. Our team's analysis is to target 0.48 to not miss this weekly support. Closing the green candlestick above the 0.48 level will continue the uptrend.
If you like ideas provided by our team you can show us your support by liking and commenting.
Arztoday team 😉🌹
4h

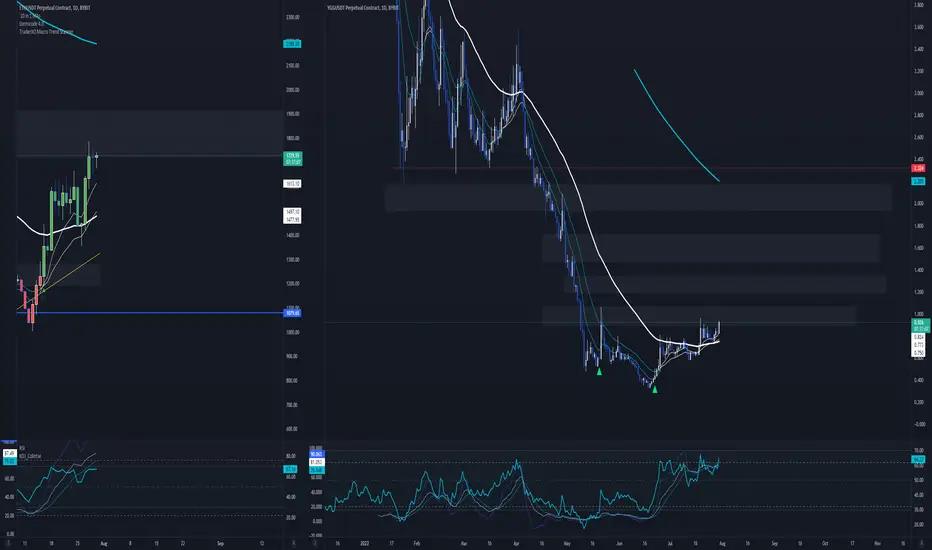
Analysis ETH/USDT Before Merge Update 😊🎉🎈Hello Dear Trading view Members
As you can see, Ethereum reacted to its resistance level of $1700 again, as a result of selling pressure from sellers, and the price easily broke its red trendline downwards. Ethereum has reached its $1500 support area, which is currently indicated by the red candle recently formed in the 4H time frame, showing the targets of 1400,1385,1380. We are still waiting for the close of the monthly candle, if the close of the monthly candle closes below 1270, the next targets are 1230,1200. 🎗
If you like ideas provided by our team you can show us your support by liking and commenting.
Arztoday team 😉🌹

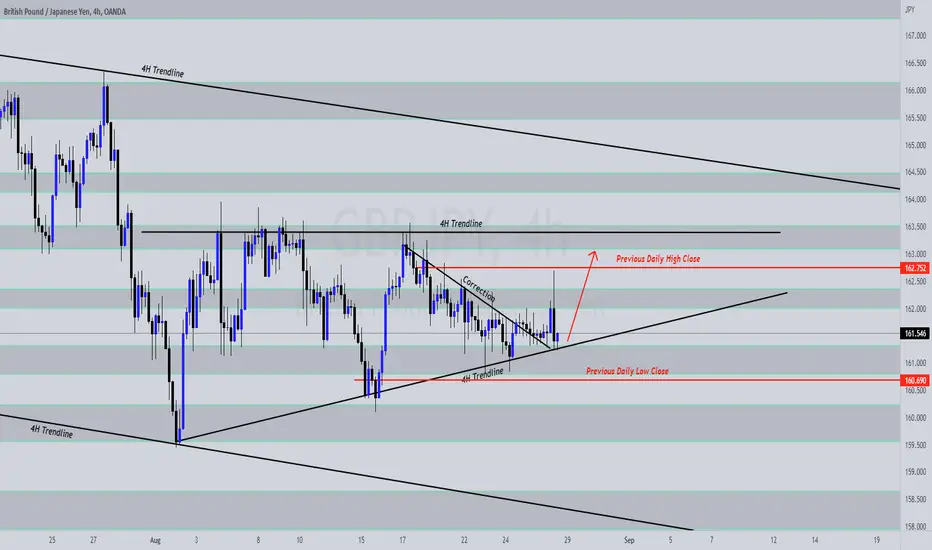
GBPJPY August 28thDaily Flag Pattern
4H Trendline markup for Daily Flag Pattern
4H Ascending Triangle being created after touching bottom of Flag Pattern
4H Bearish Correction
1H Bullish Engulfing on bottom of Ascending Triangle trendline & 4H Zone.
30m double bottom (reversal pattern).
Daily exhaustion at 4H Zone.

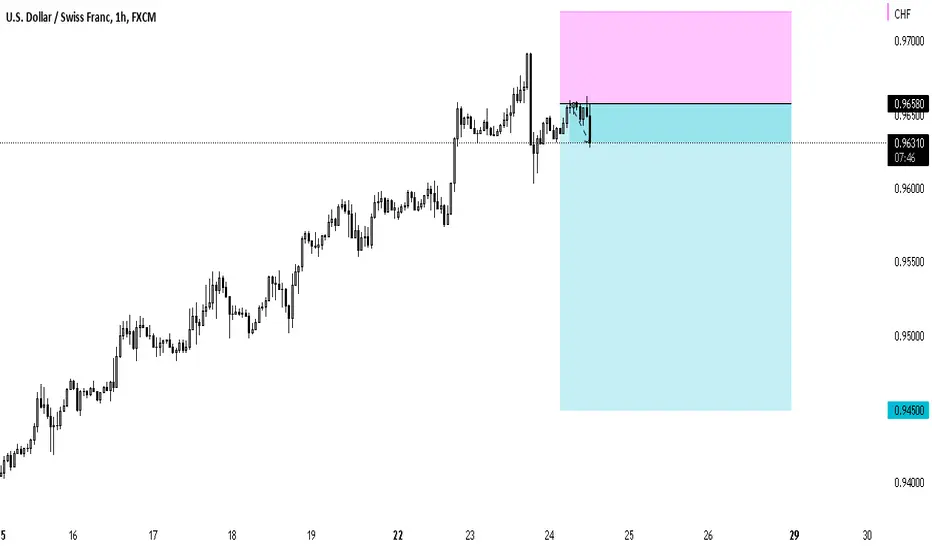
USDCHF - SELLSELL USDCHF
setup based on my knowledge/analysis
I'M NOT RESPOSIBLE FOR ANY FINANCIAL LOSSES! THIS SETUP IS ONLY FOR EDUCATIONAL PURPOSE.
All The Best!
BTC 4h Trade - W pattern + MACD crossThe MACD at 4h has been working excellently in the range shown in the chart. With it once agian crossing paired with a potential W pattern, that will make for a decent shortish term trade. Risky so don't throw all your money in.
Open the trade once the W pattern breaks out.

Ethereum 4 Hour Chart Head and Shoulders Pattern FormingEthereum 4 Hour Chart Head and Shoulders Pattern Forming. What do you think about this? BINANCE:ETHUSDT

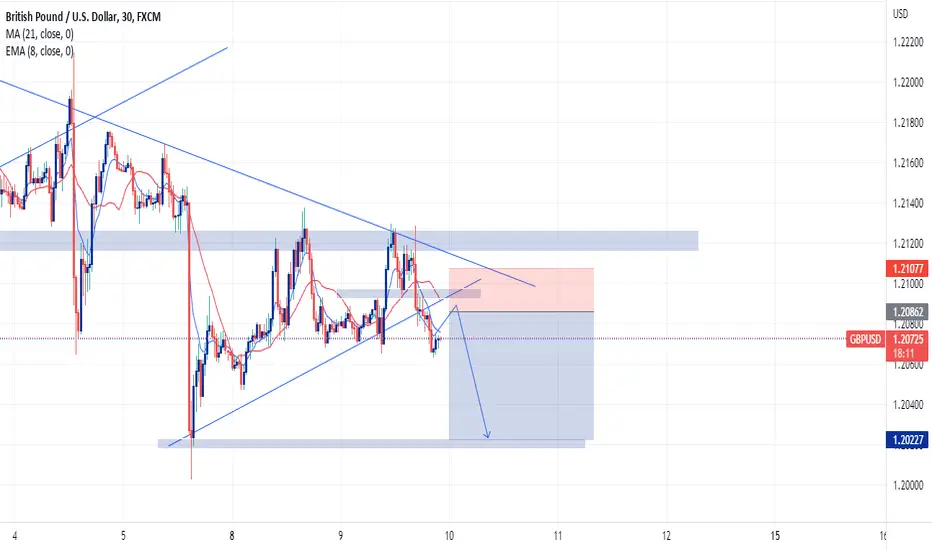
GBPUSD ShortFX:GBPUSD
GBPUSD broke countertrend structure, waiting for a pullback/retest to go short on GBPUSD
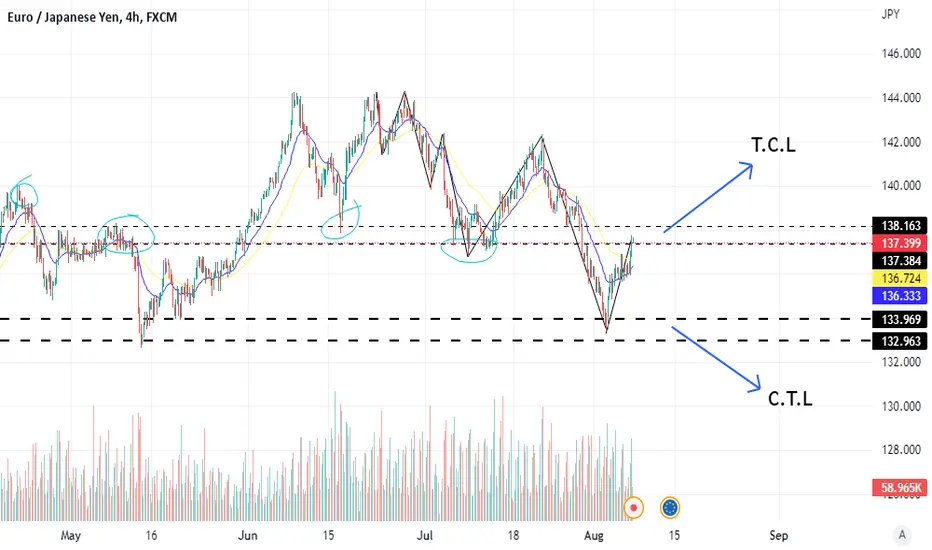
Eur/Jpy Short Eur/Jpy is on its Trend Continuation level. Waiting for a chart pattern(Double top or RSI divergence in 1h) or candlestick bearish signal than going short.
What you guys think???
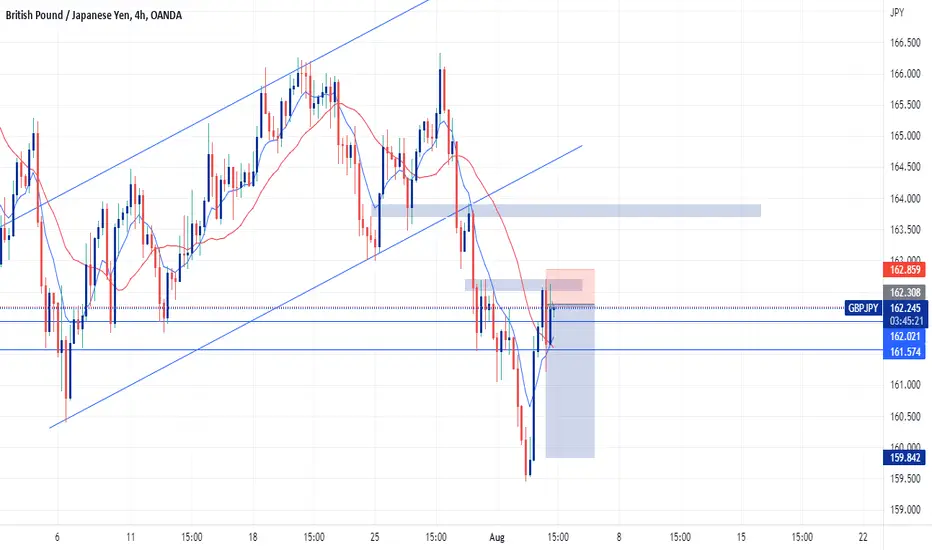
GBPJPY shortOANDA:GBPJPY
GBPJPY broke bullish structure on the 4H timeframe and made a retest with a bearish engulfing candle as a confirmation to enter
YGG levels lottery.honestly guys.. just pick ur own TPs.
red line means dead line.
YGG got potencial... pretty nice ammount of %s to collect.
as long as ETH stays above 1700, we r good to go with rest of the altcoins.
entry now or 0.92
my SL is at 0.80
lev 2x
P.S. i wish i'd place my SL a little bit lower.
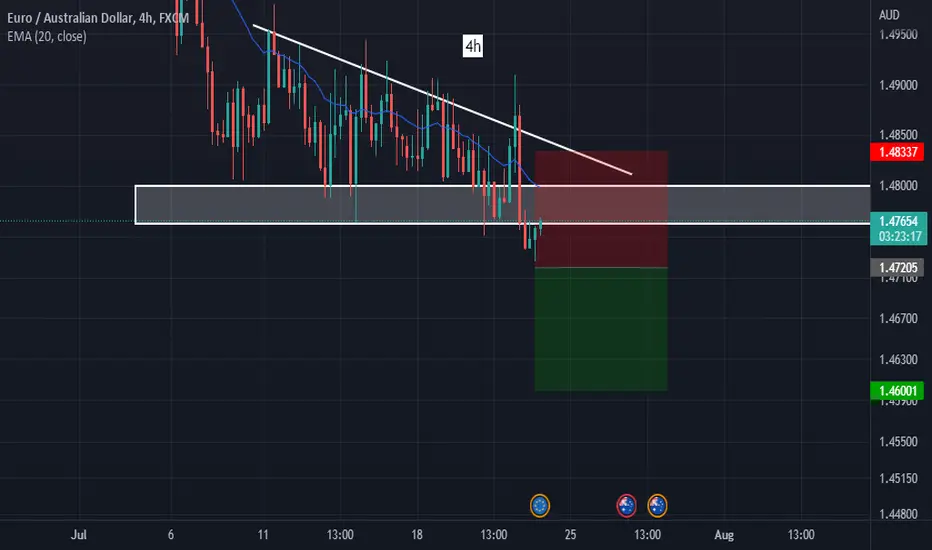
EURAUD risk 2%Have a nice day everyone,
today I am attaching my trade entry on ea where I want to short.
Entry is set to buy stop, risk maximum 2%.
Jindrich
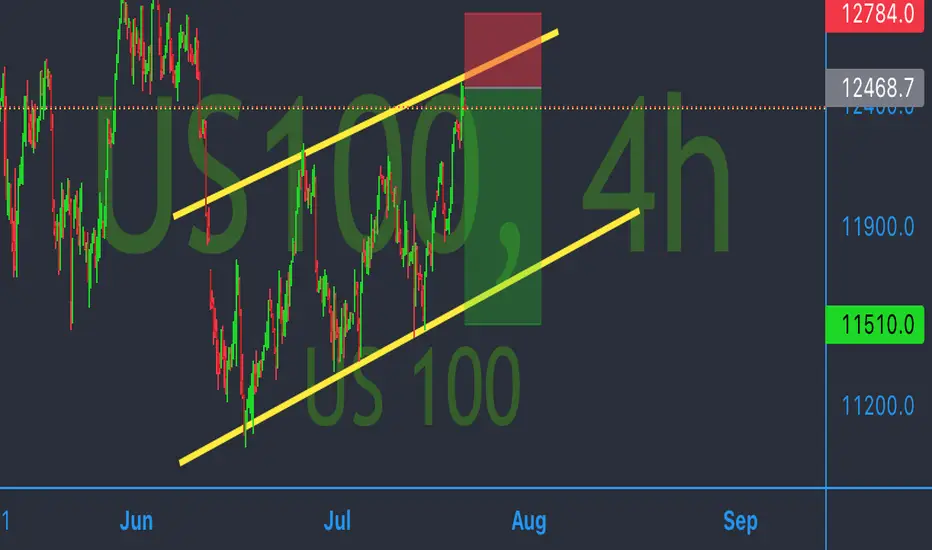
Possible Short US100Consider shorting Us100 around upper bound resistance line wait for bearish candle stick patter to confirm entry.
EURJPY next move daily move 20-7-2022All in Chart
Only sell Positions are recommended ..
Target to sell in 139
I dint have positions I closed them all i will wait for the correction then short again

EURCAD Textbook pullbackEurCad is creeping up for the textbook trend, and the pullback being right at the .618 fib retracement.
Don't take the trade the second it reaches the level (if it retraces), look for rejection and certain candlestick patterns.
In the long future, I would like for price to pull all the way down to the 0 level (bottom) of the fib, and make a double bottom and look for longs, after the 7 years of being bullish.


ETH-USD The current price of ethereum is 1220.and i am analyze the 4h chart in which current resistance is 1275-1280,if breaks then 1st,2nd,3rd targets are mentions in chart. And support is 1008 if support is break then go to 880 1st ,then go 650-700.

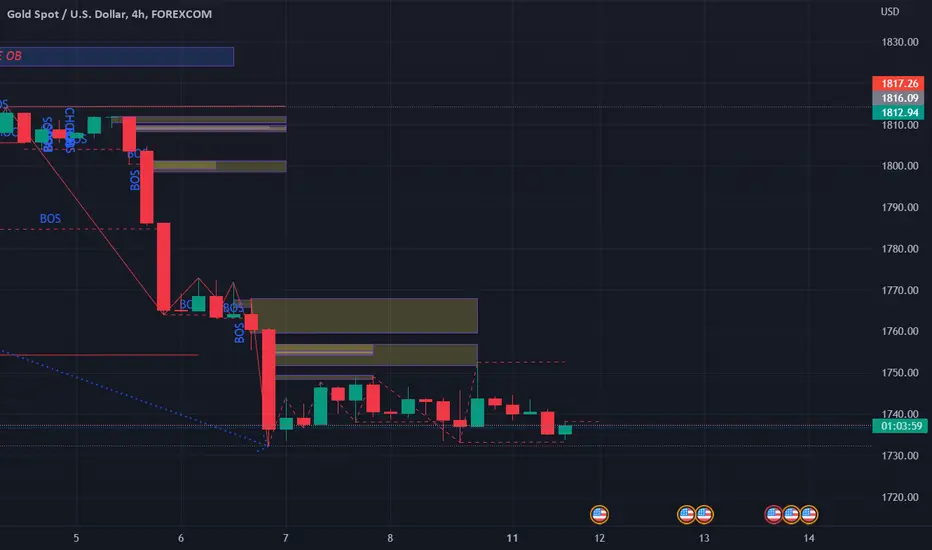
4H TREND4H is still bearish, and I think it's going to be in a long run. No sign of stopping as 15M is still going down. Today, I expect a little retracement from the 15M timeframe and push all the way down. If 1767.95 is broken, it confirms bullish.
1INCH LONG IDEAThis setup contain only my idea.This is not financal advice.
our entry level is 0.6665

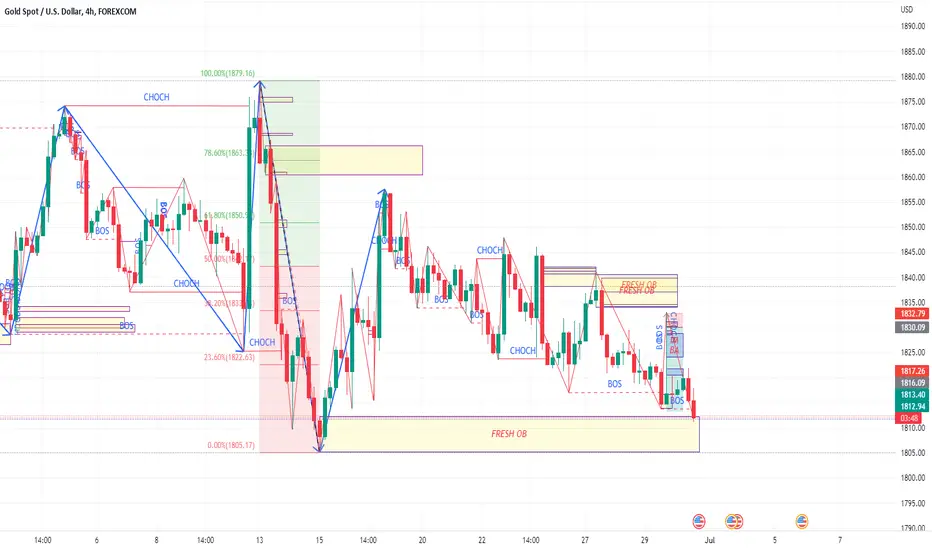
4H BEARISH CONTINUATIONThe 4H is still in the bearish territory as the current price still was not able to break the 1804.96 4H lower low range. There are a lot of fresh order blocks formed and hopefully, we can take advantage of the scenario.
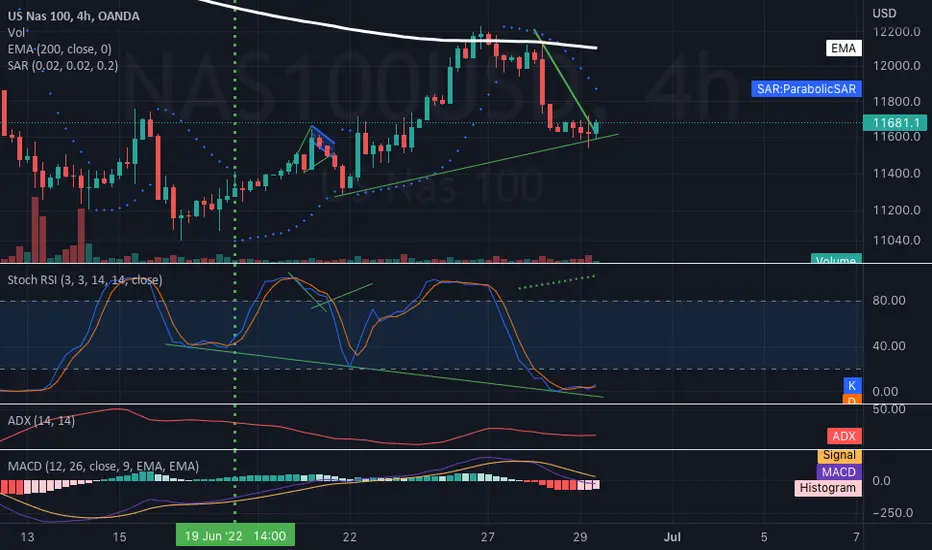
Nas100 4h Hidden Bullish DivergenceIf you thought the trading was terrible wait till you see this chart.
God damn, everything has to either a. not trade at all or b. monitored
every 3 seconds. The 4hr divergences trumps the 1hr. And weekly the daily etc.
Sorry about this whipsaw but it's the nature of the beast.