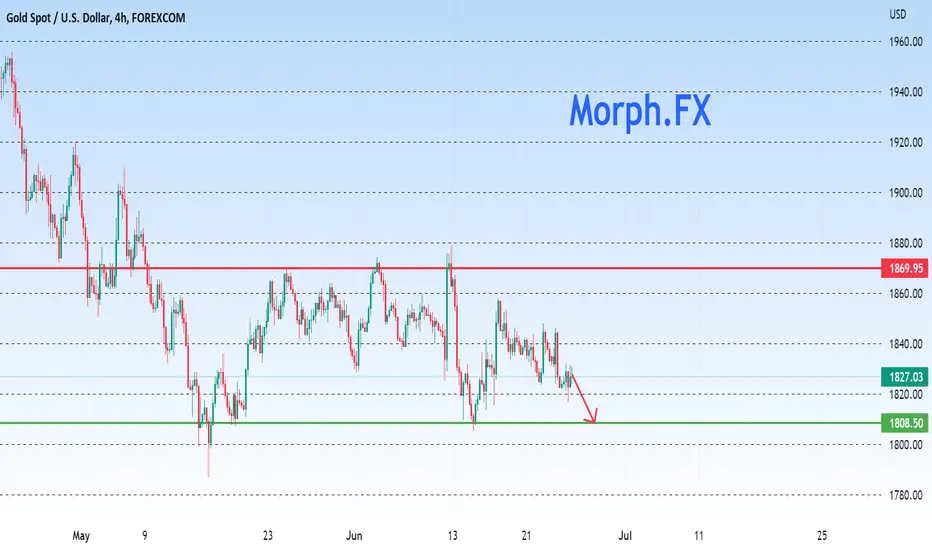
XAU/USD 4H TIMEFRAME #XAUUSD
THE Price can potentially retest the 1808 pivot point before shooting upwards, this is for the bigger timeframe however.... 1h timeframe had signalled bullishness.... what are your thoughts????
4h
#BLZ/USDT FREE TRADE SETUP !!As we can see from the above-mentioned chart that BLZ/USDT was trading inside the falling wedge pattern and broke above.
Currently, it's moving downside to retest the upper trend line which is the buying zone for the BLZ/USDT to earn a good amount of profit in upcoming hours.
So we can take entry at the
#BLZ/USDT LONG TRADE SETUP
ENTEY:-CMP and $0.09885
TARGET:-40%
STOP LOSS:-$0.09100
WITH LAVERAGE:-10x to 20x
Remember:-This is not a piece of financial advice. All investment made by me is at my own risk and I am held responsible for my own profit and losses. So, do your own research before investing in this trade.
Thanks for your time, we hope our work is good for you, and you are satisfied, we wish you a good day and big profits.
THANK YOU.

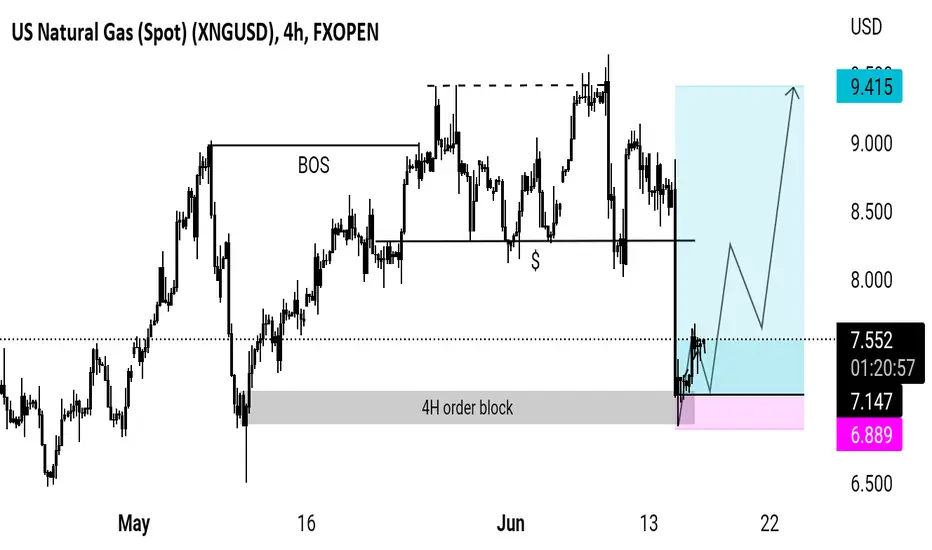
XNGUSD TAPPED 4H ORDER-BLOCK 📈🚀XNGUSD tapped in 4h order block, trade has been opened, prices are likely to move up!
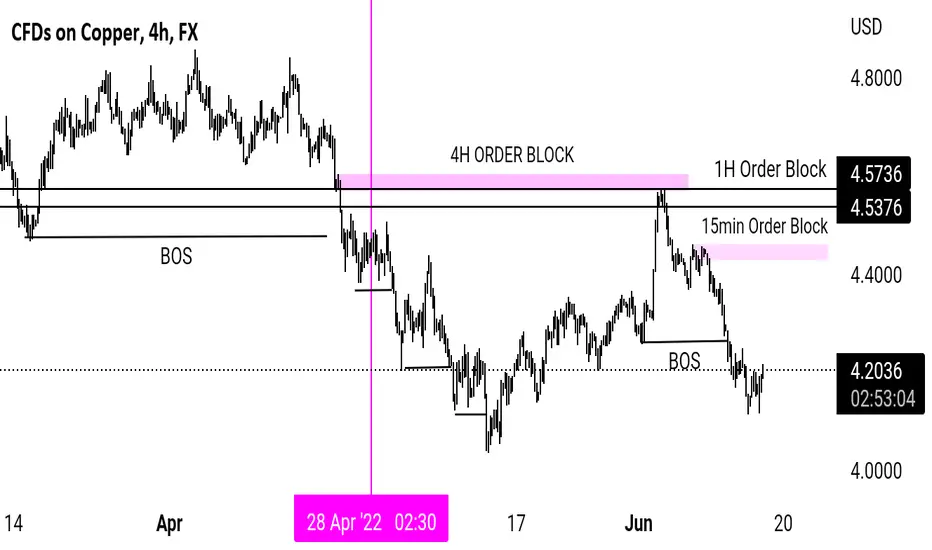
COPPER BEARISH ORDER BLOCK (intraday)copper is getting ready for another down-move. check out this analysis and prepare yourself!
•Break of Structure on daily
•4H order block
•1H order block
•15min order block
•NOTE• BEFORE ENTERING ANALYSE THE MARKET YOURSELF!
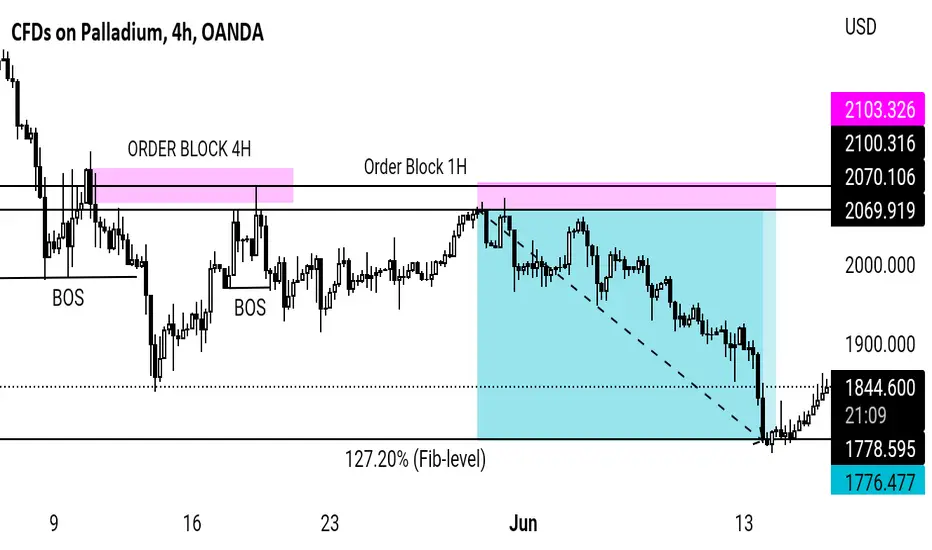
Palladium is bearish lately ⛷️Bearish Order Blocks Tutorial.
Bearish order block played out well with 1:8 RISK:REWARD!
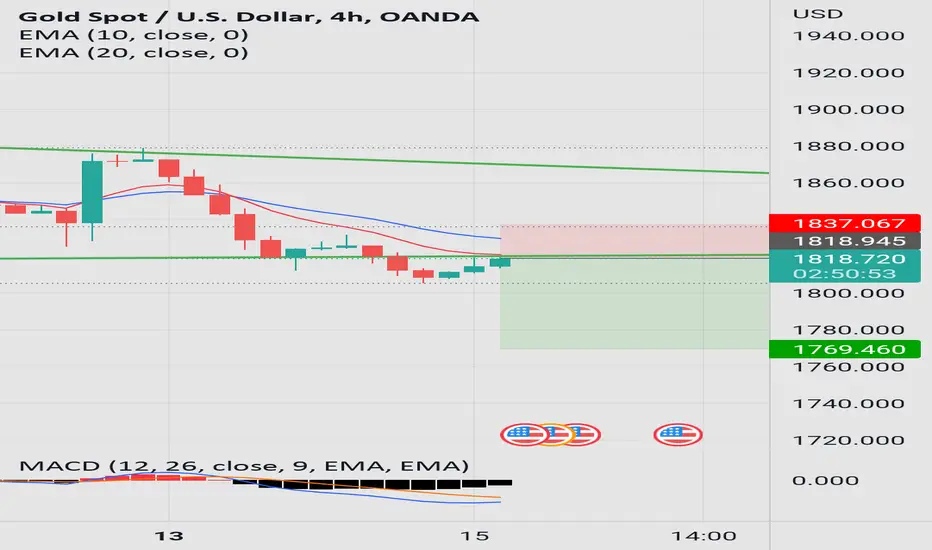
Break of a Tradeline on XAUUSDSo I want to go easy on this (technical-wise)
On a Daily, we have a tradeline
On the 4H, MACD is below the Zero
And the price is below the MAs and currently is touching the 10 MA
Stop at 1837.06
To at 1769.46
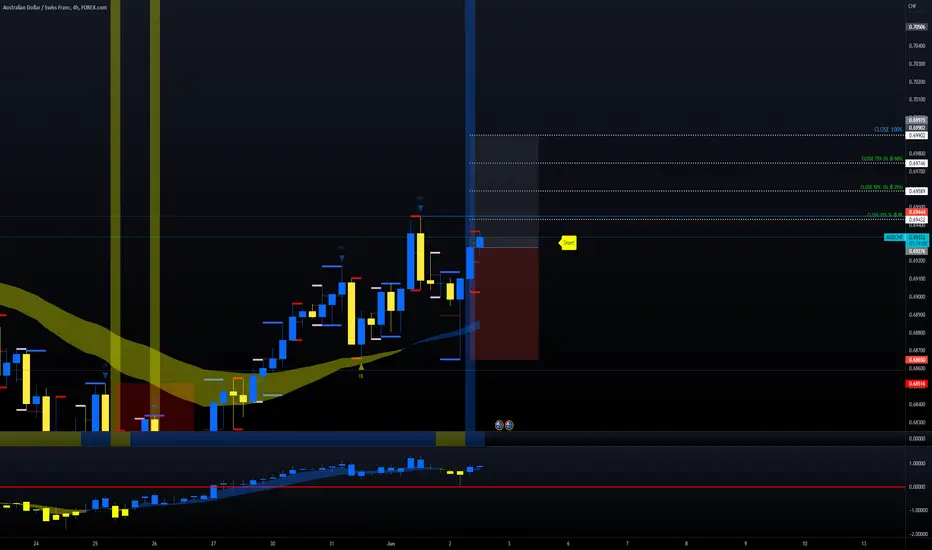
AUD/CHF LONG MOMENTUM POSITION ON 4H CANDLEThis is the position based on Edger trading system on 4H time frame,
This setup is 1:1 RR, entry has to be done on the candle close, the entry can be refined by your own knowledge.
This is only for educational purpose and no financial advice.
ENTRY : 0.69276 STOP LOSS : 0.68650
TAKE PROFIT 25% :0.69432
TAKE PROFIT 50% : 0.69589
TAKE PROFIT 75% : 0.69746
TAKE PROFIT 100% : 0.69902
FOLLOW RULES:
1. IF TAKE PROFIT 25% HITS, THEN MOVE THE STOP LOSS AT BREAK EVEN AND CLOSE 25% OF THE POSITION.
2. IF TAKE PROFIT 50% HITS, THEN MOVE THE STOP LOSS AT 25% TP LEVEL AND CLOSE 50% OF THE POSITION.
3. IF TAKE PROFIT 75% HITS, THEN MOVE THE STOP LOSS AT 50% TP LEVEL AND CLOSE 50% OF THE POSITION.
4. IF FULL TAKE PROFIT HITS, THEN CLOSE THE TRADE AND ENJOY.
ALSO, HIT LIKE, SHARE AND FOLLOW FOR MORE IDEAS. YOU CAN ALSO RAISE QUESTIONS ON TRADINGVIEW.
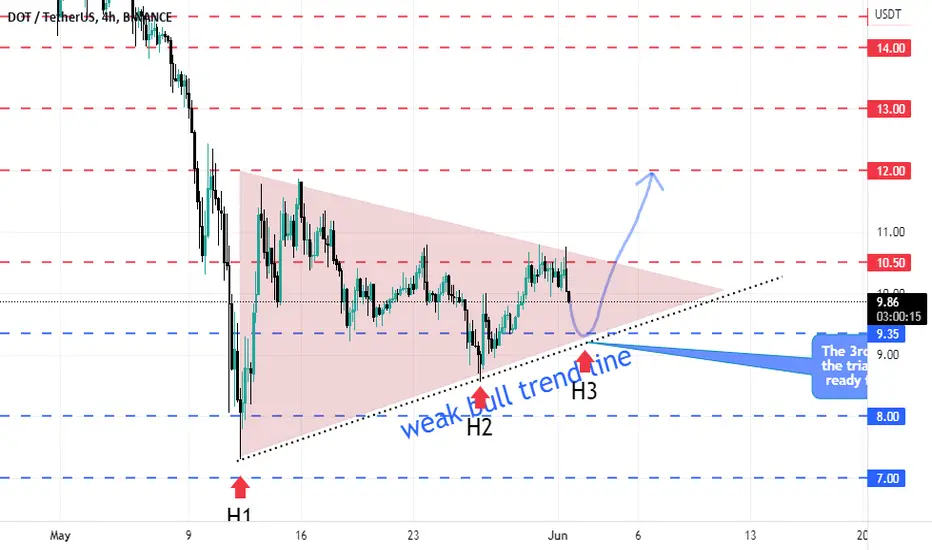
POLKADOT- Good swing ahead!!Hi everyone
As the price made a jump from 8.55$ to around 10.75$ for DOTUSDT, the possibility of having bull market is becoming more likely.
You can see a triangle pattern with 2 pushes down (H1&H2) if we get the indications of the 3rd push in the next couple of bars,we can hope for better price behavior in the future;So the indications are less sell pressure in the next couple of bars, a reversal pattern in around 8-12 bars from here and no breakout from the support level of 9.35$ or the bottom of our triangle.
Hope this analysis helps you in a way.
I will answer your questions,Just leave a comment below and PRESS THE LIKE BOTTOM please.
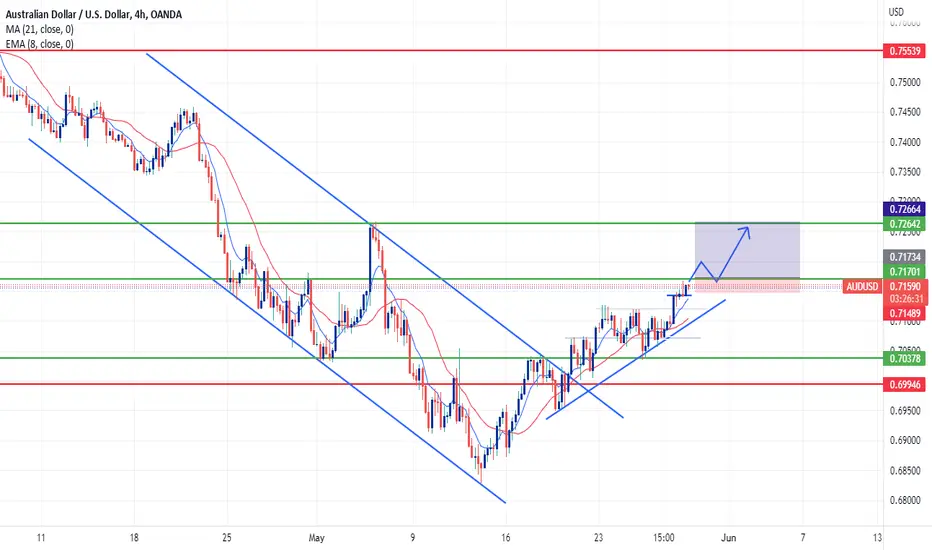
AUDUSD LONGOANDA:AUDUSD
The is a strong bullish move on AUDUSD. Should price break the key level of resistance on the 4H. The movement of AUDUSD will have a high probability of moving bullish this week.
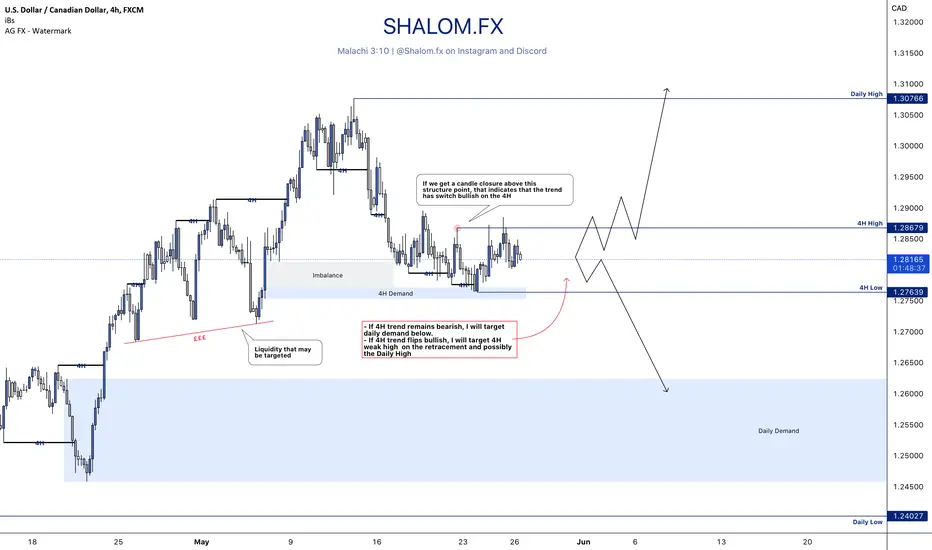
USDCAD Outlook - 26/05/22 Based on the current market for USDCAD, I am looking at whether I should look for short or long entires. If the 4H trend remains bearish I will look for sells to target a zone of daily demand below, however, if 4H structure flips bullish then I will look for long entries to target weak 4H highs and beyond.
*This is not Financial Advice, only for educational purposes!*
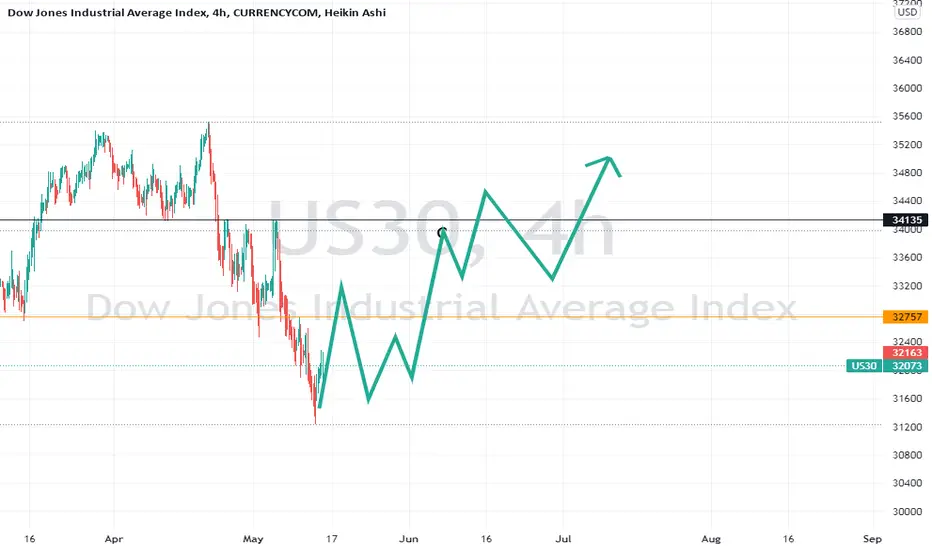
US30 4HIn my opinion we will go up in the next weeks ahead us.First target is above 32757 . Second target will be above 34135 and the final target will be 34947 to 35188. So I will go long for swing.
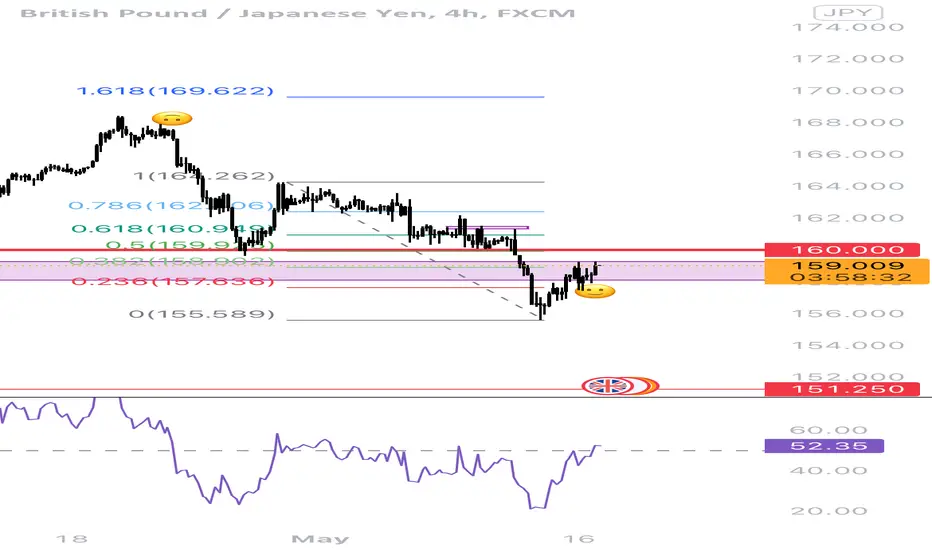
GBPJPY sellsPrice is slowly approaching 160.000 resistance zone. Once it reaches it we will be placing a sell order to the previous swing low. Be patient and trade safe guys ;)
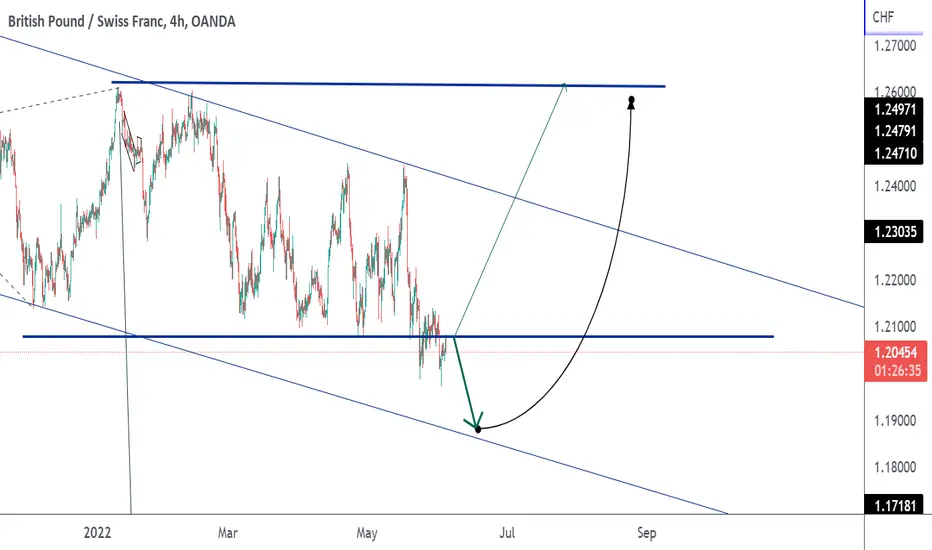
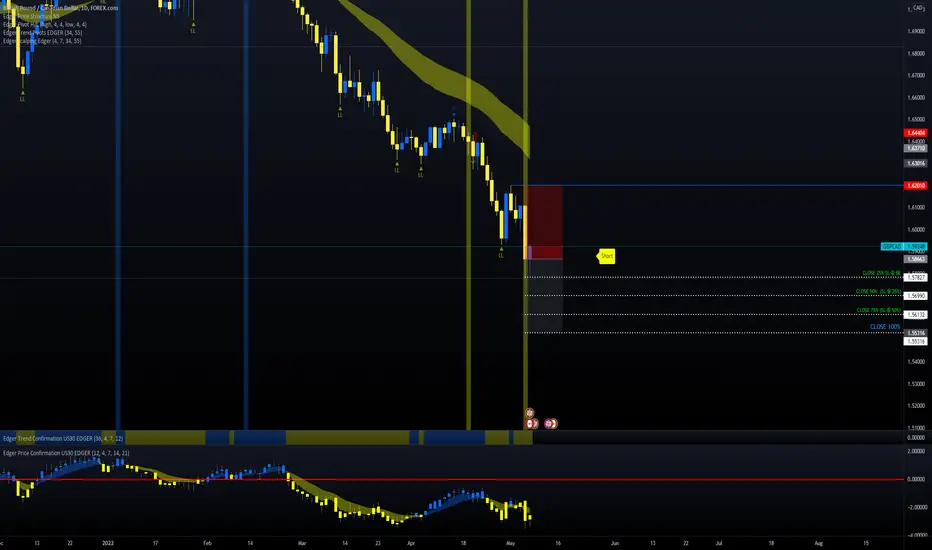
GBP/CAD SHORT MOMENTUM POSITION ON DAILY TIME FRAMEThis is the position based on Edger trading system on daily time frame,
This setup is 1:1 RR, entry has to be done on the candle close, the entry can be refined by your own knowledge.
This is only for educational purpose and no financial advice.
SELL STOP ENTRY : 1.58663 STOP LOSS : 1.62010
TAKE PROFIT 25% : 1.57827
TAKE PROFIT 50% : 1.56990
TAKE PROFIT 75% : 1.56132
TAKE PROFIT 100% : 1.55316
FOLLOW RULES:
1. IF TAKE PROFIT 25% HITS, THEN MOVE THE STOP LOSS AT BREAK EVEN AND CLOSE 25% OF THE POSITION.
2. IF TAKE PROFIT 50% HITS, THEN MOVE THE STOP LOSS AT 25% TP LEVEL AND CLOSE 50% OF THE POSITION.
3. IF TAKE PROFIT 75% HITS, THEN MOVE THE STOP LOSS AT 50% TP LEVEL AND CLOSE 50% OF THE POSITION.
4. IF FULL TAKE PROFIT HITS, THEN CLOSE THE TRADE AND ENJOY.
ALSO, HIT LIKE, SHARE AND FOLLOW FOR MORE IDEAS. YOU CAN ALSO RAISE QUESTIONS ON TRADINGVIEW.
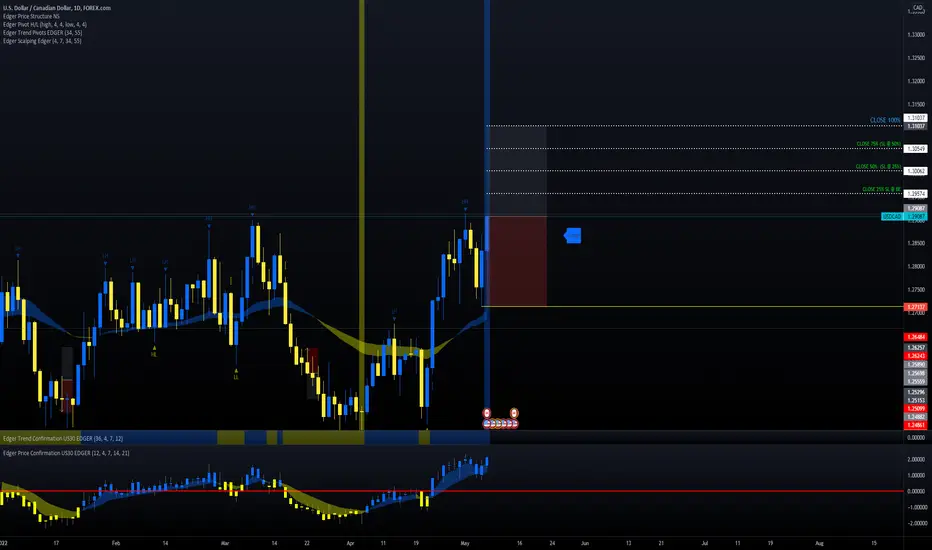
USD/CAD LONG MOMENTUM ON DAILY TIME FRAMEThis is the position based on Edger trading system on daily time frame,
This setup is 1:1 RR, entry has to be done on the candle close, the entry can be refined by your own knowledge.
This is only for educational purpose and no financial advice.
ENTRY : 1.29087 STOP LOSS : 1.27137
TAKE PROFIT 25% : 1.29574
TAKE PROFIT 50% : 1.30062
TAKE PROFIT 75% : 1.30549
TAKE PROFIT 100% : 1.31037
FOLLOW RULES:
1. IF TAKE PROFIT 25% HITS, THEN MOVE THE STOP LOSS AT BREAK EVEN AND CLOSE 25% OF THE POSITION.
2. IF TAKE PROFIT 50% HITS, THEN MOVE THE STOP LOSS AT 25% TP LEVEL AND CLOSE 50% OF THE POSITION.
3. IF TAKE PROFIT 75% HITS, THEN MOVE THE STOP LOSS AT 50% TP LEVEL AND CLOSE 50% OF THE POSITION.
4. IF FULL TAKE PROFIT HITS, THEN CLOSE THE TRADE AND ENJOY.
ALSO, HIT LIKE, SHARE AND FOLLOW FOR MORE IDEAS. YOU CAN ALSO RAISE QUESTIONS ON TRADINGVIEW.
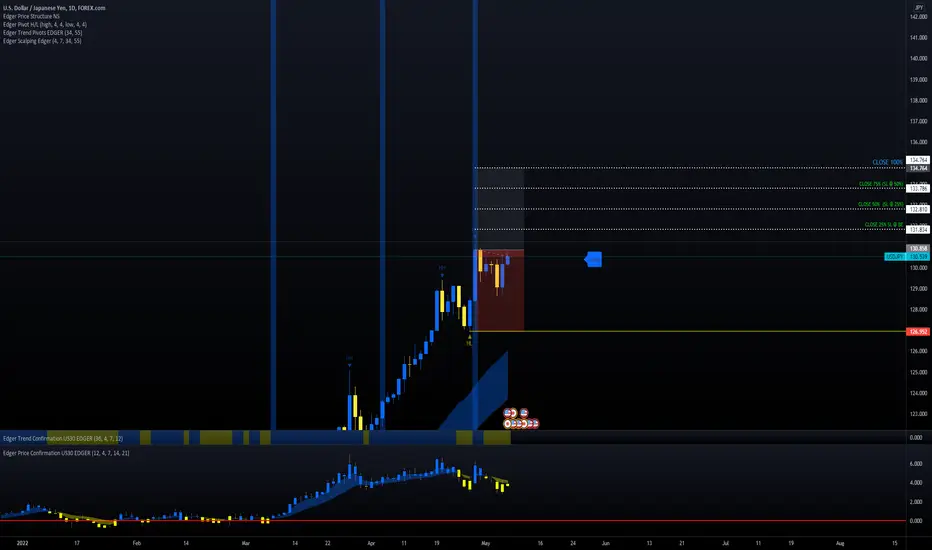
USD/JPY LONG MOMENTUM ON DAILY TIME FRAMEThis is the position based on Edger trading system on daily time frame,
This setup is 1:1 RR, entry has to be done on the candle close, the entry can be refined by your own knowledge.
This is only for educational purpose and no financial advice.
BUY STOP ENTRY : 130.858 STOP LOSS : 126.952
TAKE PROFIT 25% : 131.834
TAKE PROFIT 50% : 132.810
TAKE PROFIT 75% : 133.786
TAKE PROFIT 100% : 134.764
FOLLOW RULES:
1. IF TAKE PROFIT 25% HITS, THEN MOVE THE STOP LOSS AT BREAK EVEN AND CLOSE 25% OF THE POSITION.
2. IF TAKE PROFIT 50% HITS, THEN MOVE THE STOP LOSS AT 25% TP LEVEL AND CLOSE 50% OF THE POSITION.
3. IF TAKE PROFIT 75% HITS, THEN MOVE THE STOP LOSS AT 50% TP LEVEL AND CLOSE 50% OF THE POSITION.
4. IF FULL TAKE PROFIT HITS, THEN CLOSE THE TRADE AND ENJOY.
ALSO, HIT LIKE, SHARE AND FOLLOW FOR MORE IDEAS. YOU CAN ALSO RAISE QUESTIONS ON TRADINGVIEW.
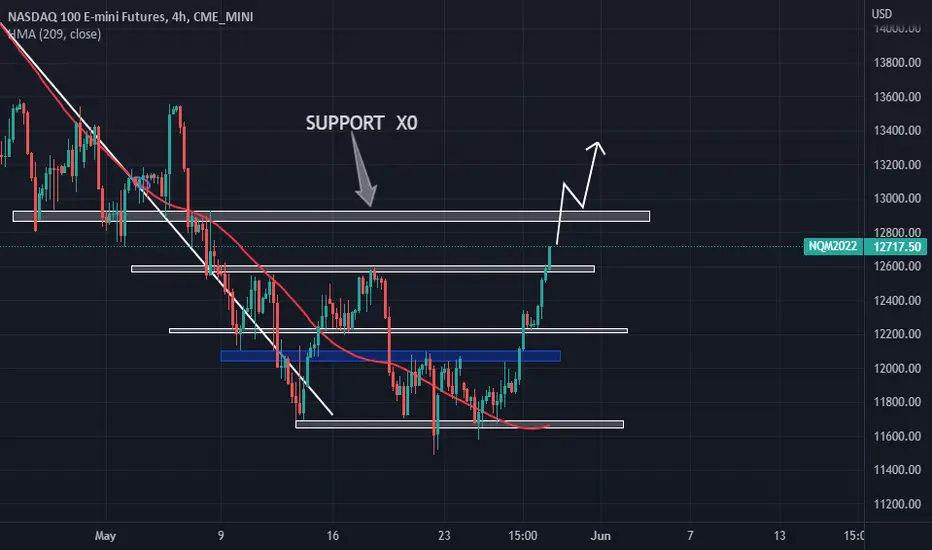
Nasdaq Sell Signal (Now Too Late)Sell signal in progress. I still use the 1hr even the 15min time frame to try to get better prices.
My goal is to move them over to the 4hr time frame where I can remove as much noise as possible.
Here I am posting a trade that is too late to take. But the signal is there (I took it with a small position)
I don't see enough interest to be posting close to real-time therefore I don't really. Time to just manage
this trade. I am not looking for a huge run though perhaps lower lows but the oversold conditions
continue and I would be hard pressed to expect a massive crash (not out of the question but not enough
evidence to support this ATM)

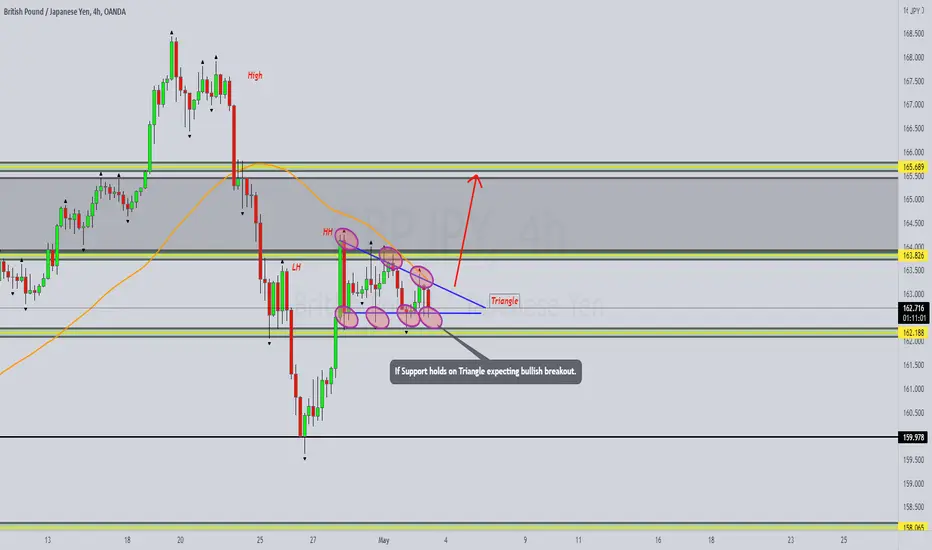
GBPJPY 4H TriangleHuge break out on Monthly to upside.
Weekly pullback with sellers' exhaustion.
Daily Resistance Zone.
4H Broke structure created a higher high.
4H Consolidation making a Triangle possibly for trend continuation to upside.
If pattern breaks bullish expecting next Daily Resistance Zone 165.689 area to be reached.
AUDUSD BounceA 4h buy signal in AUD suggests this will stop falling for now. Stop at 7033 if hit will let us know
we were wrong. But hey a signal is a signal. This is also taking into account that the daily and weekly
timeframes suggest oversold as well. We can not know if this will be a meaningful bounce or not at this time.
We will get out upon a 4h sell signal.
