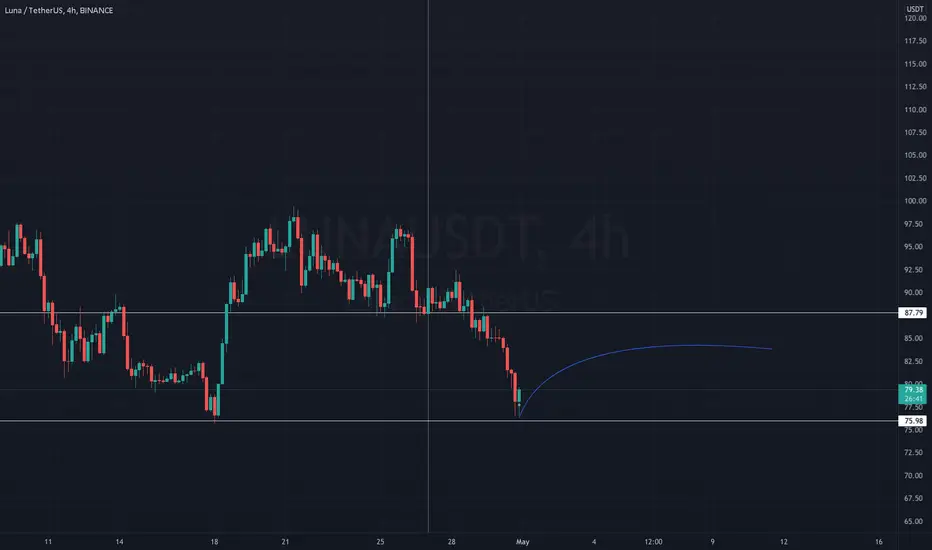
DAYTRADE $LUNA - 4H Double Bottom Forming?Hoping for a bounce up
50X LONG DAYTRADE
Hoping for a quick trade before the downtrend continues.... daily gains
4h
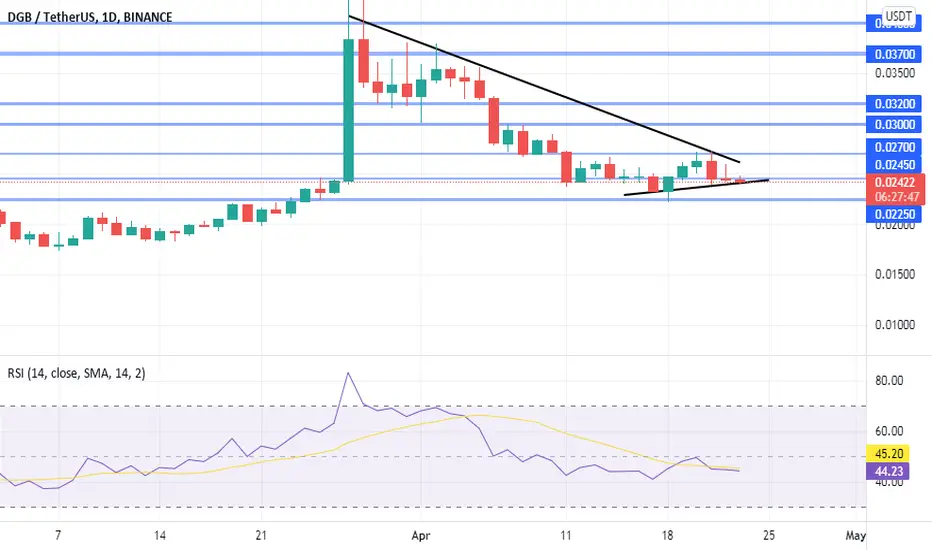
DGB- good wedge formationHello everyone
The bear channel of DGBUSDT is turning into a wedge pattern ( tight one)that shows a possible reversal or a steady bull channel formation in the next few days.
On 4 hours chart however,we can see a small bear flag pattern and a possible head and shoulders pattern, which shows, that market can touch the support level ( 0.0225$)and come back and go up to resistance level 0.027$.
P.S. : Wedge pattern is more likely to have a reaction,because of higher time frame , and volume.
Almost perfect Bullish Bat pattern on XRPXRP is pretty bulish right now.Last Dip liquidated a lot of longs and XRP is sitting at big support at this area can be pretty big soon.

FTM HUGE SIGNAL FOR LONGFTM was a little bit sleepy last time but now i am seeing a big potencial in this coin, looks like he will break soon resistance ang go high.

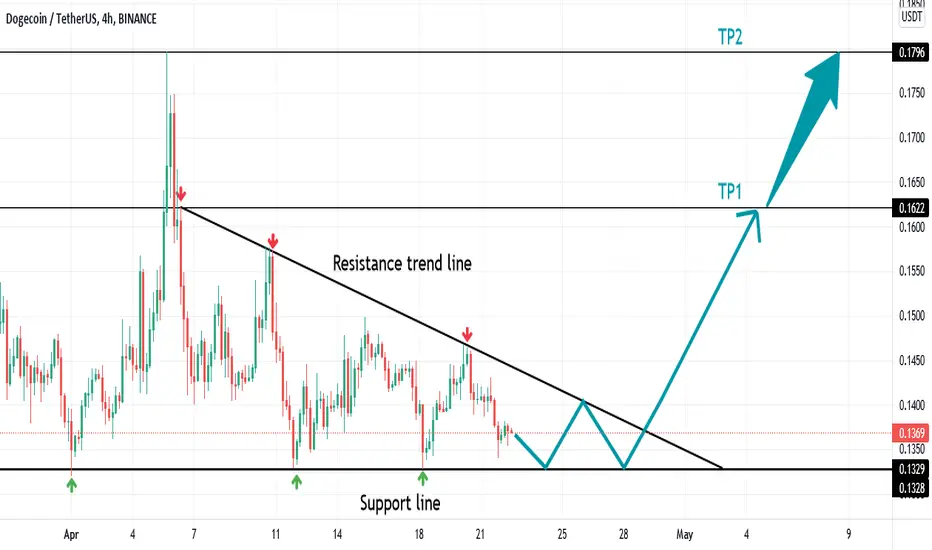
Dose the dogecoin break its resistance trend line?A strong resistance line is formed in the 4-hour time frame.In the range of 13.3 cents,there is a strong support line,which is quickly rejected every time the price hits it.TP1 and TP2 will be accessible if the resistance line is broken upwards.If the support line is broken down,the price decreases by the height of the triangle.
SOL fights with resistance at $ 106Hello everyone, let's take a look at the SOL to USDT Chart on the 4H Interval. As you can see, price is moving above the local uptrend line.
Let's start with the designation of the support line and as you can see the first support in the near future is $ 102 if the support is broken, the next one is $ 92 and another one at $ 78.
Now let's move on from the resistance line, as you can see, the first resistance is $ 106 which the price is currently struggling with, if it manages to break it, the next resistance will be $ 113 and $ 119.
Looking at the CHOP indicator, we can see that in the 4-hour interval most of the energy has already been used.

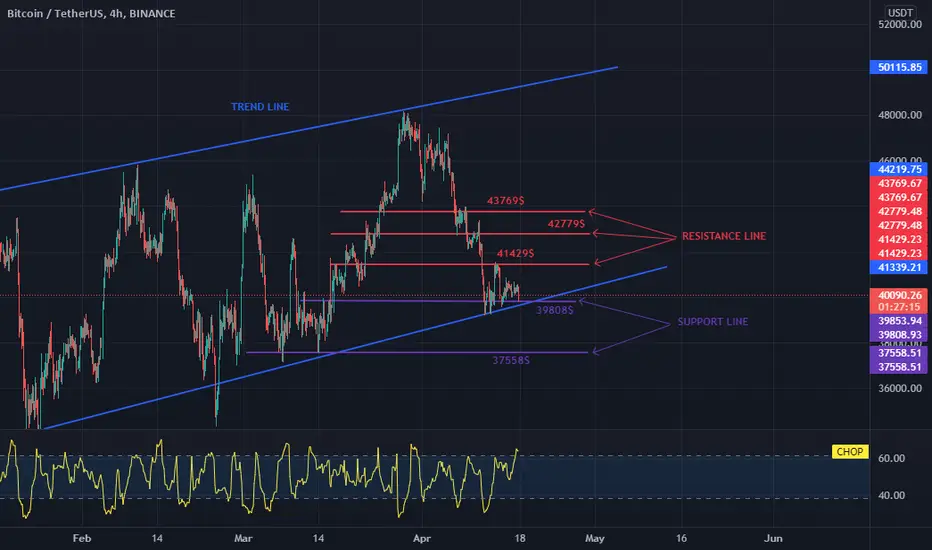
NOTE! BTC a lot of energy at 4H.Hello everyone, let's take a look at the BTC to USDT chart over time. As you can see, the price is moving in an uptrend channel marked with blue lines.
Let's start with the designation of the support line and as you can see the first support in the near future is $ 39,808, if the support breaks down, the next one is $ 37,558.
Now let's move from the resistance line as you can see the first resistance is $ 41,429, if you can break it the next resistance will be $ 42,779 and $ 43,769.
It is worth paying attention to the CHOP indicator, we can see that in the 4-hour interval we have a lot of energy and we can expect movement in inspiring hours.
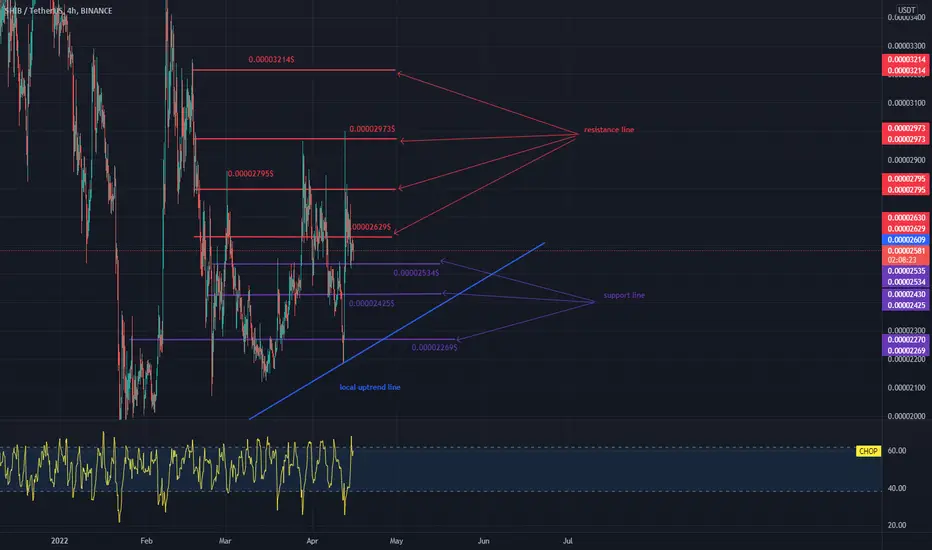
SHIB a lot of energy in the 4H interval!Hello everyone, let's take a look at the SHIB to USDT chart at 4H. As you can see, the price is moving along the local uptrend line.
Let's start with the designation of the support line and as you can see the first support in the near future is $ 0.00002534, if the support breaks down, the next one is $ 0.00002425, and the next one is $ 0.00002269.
Now let's move from the resistance line as you can see, the first resistance is $ 0.00002629, if you can break it, the next resistance is $ 0.00002795, the next one is $ 0.00002973 and the next one is $ 0.00003214.
Looking at the CHOP indicator, we can see that in the 4H interval we have a lot of energy, if BTC remains calm, we can observe an increase in the SHIB price in the coming hours.
GMT/USDT 4h - PennantAs you can see in the chart, GMT is in a pennant.
Wait for breakout.
This is not a financial advice
Protect your money :)

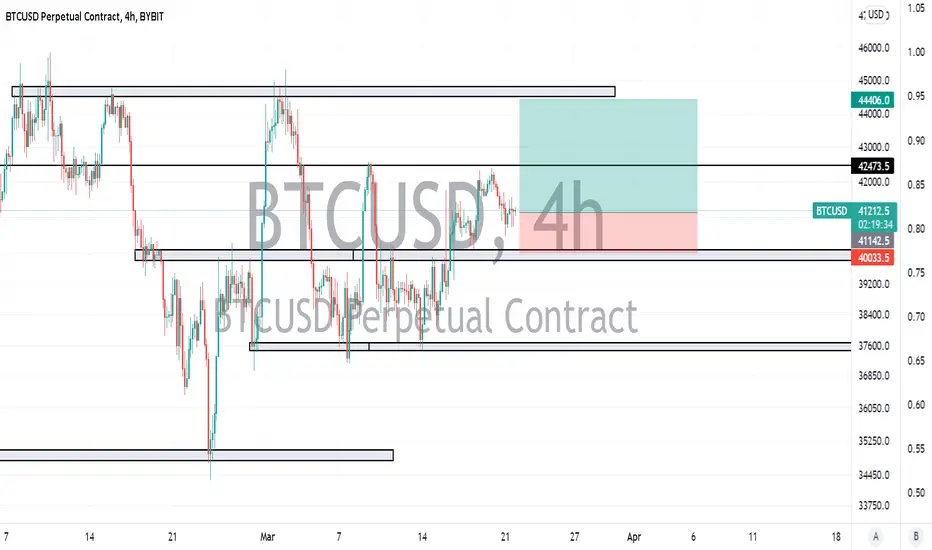
#BTC - $BTC (New Update)Dear Friends
this is a Long position Setup that I think.
there are 2 resistance zones (42500 - 44500).
check it with ur strategy
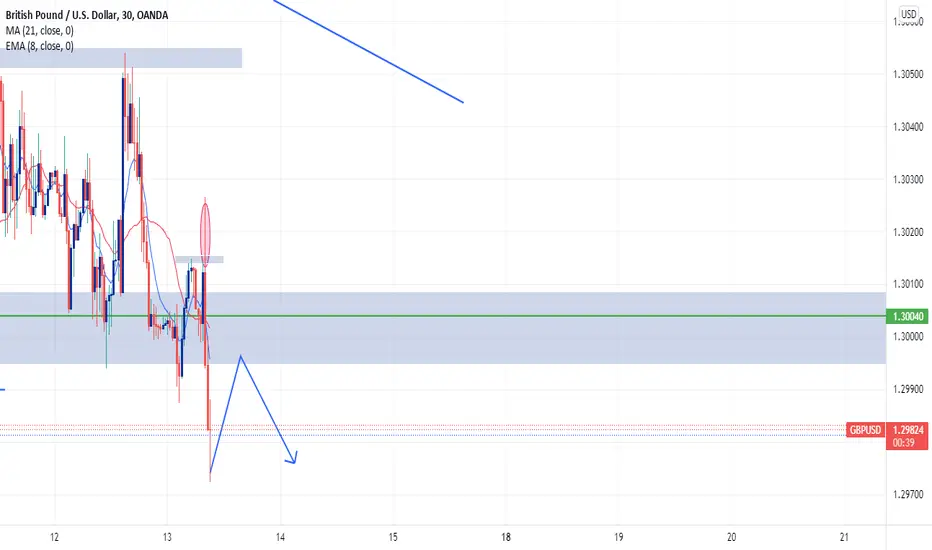
GBP USD 4H Chart AnalysisSTRONG SELL - chart will follow the continuation . New lower low can build.

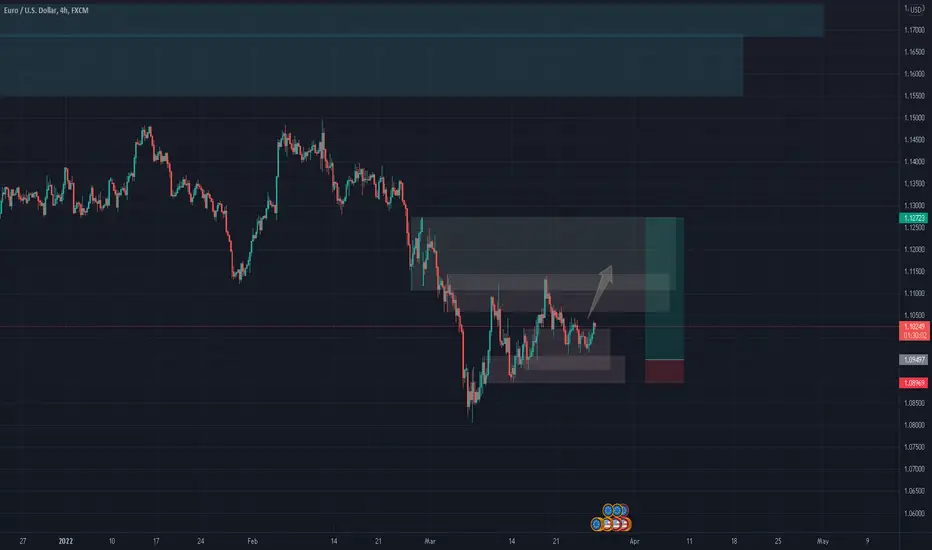
EURUSD - Daily level OpportunitiesEURUSD - Opportunity to take long position in 4h chart based on daily level.
Buy Setup Of US30, 4HHello traders,
here is chart on USD30. The market has now completed the correction of the first wave.
Now that the correction is completed, the market is ready for a second bullish impulse.

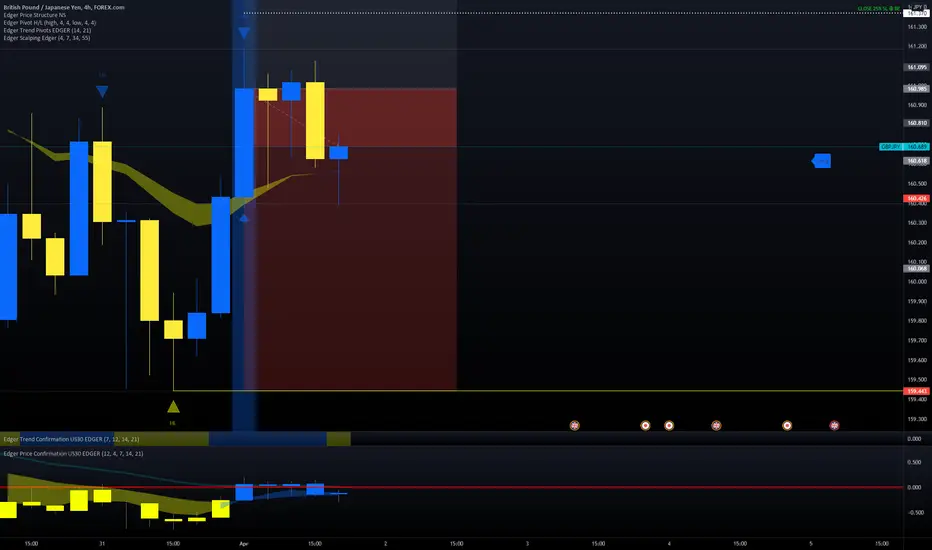
GBP/JPY LONG MOMENTUM POSITION ON 4HThis is the position based on Edger trading system on daily time frame,
This setup is 1:1 RR, entry has to be done on the candle close, the entry can be refined by your own knowledge.
This is only for educational purpose and no financial advice.
BUY STOP ENTRY : 160.985
STOP LOSS : 159.443
TAKE PROFIT 25% : 161.37
TAKE PROFIT 50% : 161.756
TAKE PROFIT 75% : 162.141
TAKE PROFIT 100% : 162.527
FOLLOW RULES:
1. IF TAKE PROFIT 25% HITS, THEN MOVE THE STOP LOSS AT BREAK EVEN AND CLOSE 25% OF THE POSITION.
2. IF TAKE PROFIT 50% HITS, THEN MOVE THE STOP LOSS AT 25% TP LEVEL AND CLOSE 50% OF THE POSITION.
3. IF TAKE PROFIT 75% HITS, THEN MOVE THE STOP LOSS AT 50% TP LEVEL AND CLOSE 50% OF THE POSITION.
4. IF FULL TAKE PROFIT HITS, THEN CLOSE THE TRADE AND ENJOY.
ALSO, HIT LIKE, SHARE AND FOLLOW FOR MORE IDEAS. YOU CAN ALSO RAISE QUESTIONS ON TRADINGVIEW.
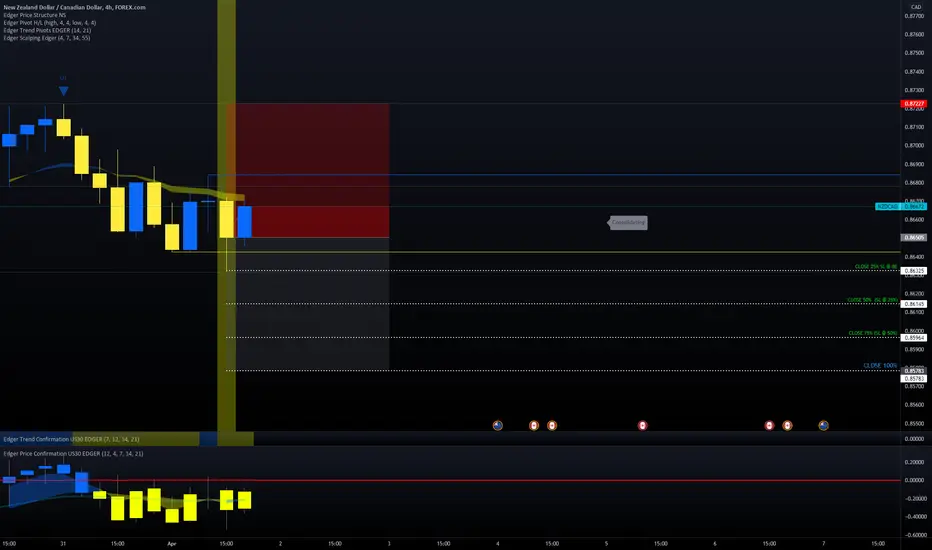
NZD/CAD SHORT MOMENTUM POSITION ON 4HThis is the position based on Edger trading system on daily time frame,
This setup is 1:1 RR, entry has to be done on the candle close, the entry can be refined by your own knowledge.
This is only for educational purpose and no financial advice.
SELL STOP ENTRY : 0.86505
STOP LOSS : 0.87227
TAKE PROFIT 25% : 0.86325
TAKE PROFIT 50% : 0.86145
TAKE PROFIT 75% : 0.85964
TAKE PROFIT 100% : 0.85783
FOLLOW RULES:
1. IF TAKE PROFIT 25% HITS, THEN MOVE THE STOP LOSS AT BREAK EVEN AND CLOSE 25% OF THE POSITION.
2. IF TAKE PROFIT 50% HITS, THEN MOVE THE STOP LOSS AT 25% TP LEVEL AND CLOSE 50% OF THE POSITION.
3. IF TAKE PROFIT 75% HITS, THEN MOVE THE STOP LOSS AT 50% TP LEVEL AND CLOSE 50% OF THE POSITION.
4. IF FULL TAKE PROFIT HITS, THEN CLOSE THE TRADE AND ENJOY.
ALSO, HIT LIKE, SHARE AND FOLLOW FOR MORE IDEAS. YOU CAN ALSO RAISE QUESTIONS ON TRADINGVIEW.
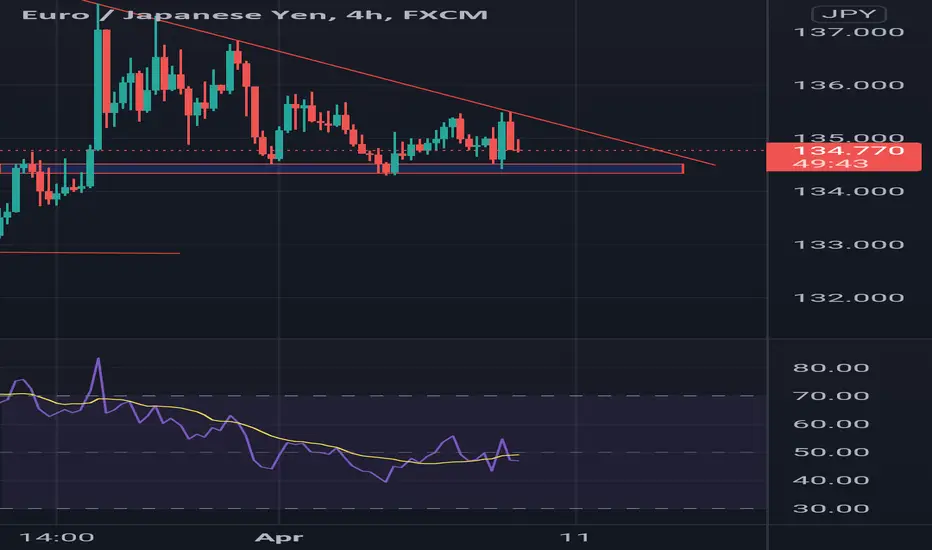
Triangle pattern A triangle pattern has been observed on EURJPY on 4 hour time frame. A good entry can be taken on the breakout with good Risk-Reward ratio. Hope it will help you in taking an entry.
KAVA/USDT 4HKAVA/USDT 4hr Forming Bull flag.
After Breakout up and after retest long with u r target.

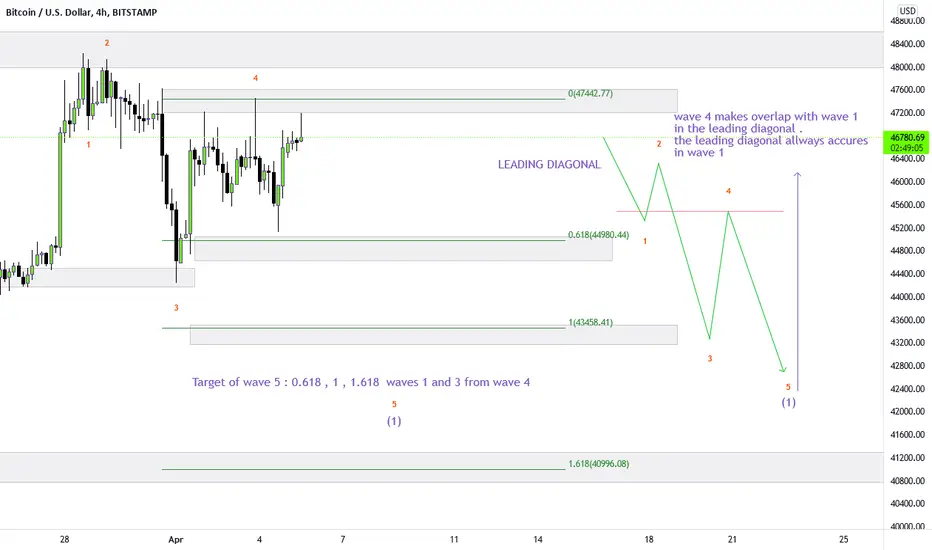
btcudst 4H If the Bearish Trend of BTC is starting , This is the wave counting of bearish wave 1 .
In my prespective this will be the leading diagonal and leading diagonal allways accures in wave 1
where the small wave 4 making the overlap with small wave 1
BTC 4HR Possible price movements/targetsPrice needs to hold the Breakout of the uptrend and gain the Excess price line.
BTC Overbought now so retracement to lower levels very possible.
If price breaks above, I am going to watch the Long POI as possible retracement target for BTC.
Before BTC will try to go to the 50K level.
No financial advice

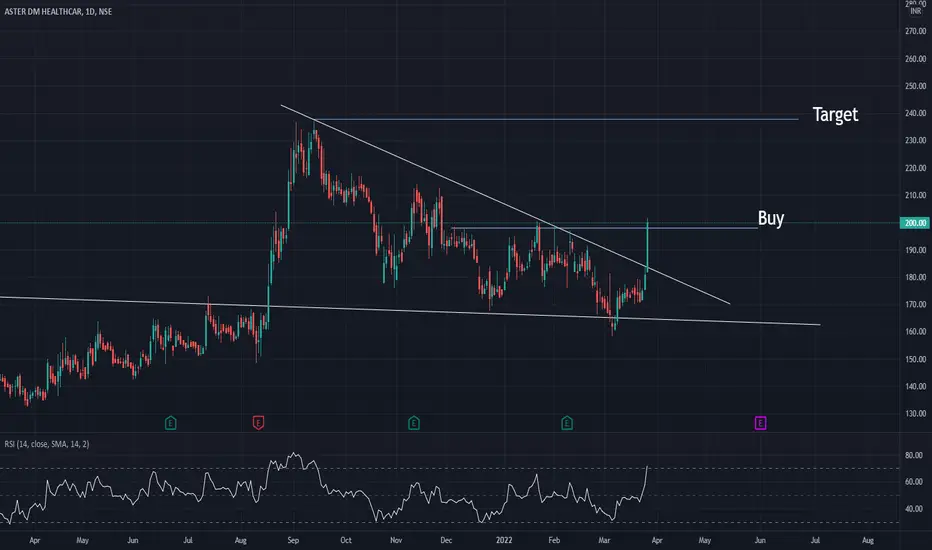
Aster DM Healthcare breakout Aster DM Healthcare Limited is a publicly-traded Indian conglomerate health care provider founded in 1987 by Azad Moopen who hails from Kerala, India. The company is registered in India. Aster DM Healthcare currently operates hospitals, diagnostic centers, medical centers, and pharmacies in the India and the Middle East. Wikipedia
Stock price: ASTERDM (NSE) ₹199.10 +18.15 (+10.03%)
USDCHF:Support Break Could Open For A Drop Towards 0.92000 Area!USDCHF Climbed considerably high a few weeks ago breaking the long held range trading in the process on the back of the USD strength. However since then the price seems to have lost some momentum and now it looks to go lower. Based on technical perspective on the 4H timeframe, the support of 0.93000 must be broken on the daily chart! After this A Short swing trade could be executed with the target being the ascending trendline beneath at the region of 0.92000.
All the trade details are clearly visible on the main chart shall the above stated criteria be met. Remember to adjust your entry point to attain ideal 1:1 RR.
Cheers, I hope you find this insight helpful. Please LIKE & FOLLOW for more insights into other major currency pairs.
