4h

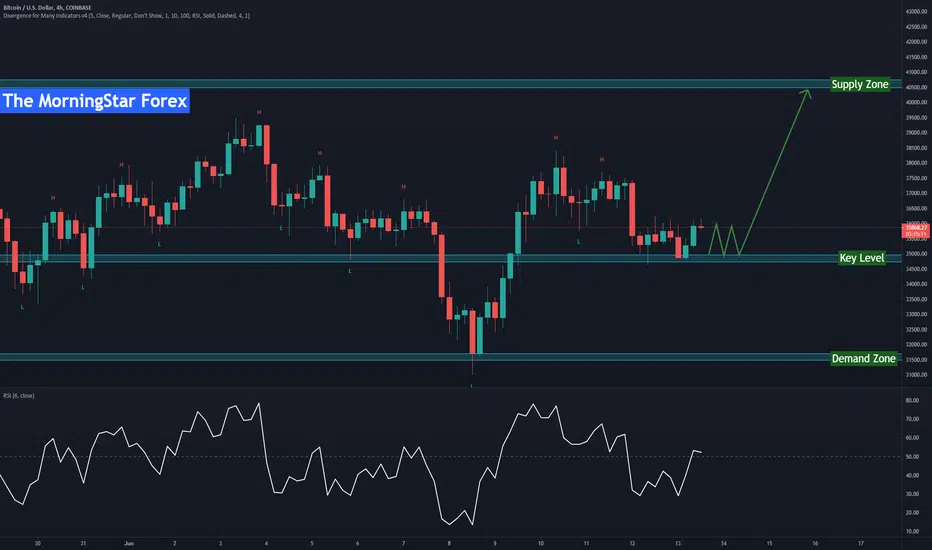
BTCUSD - 4H - SUPPLY/DEMAND - LONGOur traders are looking for the right entry signal to enter this trade. hope this helps you.
Happy trading.!
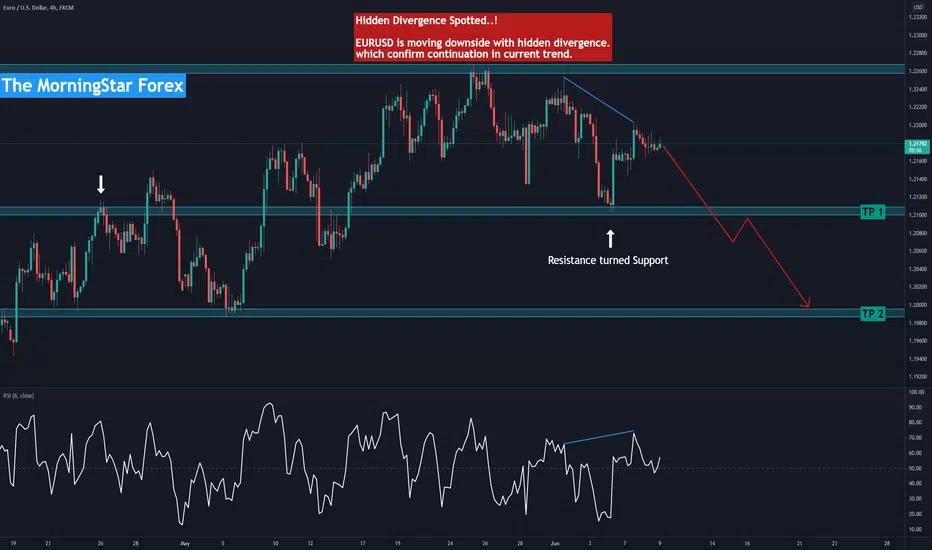
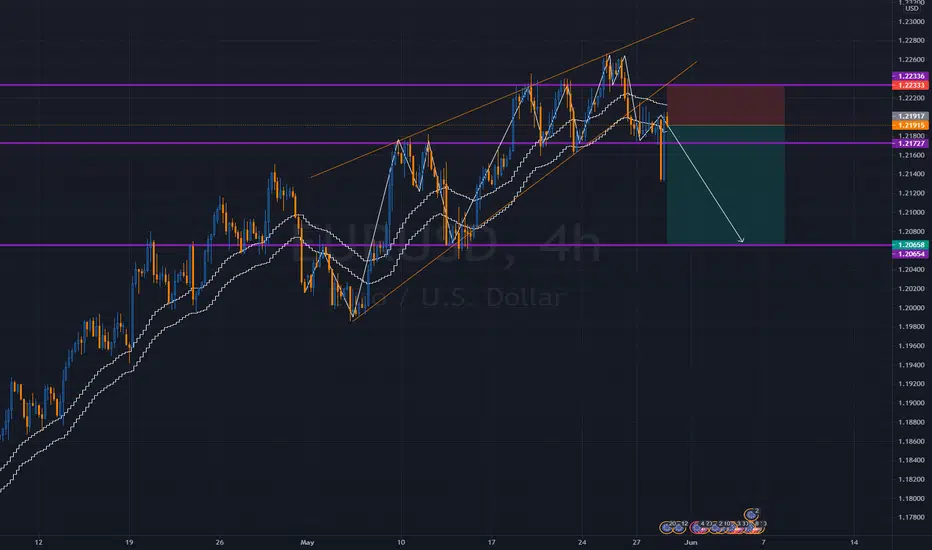
EURUSD - 4H - HIDDEN DIVERGENCE - SHORTEURUSD has been moving in a downward direction for a weekly retracement, Also the 4H timeframe is giving a Hidden divergence, which is a sign of a trend continuation. Please look out for entry-appropriate Price action for Short Swing Trade.
If you like clean analysis like this please follow for more.
Happy trading.!
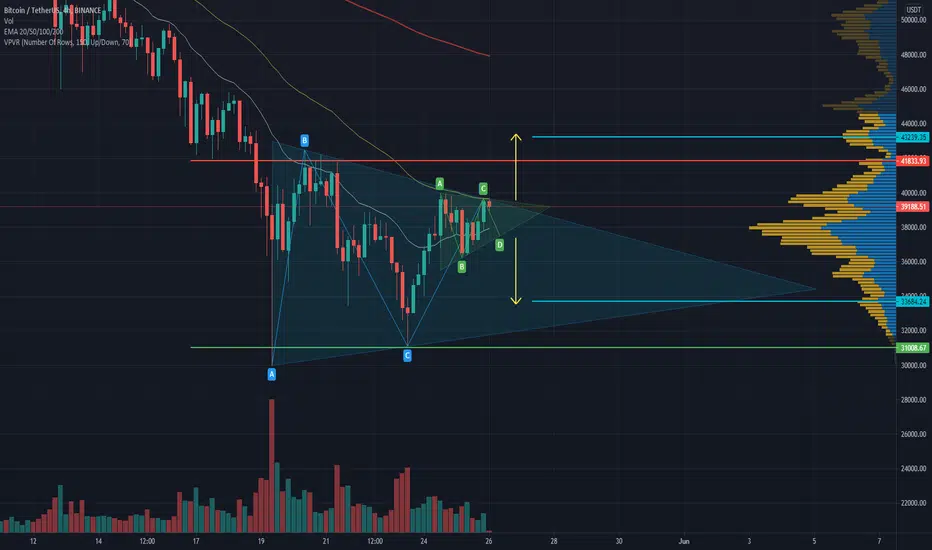
BTC on important zone, Long and Short IdeasBTC is doing a big range, little triangle inside big one has 50% chance to broke upside, 50& chance to broke downside.
Downside broke dont invalidate current trend unless it does a lower low.
Upper red line is 200 EMA DAILY.
Green Line is Range Support.
Targets in blue lines.
Regards and safe trade.
Engineer Alexa.
Strong possibility of BULLISH Future for EURUSDRead The comment boxes on these charts that i have put out for you. EURUSD in my belief could be gaining enourmous strength over time and price rising thousands of pips over the next few months, and we are now at the beginning breaking point of this possibly huge uptrend.

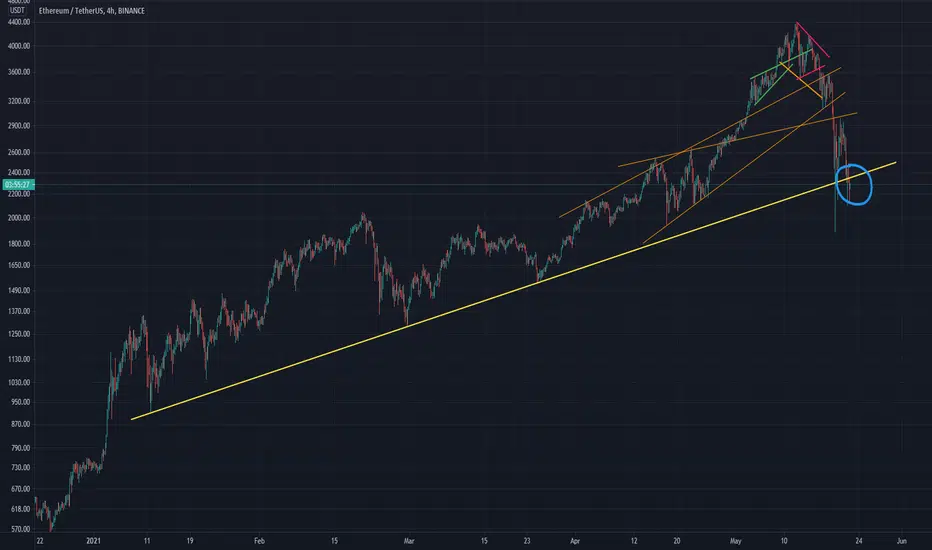
ETH just closed below long term trend lineClosed below the yellow trend line on the 4H (log scale).
The trend line seems to be significant since January 2021.
On the linear scale, however, we haven't broken that trend line yet.
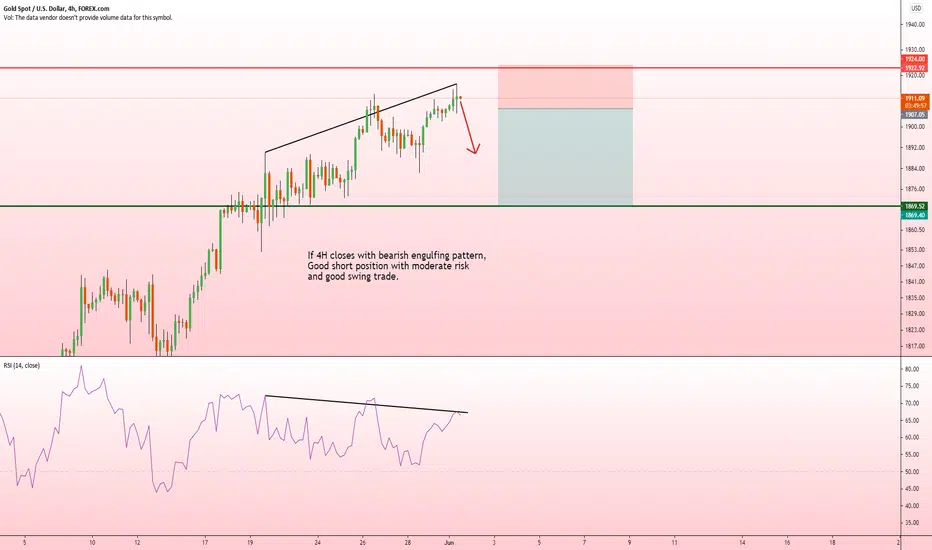
XAUUSD WILL FALL SOON - 4Hwhen price touchs the weekly strong resistance we will have a bearish trend , as you see there is pressure at last candles I think that is sellers pressure , so after all RSI has a sell signal . so also price has broke that resistance trend line also so we will need a pull back .
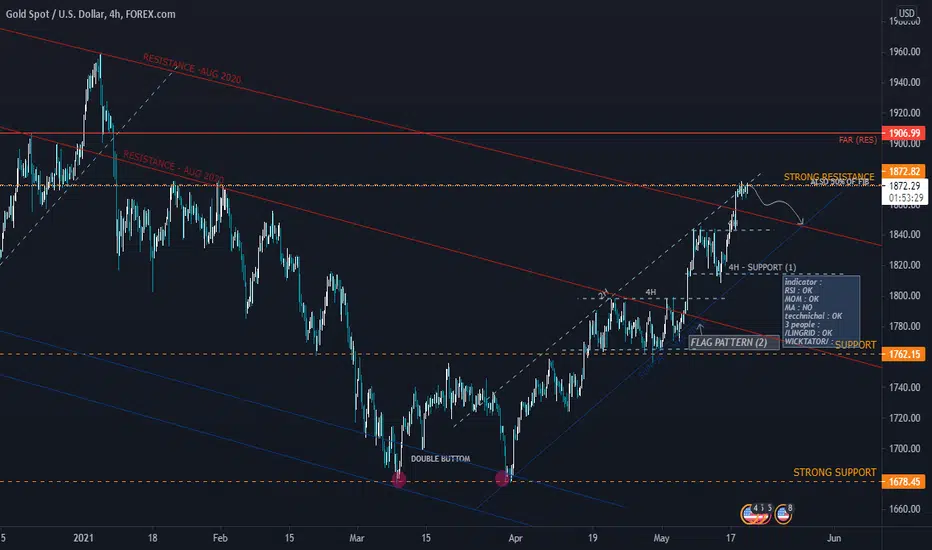
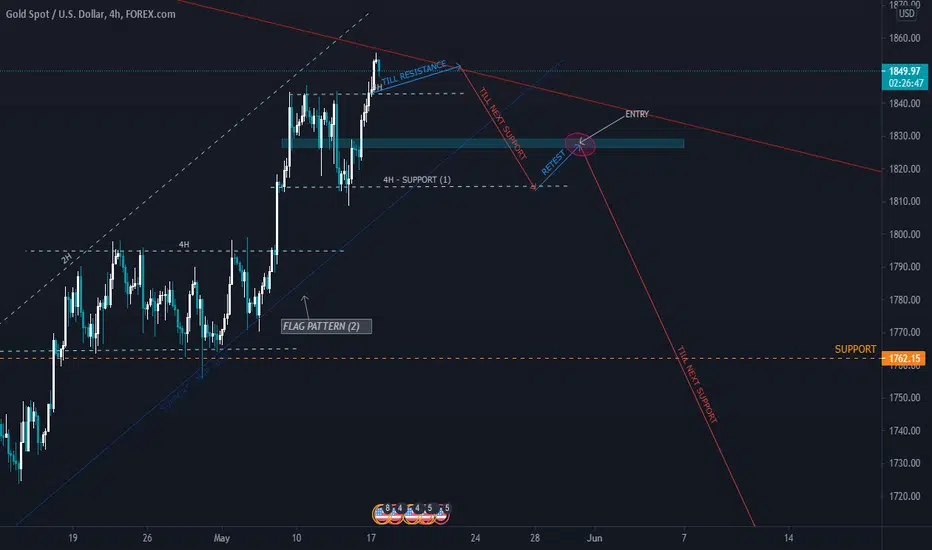
XAUUSD - 4H Hello traders , I hope you have a great day . as you see we are watching gold's last bullish attempts , so , i think we had a bullish flag pattern , as you see on chart I would trade after break out and a pullback , I think we will have a safe sell .
I will have SL but I am not planning to have TP , so chart will say to me where should I close my order . after flag pettern's breakout , I guess we will have a double head or triangle pattern or maybe another flag pattern . so I will make another sell order after that break out .
if you liked my idea please like and share and follow me for more analyses :)
TRADE WISELY , HADI TOHIDI .

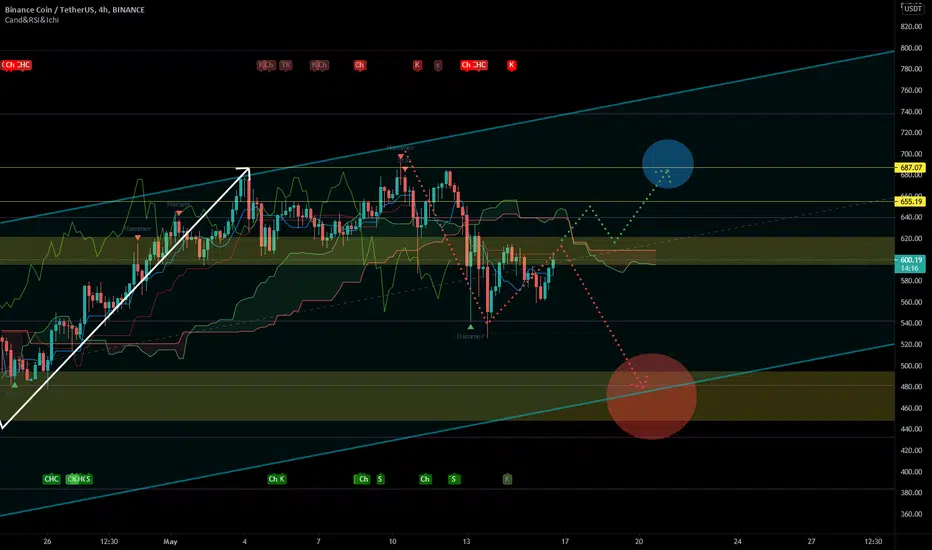
BNBUSDTBainance baby game on the ascending channel
Although this currency has a short life, it has shown that it has a lot of growth potential.
ETHUSDTETHEREUM currency has the energy and chance to climb
Now, as the amount of capital on Bitcoin decreases, Ethereum Digital Currency, as the second currency, has the necessary ability and chance to rise.

LINKUSDTIs the date of the rand repeated?
Currently in the currency process, the link has hit a range of resistances and has fallen down. This has been repeated a little earlier. Therefore, it is expected that the trend will reach the bottom of the channel with a break.
At the bottom of the channel, the specified range is much more important to determine the future trend of the link currency.

BLZ/BTC-4HDue to the increase in daily trading volume and the increase in BLZ marketcap and the transition from the uptrend triangle pattern, Targets 1 and 2 are fully available, and in case of failure of the resistance area of the second target, it is possible to achieve the third target in the long run.

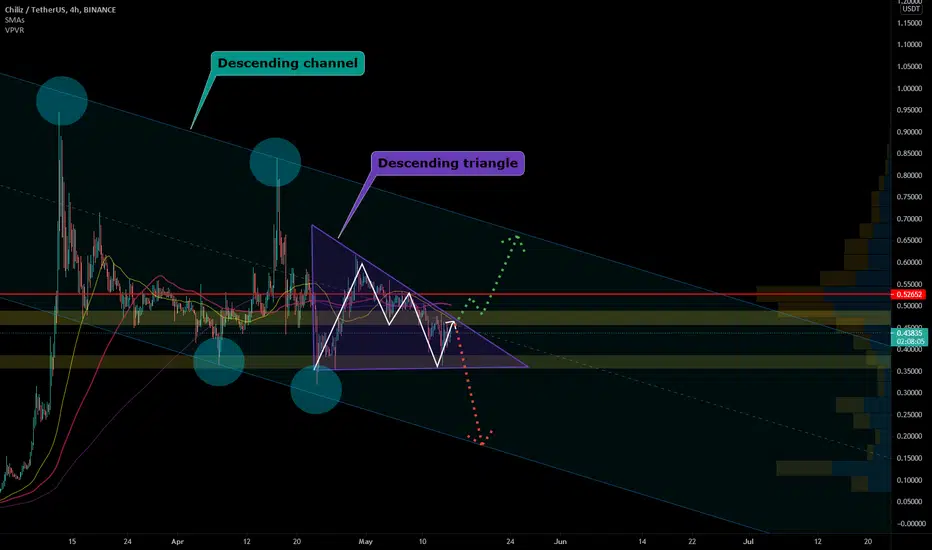
CHZUSDTCHILIZ 's fateful decision
We see that the Chiliz trend has formed a descending triangle because most of the failures in this type of triangle have been descending.
Unfortunately, Chiliz is following a major downturn, so it is more likely to fall in the near future.
COTI can pump and give 0.5813This currency can reach a new ceiling with the help of Elliott waves and give you a lot of profit.
I used Fibonacci and came to this conclusion with the help of Fibonacci.
Check and do not lose profit.

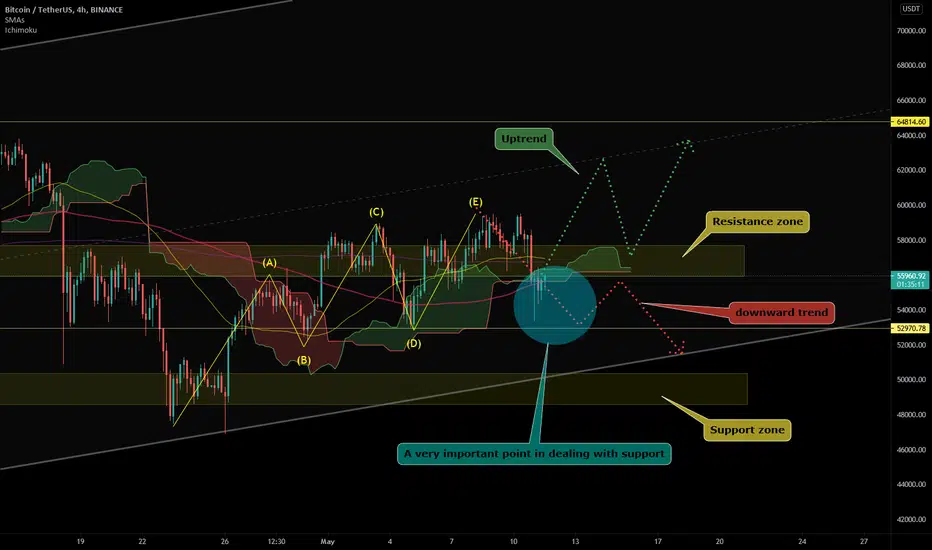
BTCUSDTAn important and influential point in the bitcoin process
Take a closer look at the blue area shown here. There are support factors, including the Ichimoku cloud range and the moving average within it, that the trend has not been able to defeat.
Now, if it continues to support the trend, it will cause Bitcoin to rise.
And if it can't stop the fall, it will face a serious challenge on the canal floor.
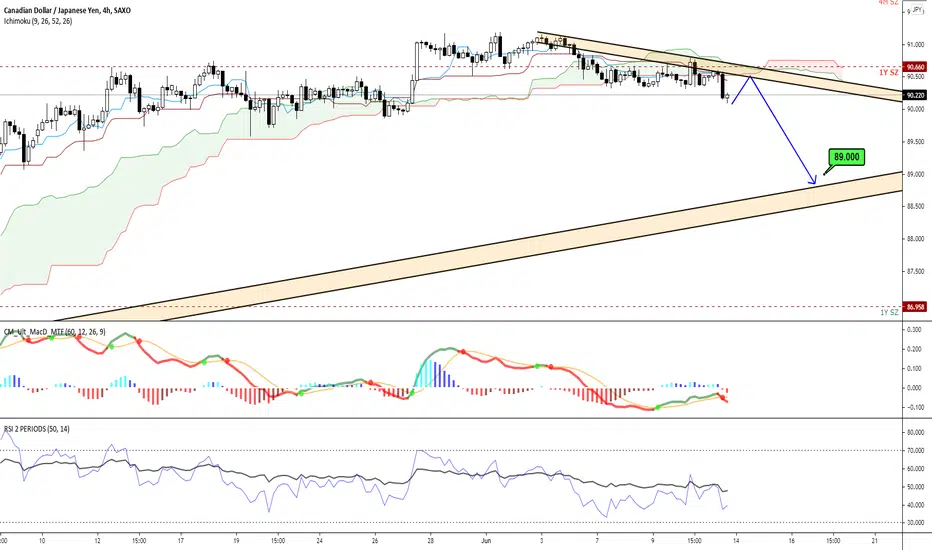
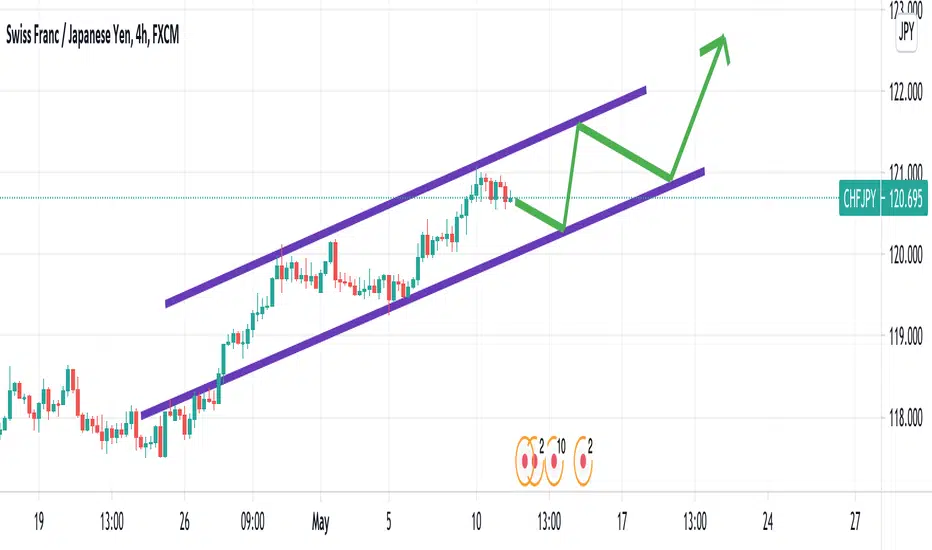
A clear Ascending Channel is Forming on CHF/JPYThe 4h chart of CHF/JPY is forming a great ascending channel.
It's not valid yet, but if price touches the bottom purple line for the second time, then it will be confirmed.
P.S. I'm trying to build my reputation. If you want to help, please Follow my profile, comment below, and like this post :) It will help greatly.. and I will repay the kindess by doing the same back to you!
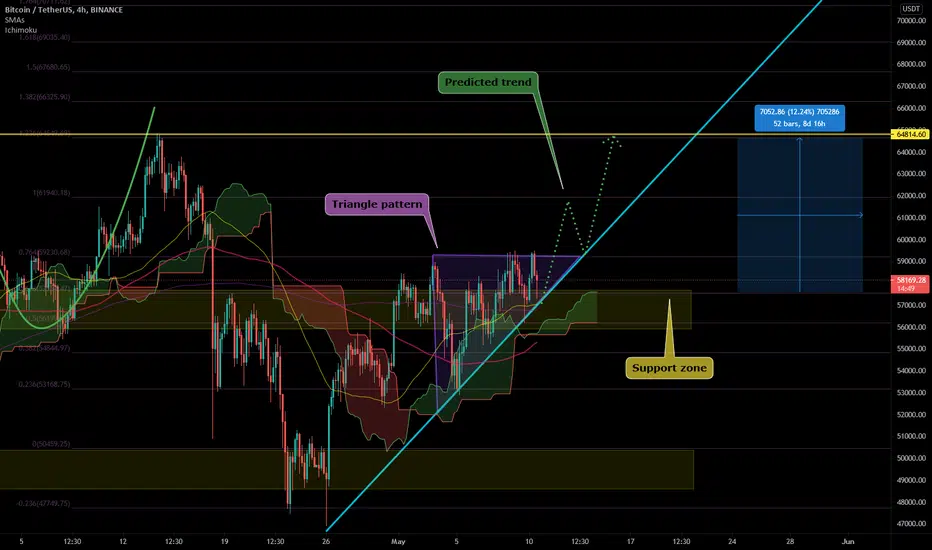
BTCUSDTTrying to get out of the ascending triangle
Fortunately, bitcoin has stabilized somewhat and is now facing some positive outlook.
Chart analysis:
Here, the bitcoin trend has formed an ascending triangle pattern, and at the same time the trend has hit the support zone and the floor of its large channel, so it is expected that with its strong support it can climb and even break the triangle roof and get ready again. To reach about $ 65,000.
LINKUSDTFlight or crash
It is possible that the channel ceiling will be broken and the link currency will try to set a new record.
Due to the fact that the current canal roof has been tested several times by the process, it is possible that the ascent from the canal roof will not take place, and in this case, the price should be expected to fall to the resistance range and continue to fall again after a short break.
