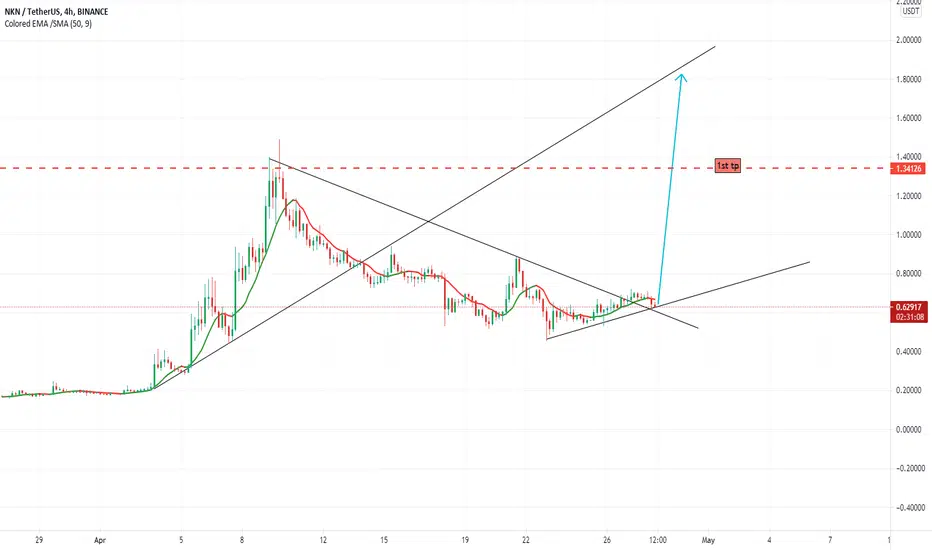
NKNUSDT/4HAfter breakout from down trend we saw a nice pullback on support line. I think we're gonna see last price plus a nice kiss to up trend! We will see!
4h
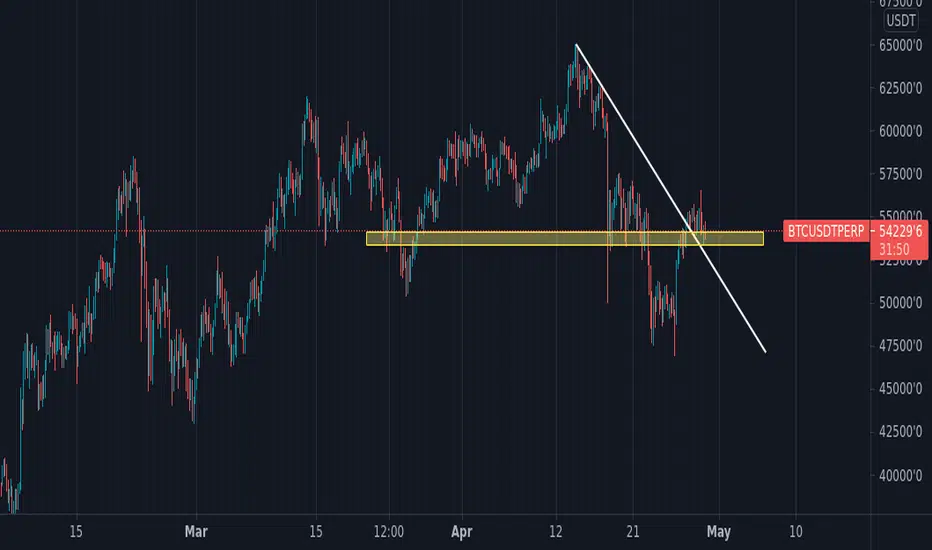
BTCUSD - Rotation Zone - 4H
We're at resistance of 4H and Daily Rotation Zone
40Min has rotated.
A drop here will send us down 15K fairly quickly.
Good luck moon bois.
$IOTA looking bullish helllo! im newto TA but from what i ccan see $IOTA have potential to rise about 25% - 30%


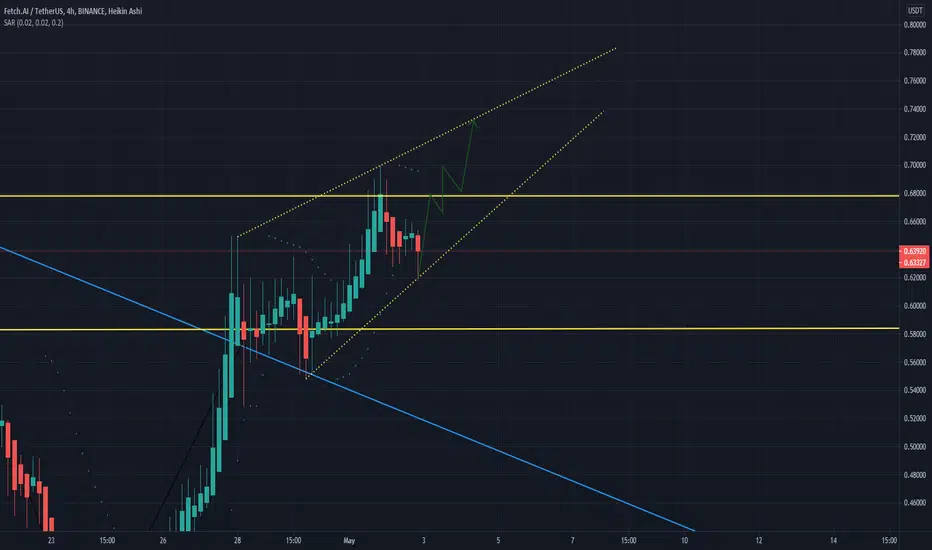
$FET #FET SHORT TERM PRICE PREDICTION 4HAs you can see easily $FET bounced from support. IMO , going to 0.73-0.74
BTCUSDT 4h {Quick Update}Bitcoin Quick Update
Bitcoin brakes the downtrend line and successfully retested it. There is also the demand zone and BTC bouncing from there .no need to panic as long as BTC trading above 53.500.
There is very low sell pressure on exchanges and also public companies are investing in BTC.We are bullish on BTC and we may see a good rally in MAY.Hold your BTC positions.
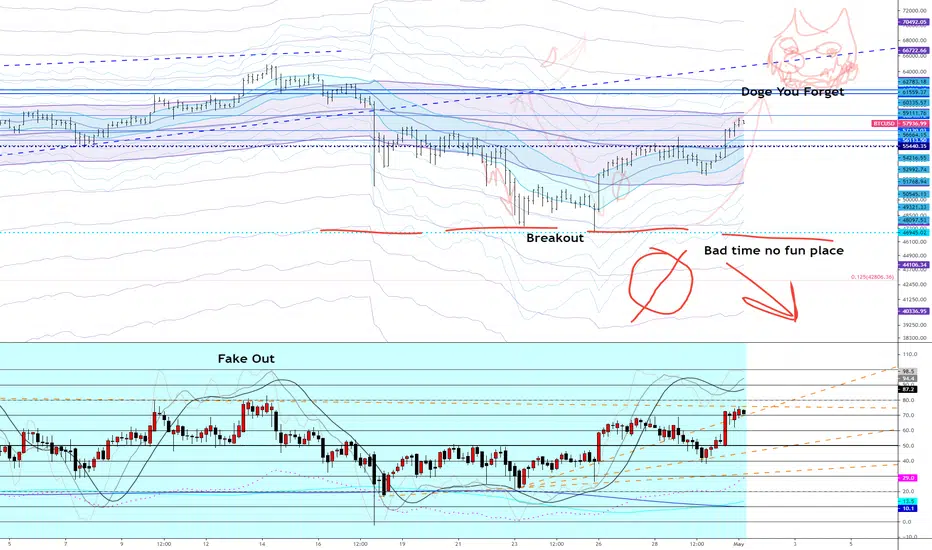
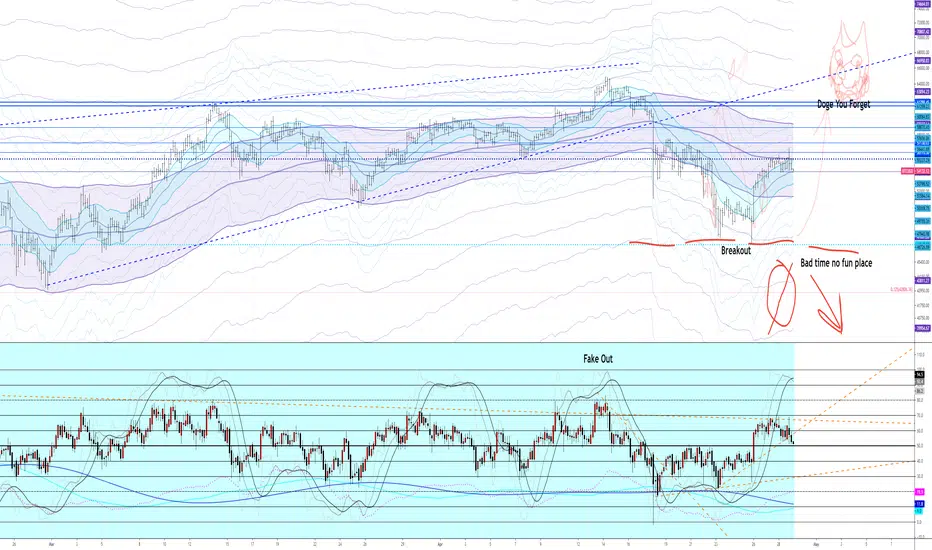
BTCUSD - But I thought we were going to moon? - 4HDo you want to be a bag holder?
Every time, same tricks, different day.
All time high?
Time will tell.
Here we go!
2
(T)op is here, big alt season less likely this time around.
(V)ictory!
The view is great from here!
BTCUSD - So it's time to buy now right? - 4H UpdateDecision Time.
Still holding?
Crucial point on the daily.
Rotation down.
This is not financial advice.
BZRX/USDT - LONGAfter destroying previous resistance, and after returning to the main bullish trend and waiting for the end of the correction, the currency is expected to rise to greater levels.
Exit and stop loss points were divided as shown on the chart, trade safely and slowly


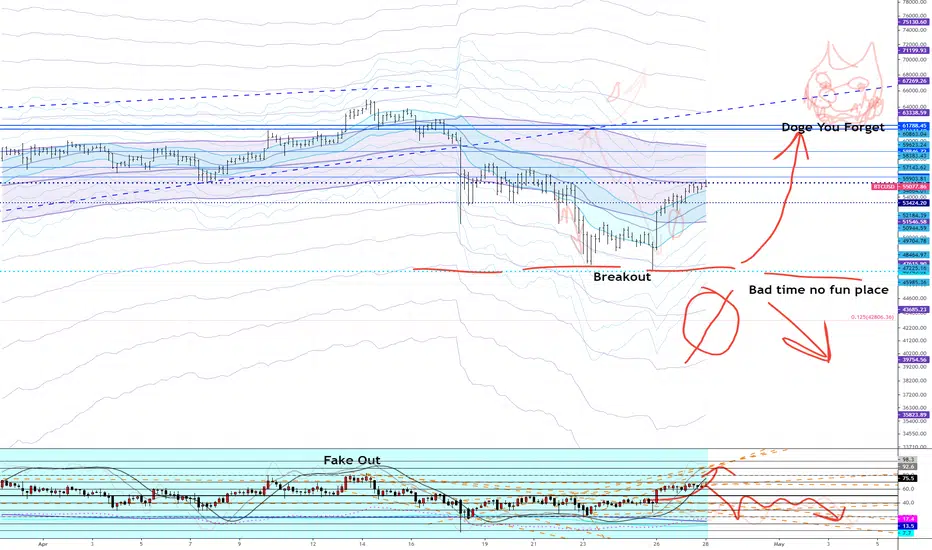
BTCUSD - There's only one direction for Bitcoin - 4H
Which do you think?
Just kidding.
That direction is down, it goes up and down but down she goes.
Bitcoin won't ever be a woman, so sorry for referencing it to a female boat.

XRP - 4H WedgeConsolidating around $1.3 with a wedge pattern, in an uptrend this is usually bullish.
Awaiting confirmation of a breakout upwards to confirm this bias.


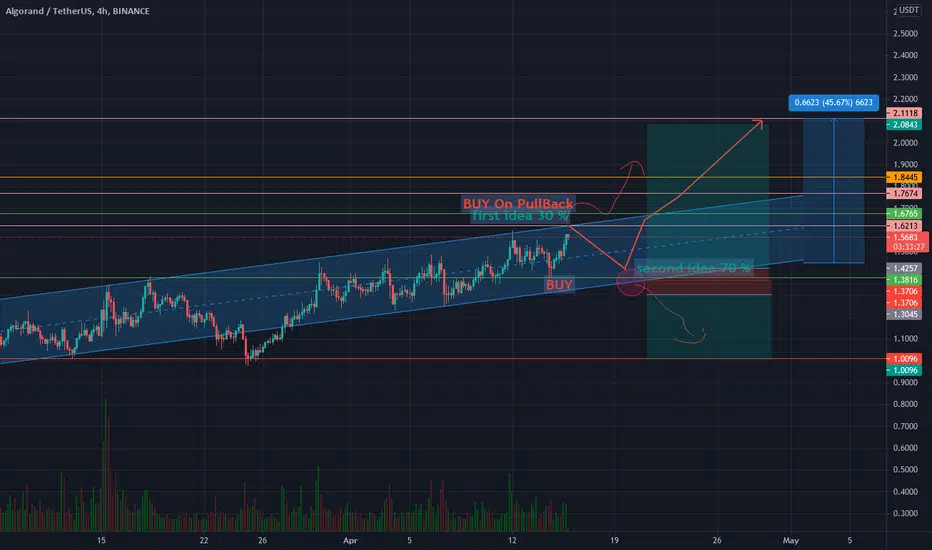
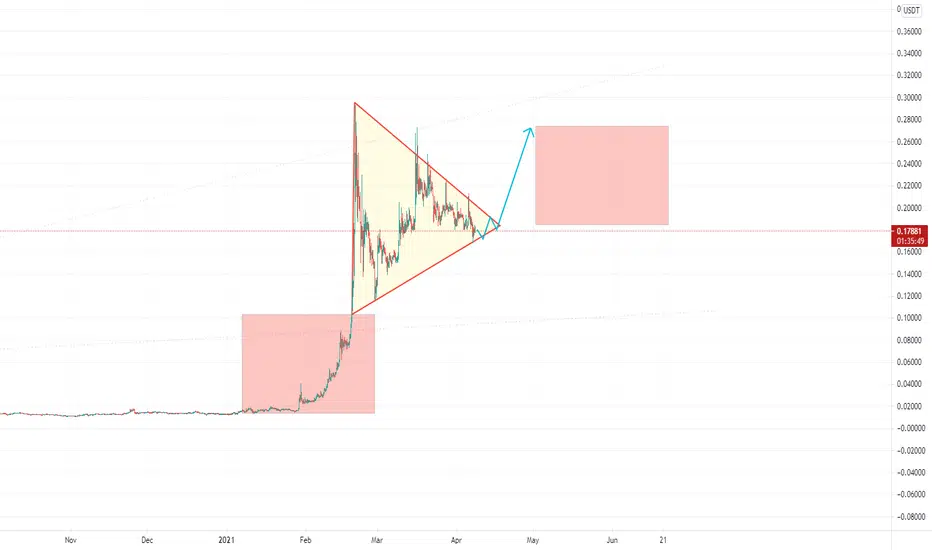
ADAUSDTTriangle pattern is a tool to fly the price of Cardano
As you can see in the chart, the Cardano trend is a triangle that prepares to break the triangle and create a completely uptrend.
In this way, Cardano prepares himself to achieve higher goals.
The area shown in yellow has the support and leverage to push prices, including moving averages and trend lines and the smoothed Ichimoku cloud, and even Fibonacci lines and other supports that Cardano has leaned on in recent trends. Shown. This range will have the power to raise the price to the top of the triangle, but can not guarantee the continuation of the upward trend, but we are optimistic that the triangle pattern will be broken in Cardano's third attempt.

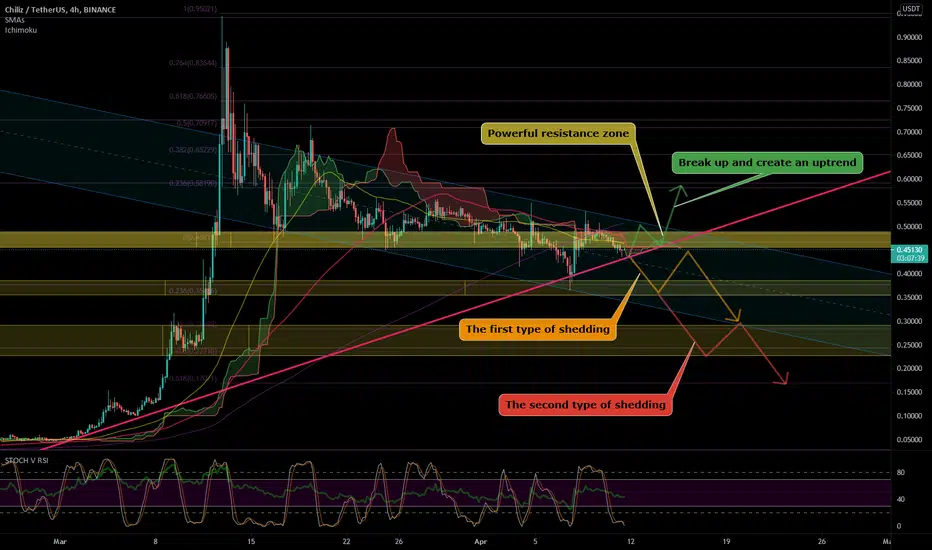
chzusdtIndecision in CHZ
With the fall of this currency in the past month, fear has been created among the investors of this currency, which in a way has left the market undecided for CHZ.
Of course, it should not be forgotten that it has experienced very good growth earlier this year, and this is a correction for its previous trend, and Lee has said in some comments that this downward trend has continued a little longer than expected, and it is likely that this way The descent is slow.
But in some statements, there is a lot of hope for a return to the upward trend in this currency.
Impressions from the chart
As you can see, the 4-hour candlesticks have broken a strong support zone downwards, and now it is possible that this zone will act as a very strong resistance and cause the currency to fall more than before, in which case the price may fall. There that is shown.
But only a big shock can cause a breakout and shape the uptrend, which is possible given the history and rank of this currency.
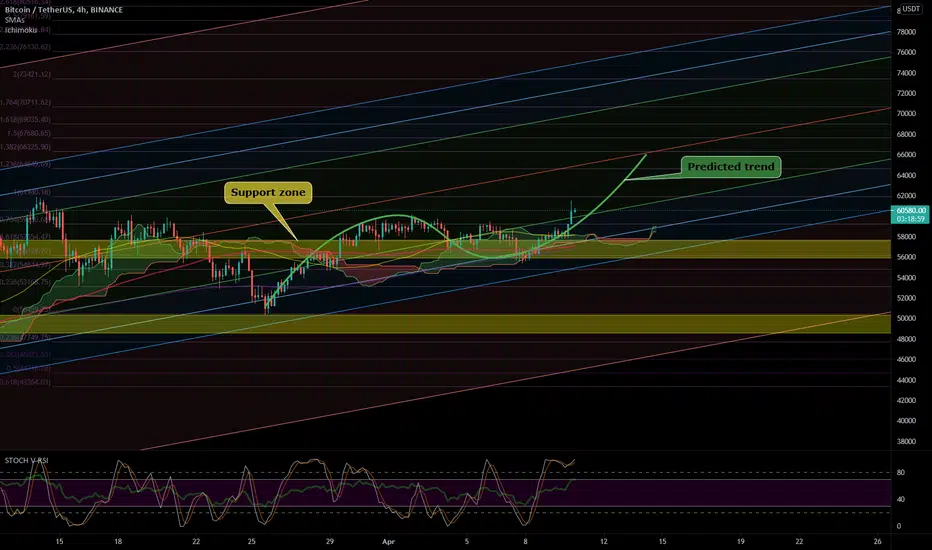
BTCUSDTBitcoin trying to set a new price record
As you can see, Bitcoin has followed a certain trend, which is not too far-fetched,
and it will probably complete this process and at least reach the end of its channel.
But before that it will hit a resistance in the price range of 62,000,
where it may be necessary for the deaf to fall, albeit slightly, and then return to its path.
After the trend reaches the center of the channel, we are expected to face a fall in prices again, but if the uptrend of Bitcoin succeeds in passing through the center of the channel, it will have a few targets ahead.
70,000 - 73,000 - 76,000 - 78,000
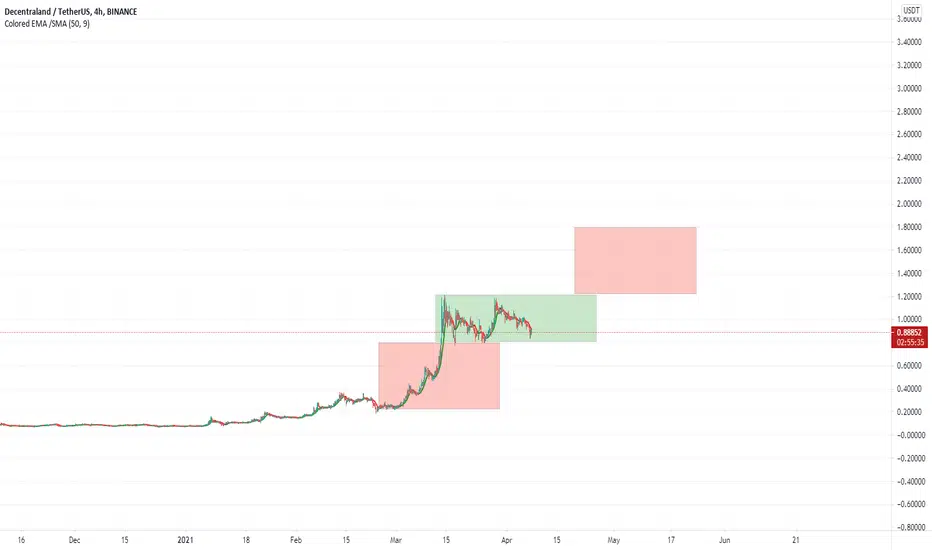
MANAUSDT/4HDoes MANA complete bullish rectangle pattern? we will see!
Target is the rectangle's pole!
UNIUSDTTriangle for climbing
As you can see in the chart, the UNI currency is forming a triangle pattern, and this triangle pattern has a special feature based on the uptrend.
However, if we leave out the triangle pattern. There is another issue that not only resists the fall of
this currency but also supports the rise of the price, which is the support and resistance zone in the price range of 29.8 - 30.3 dollars.
This support zone has a total of several support components, including:
Ichimoku Cloud, Moving Average 50-100-200, Fibonacci 0.76 and Triangle Floor
With the price rising and the upward triangle breaking, the upward trend is expected to continue up to the channel ceiling.
