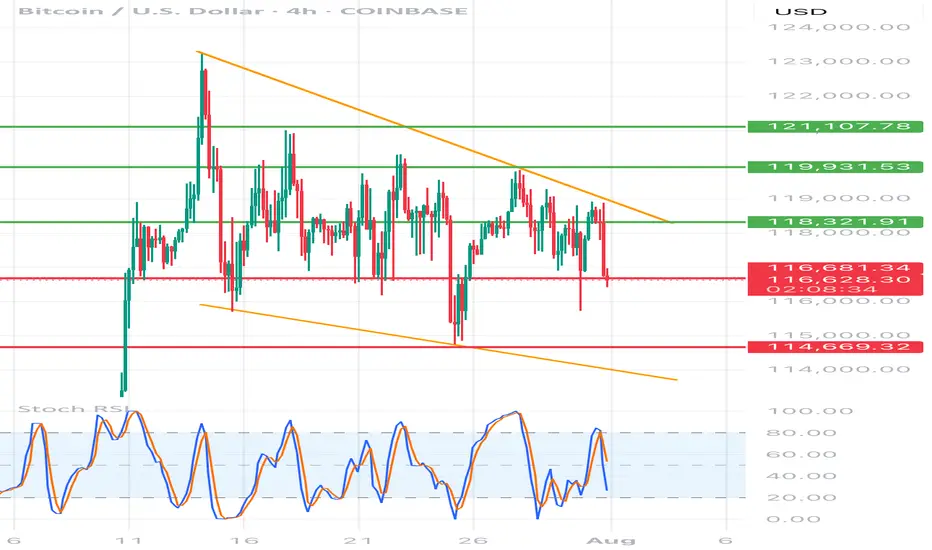
BTC/USD 4h chart🔸 Formation: Triangle descending (descending)
• Upper trend line (orange) - inheritance, connects lower and lower peaks.
• Lower support line (red) - approx. 116,700 USD - key support, tested many times.
🔻 Support
USD 116,700
Tested several times, currently threatened
🔻 Another support
USD 114,669
Target level when struck with a triangle
🔼 Resistance
USD 118,321
The nearest resistance - the former level of support
🔼 Resistance
USD 119,931
Local peak
🔼 Strong resistance
USD 121,107
Upper level of structure
📉 STOCHASTIC RSI (lower indicator)
• Line cutting and a decrease in the purchase area (> 80) towards the center.
• No extreme sales signal, but the trend begins to be negative.
⸻
📌 Applications and possible scenarios:
🔻 Bearish script (more technically likely):
• If BTC breaks below USD 116,700 with a 4H candle closure, possible:
• a decrease around USD 114,669 (lower limit of the triangle)
• Even lower - around 113,500-112,000 USD with an increased volume
🔼 Bullly script (less likely but possible):
• needed quick breaking above USD 118,300 and maintaining above this level
• Then the goal will be USD 119,931, and then possible traffic up to USD 121.107
⸻
📍 Summary:
• We see classic triangle descending-pro-draft formation.
• Support 116,700 USD very close to breaking - if it falls, down movement can be dynamic.
• Stochastic RSI coincides with the deterioration of the moment.
• The inheritance scenario seems dominant, unless there is a strong demand and over 118,300 USD.
4hrchart
MKR/USDT 4H Chart📉 Short-term situation:
The price is currently trading around 2028 USDT, after a sharp decline from around 2273 USDT (resistance).
The support level around 2000 USDT is currently being tested (coinciding with the SMA 200 – blue line).
A dynamic uptrend line (orange) is also visible, which could act as a key support level in the event of further declines.
🔍 Support and Resistance Levels:
Resistance:
🔴 2188 USDT – recent local high and convergence with the SMA 21.
🟢 2273 USDT – major resistance; previous rebound and point of significant price reaction.
Support:
🔵 1980 USDT – local support + SMA200.
🟠 Uptrend line (~1940–1960 USDT).
🔴 1832 USDT – stronger horizontal support with multiple confirmations.
🔴 1623 USDT – very strong support, from previous lows.
📊 Technical indicators:
RSI (Relative Strength Index):
Current value: ~42, neutral, but approaching the oversold zone (<30).
The RSI is falling rapidly, suggesting selling pressure, but a reaction is possible near current support.
MACD:
Negative signal: signal line crossing from above + descending histogram.
Indicates a continuation of the correction, but we are approaching the potential exhaustion of the downward momentum.
📈 Moving averages:
EMA/SMA 50 and 200:
The price is currently testing the SMA200 – crucial for the medium-term trend.
SMA21 (red) and SMA50 (green) – have reversed downward, which may suggest a weakening of bullish momentum.
🔮 Scenarios:
🟢 Bullish scenario (confirmation of support):
A rebound from 1980–2000 USDT and further upward movement.
Potential target: first ~2180 USDT, then ~2273 USDT.
The condition is a demand response at the current level + an improvement in the RSI/MACD.
🔴 Bearish scenario (breakout of support):
If the 1980 USDT level is broken and the price falls below the uptrend line, a continued decline to 1832 USDT or even lower is possible.
Confirmation will be a strong bearish candle with high volume and a further decline in the RSI/MACD.

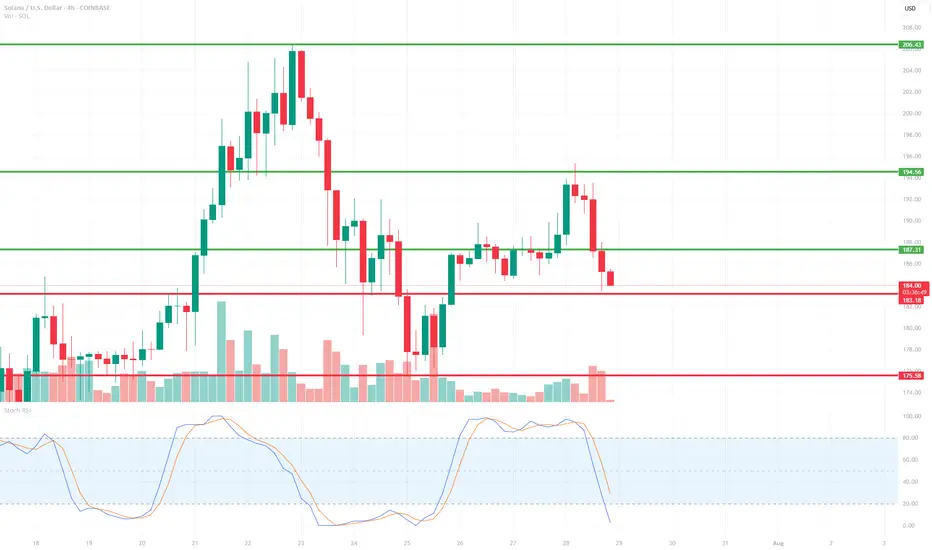
SOL/USD 4H📉 Price
Current price: approximately $183–$184
We see a decline from the resistance zone around $194.56. The price has broken through support at $187.31 and is heading towards lower support at:
🔴 $183.18 – local support (being tested now),
🔴 $175.58 – key support (potential target if current support breaks).
📊 Market structure
Short-term trend: Downtrend (lower highs and lower lows after a rebound from $194.56).
Volume: Increased volume on bearish candles – confirming supply pressure.
Previous trend: Uptrend with strong momentum from July 18th to July 21st.
🔁 Technical Levels
Resistance:
🟢 USD 187.31 – last broken support, now acting as resistance.
🟢 USD 194.56 – strong resistance (tested twice).
🟢 USD 206.43 – local high, strong resistance level from higher timeframes.
Support:
🔴 USD 183.18 – currently being tested.
🔴 USD 175.58 – stronger support from lower swing highs.
📉 Stochastic RSI
Located in the oversold zone (<20) and pointing down.
No upside crossover yet → no buy signal yet.
If a reversal occurs, a technical rebound is possible.
📌 Conclusions and Scenarios
🔻 Downside scenario (more likely currently):
Breakthrough of support at $183.18 ➜ further decline to $175.58.
Potential entry into a correction of the entire upward movement from July 18-21.
🔺 Upside scenario (alternative):
Support at $183.18 held + Stoch RSI signal ➜ rebound to $187.31.
If buying volume increases, a retest of resistance at $194.56 is possible.
ETH/USDT 4H Chart📊 General Context
Ethereum is rising in a strong short-term uptrend, supported by a rising trendline (orange).
Current price: 3831 USDT
We are approaching a significant resistance level around 3842–3850 USDT (green line).
Technical support is located around 3760 USDT (previous consolidation level and 50/200 SMA).
🔍 Technical Levels
Resistance:
3842–3850 USDT – local high, currently being tested.
4006 USDT – key psychological level and the last local high on the chart.
Support:
3762 USDT – previous resistance, currently turned into support (may be tested in a correction).
3650 USDT – strong technical support, confirmed several times in the past.
SMA50 and SMA200 – currently just below the price, also acting as dynamic support.
📈 Technical Indicators
MACD:
The histogram is rising and positive → bullish momentum.
The MACD line crosses the signal line from below → a buy signal.
RSI (14):
Currently: around 64 → not yet overbought, but close to the overbought zone.
Slightly rising trend, but may suggest impending market overheating with further gains.
🧭 Trend
Short-term: strong uptrend (trend line, green candles, breakout from consolidation).
Medium-term: higher lows and higher highs – the uptrend is maintained.
The price is holding above the 50 and 200 SMAs – confirming bullish sentiment.
⚠️ What to watch next?
A 4-hour candle close above 3842 USDT → confirmation of a breakout, a potential attack on 4000–4010 USDT.
A break of the trend line (orange) → a possible correction to 3760 or even 3650 USDT is possible.
An RSI rise above 70 → an overbought signal, a possible pullback or consolidation.

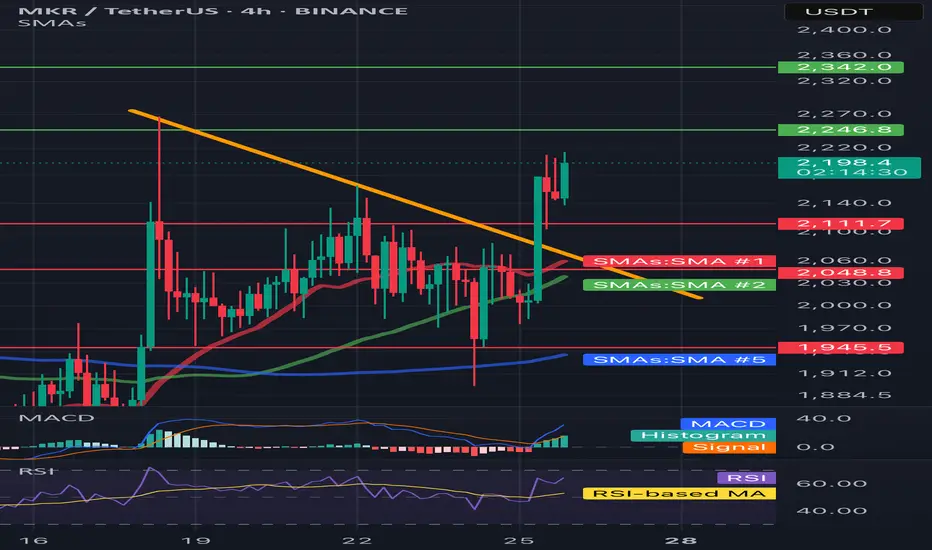
MKR/USDT 4H📈 Trend and price structure
• The price has just been above the downward trend line (yellow line), which suggests the potential reversal of the trend to the upward.
• Breaking was strong - a candle with a large growth volume and an increase +9.13%, which emphasizes the pressure of buyers.
⸻
🔍 levels of support and resistance
• resistance:
• ~ 2342 USDT - a clear level of resistance (green line) - may be the target for the next upward movement.
• 2246.8 USDT - first resistance to overcome.
• Support:
• 2111.7 USDT - level of local support after struggling (earlier resistance).
• 2048.8 USDT - SMA #1 (red medium), can be support at the back.
• 1945.5 USDT - strong support in the form of long -term SMA (blue line, SMA #5).
⸻
📊 Technical indicators
✅ MacD (below)
• The MacD line cut the signal line up - buy signal.
• The histogram is growing, which confirms the growth moment.
✅ RSI
• RSI has bounced from level 40 and is currently above 60 - it suggests upward momentum, but it is not yet purchased, so there may be room for further growth.
⸻
✅ Medium walking (SMAS)
• The price was pierced by SMA #1 (red) and SMA #2 (green) with impetus, which means a change in sentiment.
• If it stays above these medium - a bull signal.
• SMA 50 (green)> SMA 200 (blue) = potentially a golden cross is formed on a longer TF.
⸻
📌 Summary - technical scenario:
🐂 Bycza scenario:
• If the price lasts above 2111.7 USDT, it may continue to increase to USDTt and further up to $ 2,342.
• Confirmation will be the continuation of growth on MacD and RSI over 60-70.
🐻 Bear scenario (threats):
• If the price drops below 2048 USDT, possible correction up to 1945 USDT.
• RSI returning below 50 and Macd Cross down would be a reversal signal.
BTC/USD 4H Chart Review📊 Technical Structure (Symmetrical Triangle)
Formation: The symmetrical triangle (orange lines) remains intact—price continues to move within it.
Approaching the apex: The closer to the intersection of the triangle's arms, the greater the probability of a breakout. The current candle is testing the upper boundary of the formation (around $119,300), but has not yet broken it.
Direction: The formation is neutral, but tension is increasing. A breakout of either line (the upper boundary ≈$119,500 or the lower boundary ≈$117,700) could trigger a dynamic move with a range of around $3,000 (the height of the triangle at its widest point).
🧱 Support and Resistance Levels (Red and Green Lines)
Type Level (USD) Description
Resistance 123205 All-Time High – Possible Target After an Upward Breakout
Resistance 120556 Local Resistance – Triangle Breakout Range
Resistance 119200–119300 Currently Tested Level
Support 117752 Lower Triangle Boundary – Critical Defense Line
Support 115764 Next Local Support
📈 Technical Indicators
🔵 RSI (Relative Strength Index)
Currently: ~55 – indicates a neutral situation, having broken down from the overbought level (~74).
Indicates that the market has temporarily cooled down after a previous impulse. There is still room for further upward movement without exceeding 70.
🔵 MACD
The MACD and signal lines are approaching a crossover – if the MACD crosses the signal line upward, it could be a bullish signal.
The histogram is slightly positive – indicating weak but growing bullish momentum.
📊 Volume
Slightly increasing in the last candles – no confirmation of a strong breakout yet, but upward pressure is building.
🧠 Interpretation
Scenario Technical Conditions Movement Objective
🔼 Upward Breakout
Candlestick close above $119,500 USD 122,000–$123,200 USD
🔽 Downward Breakout
Close below 117,750 and confirmed by volume at 115,700, then 114,000 USD
🔄 Consolidation
Inconclusive, continued sideways movement
Between $117,700 and $119,500 USD
✅ Summary
Bitcoin is still in a neutral symmetrical triangle formation but is approaching a turning point.
The RSI has broken out of the overbought range, and the MACD is signaling a potential upside breakout.
Volume confirmation is still lacking, but technical conditions favor the bulls – if it manages to break above 119,500 and hold above, a move towards 122,000–123,000 USD can be expected.
In the event of a rejection, maintaining 117750 will be key; breaking it opens the way to 115700 and below.

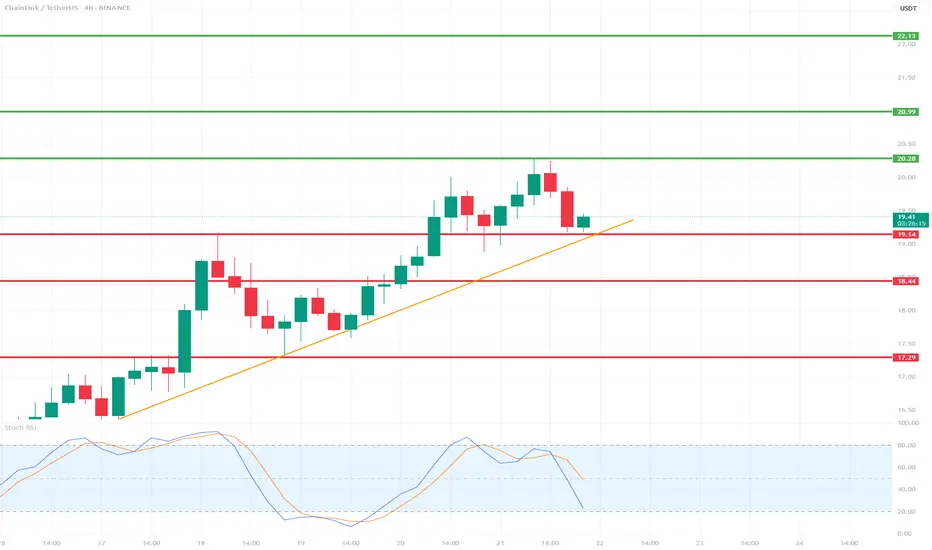
LINK/USDT 4H Chart📉 Indicators and Market Structure:
🔶 Trend:
Current trend: up, as long as it remains above the trend line and the 19.14 USDT level.
Local resistance: 20.28 USDT (recent high).
Next resistances: 20.99 USDT and 22.13 USDT (green lines).
Supports: 19.14 USDT, 18.44 USDT, 17.29 USDT (red lines).
🔷 Stochastic RSI (lower indicator):
Located in the oversold zone (below 20) and starting to reverse upward.
Potential signal of buying pressure if the %K and %D lines cross bullishly.
🧠 Scenarios:
✅ Bullish scenario (trend continuation):
Bounce from the trend line and the 19.14 level → breakout of 20.28 → test of 20.99–22.13.
Confirmation will be a clear bullish candle with high volume and a Stochastic RSI cross up.
❌ Bearish scenario (trend break):
Closing below the trend line and the 19.14 level → correction towards 18.44, and then even to 17.29.
An oversold RSI could support continued declines if a rebound does not occur.
📌 Summary:
Currently, the key level is the trend line and support at 19.14 USDT.
The market is waiting for a reaction – a rebound or a downward breakout.
Stochastic RSI suggests a possible rebound, but candlestick confirmation is needed.
ETH/USDT 4H Chart✅ Market Trend and Structure:
Uptrend: The highlighted orange trend line shows continuous growth since mid-April. The price is trading above the 50- and 200-period moving averages (EMA and SMA), confirming bullish sentiment.
Current price: around 3556 USDT – very close to local highs.
Resistance break in the 3200–3300 USDT area, which now acts as support.
📈 Technical Levels:
Resistance (red horizontal lines):
3600–3650 USDT – local resistance resulting from market reaction.
3888 USDT – next historical resistance level.
4133 USDT – established long-term target (green dashed line at the top).
Support:
3300 USDT – strong support after a previous breakout.
3080 USDT – previous high, now the next support level.
3070 / 2900 USDT – key technical support levels in the event of a larger correction.
📊 Indicators:
MACD:
The MACD is in a strongly bullish zone, but:
The histogram is flattening.
A bearish crossover pattern is possible in the following candles – a signal of weakening momentum.
RSI:
RSI ~74 – is in the overbought zone, which often heralds a correction or at least consolidation.
A value above 70 confirms the bullish trend but may suggest that momentum is overheated.
📌 Conclusions and Scenarios:
🔼 Upside Scenario (trend continuation):
If the price remains above 3300–3350 USDT, it could move towards 3888, and then 4133 USDT.
A break above 3650 USDT on heavy volume will be a strong continuation signal.
🔽 Corrective scenario (short-term pullback):
The RSI and MACD suggest a possible correction.
Potential pullback to:
3300 USDT (retest of previous resistance as support).
SMA 200 (~2600 USDT) with a deeper downward move.

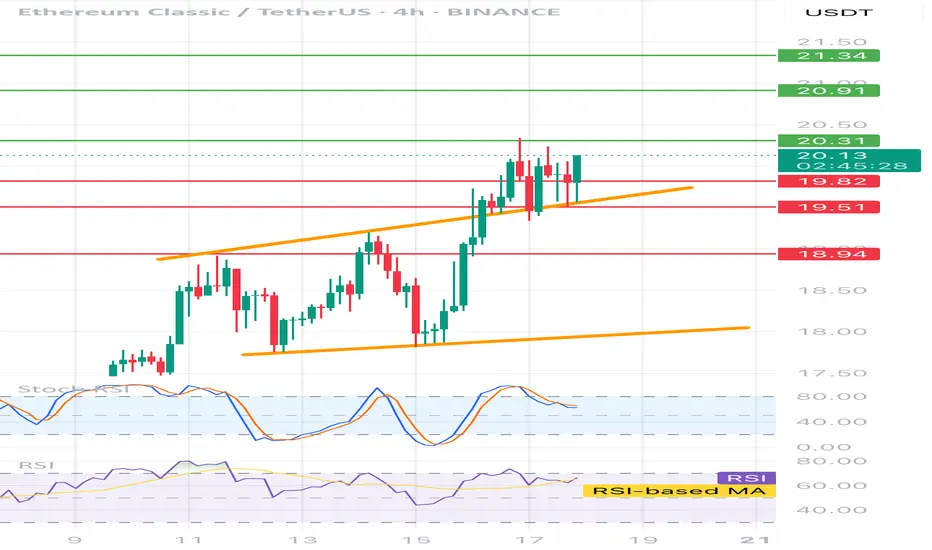
ETCUSDT 4H📊 Price:
Currently around 20.05 USDT
⸻
🔶 Technical formation:
• Ascending channel - clearly marked with two orange trend lines.
• The price is currently testing the upper edge of the channel - it is possible to break or correction.
⸻
📉 Support and resistance:
• ✅ Support:
• 19.73 (local, on the closure of the candles)
• 19.51 (technical, tested several times)
• 18.94 (stronger, historical)
• 🚫 resistance:
• 20.31 - the closest local resistance
• 20.91 - key level
• 21.34 - strong resistance from higher intervals
⸻
🔄 oscillators:
• STOCHASTIC RSI - in the inheritance phase (descent from buying), possible local decline / correction.
• RSI (14) - approx. 60, slightly positive trend, but without exaggeration - no purchase, place for further increases.
📌 Fast strategy:
• 🟢 Long: After breaking and Retescia 20.31 → TP 20.91 / 21.34
• 🔴 Short: after rejection 20.31 or the upper line of the channel → TP 19.73 / 19.51
• 📉 SL: In both cases, it is best 0.3–0.4% above the last high/low
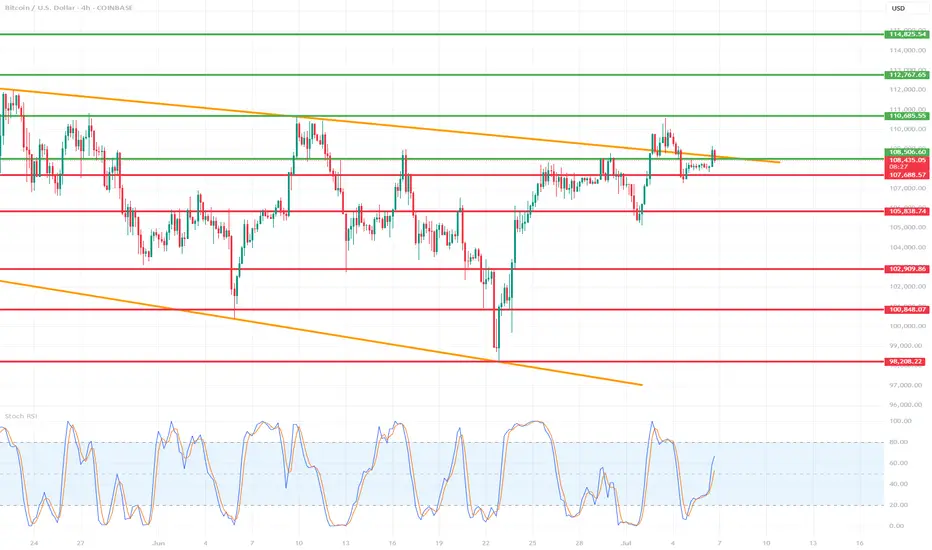
Is BTC getting ready for a new ATH?🔍 1. Key Support and Resistance Levels (Horizontal Lines):
🟢 Resistances (Green Lines):
114,295.54 — strong resistance resulting from previous highs.
112,767.65
111,009.00
110,685.35 — current key level that price may try to retest after a potential breakout.
🔴 Supports (Red Lines):
108,496.55 — current level being tested, also coinciding with local resistance from the past.
107,687.57
105,888.74
102,909.85
100,848.07
98,208.22 — strong long-term support; in the past, this level was reacted with a strong bounce.
🔶 2. Downtrend channel marked with orange lines:
The upper downtrend line acted as resistance.
The lower uptrend line acted as support.
The price recently broke above the upper line, but is now testing it again - this could be a retrospective retest.
➡️ If the close of the H4 candle is above this line - a possible confirmation of the breakout.
📊 3. Stochastic RSI indicator (at the bottom of the chart):
Currently in the uptrend phase after a bounce from the oversold level (<20).
The %K line (blue) is crossed upwards by the %D line (orange) - a bullish signal.
Still below the overbought zone, which suggests that the potential uptrend still has room to develop.
🧠 4. Market structure and price action:
Price broke above the 108.496 level, but is currently struggling to stay above this zone.
A retest of the broken triangle could be a healthy move, provided that support is maintained in the 108k–107.6k area.
A break below and a close below 107.6k could mean a false breakout and a possible decline towards 105.8k or even 102.9k.
🧭 5. Possible scenarios:
✅ Bullish scenario:
Maintaining the 108.496 level and closing the candle above the upper orange line → continued growth.
The nearest targets are:
110.685 (first resistance),
111.009 and 112.767 next.
❌ Bearish scenario:
The price will not stay above 108k and will fall below 107.687.
Possible return to the previous consolidation range with the target:
105.888,
and then 102.909 or 100.848.
🧮 Summary:
Currently, the decisive moment is underway: a test of support after breaking out of the convergent triangle.
The Stoch RSI indicator gives a bullish signal, but the price must confirm the movement by behaving above 108k.
Retest and bounce - this is a bullish scenario.
A breakdown and return under the trend line - means that the breakout was false.
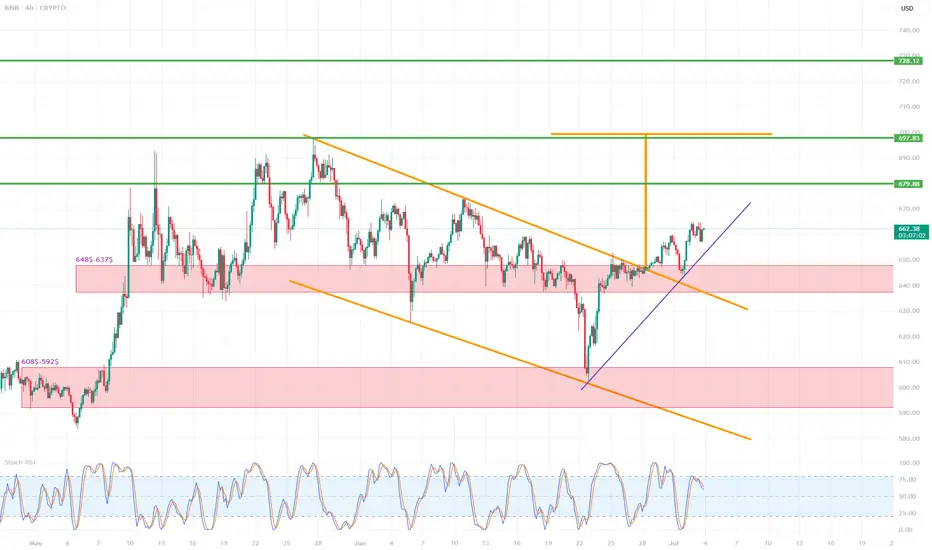
BNB/USD (4h interval)🔍 1. Chart structure
Instrument: Binance Coin / USD (BNB/USD)
Interval: 4 hours
📐 2. Technical formations
🔸 Breakout from the descending wedge formation
The descending wedge (orange lines) is a bullish formation - it suggests a potential breakout upwards.
The breakout occurred dynamically, with a large breakout candle (confirmation of the formation).
The goal of breaking out of the wedge is usually the height of the entire formation - this is marked with an orange arrow.
📈 Breakout range (target): around $697–710
🟢 Potential next targets:
697.83 (local resistance/projection result)
710.73 (main wedge height projection)
728.12 (strong resistance from history)
📊 3. Supports and resistances
🟥 Support zones (red rectangles):
$648.5–637.5 – previous resistance, now tested as support after the breakout.
$608.5–592.5 – strong support from previous lows.
🔼 Currently, the price has tested the upper support zone (648–637), reacted positively and continues to move up.
🟩 Resistance levels (green horizontal lines):
679.88 USD – local resistance, first target after breaking out of the wedge.
697.83 USD – projected range from the formation.
710.73 USD – full technical range of the breakout.
728.12 USD – strong resistance from history, may be a long-term target.
📉 4. Trends and support lines
Purple upward trend line – currently the price is above, which confirms the short-term upward trend.
Its break may lead to a retest of 648–637 USD.
Only below this zone can a larger correction be considered.
📈 5. Stochastic RSI indicator
Currently in the overbought zone (above 80).
Possible temporary cooling – signal for local correction / consolidation.
It is worth waiting for the indicator to go down to around 20 to re-enter the long.
✅ 6. Scenarios
🔼 Bullish (base) scenario:
Staying above 648–637 USD.
Maintaining the uptrend line.
Continuation to 679.88 → 697.83 → 710.73.
🔽 Bearish scenario:
Breaking the purple trend line.
Returning below 648 USD → going down to the 608–592 zone.
Negation of the breakout from the wedge.
📌 Final conclusions
Breaking out from the descending wedge is a strong pro-growth signal.
The price behaves in accordance with technical analysis, testing the previous resistance as support.
Currently, the retest and consolidation phase is underway – maintaining the trend line and the level of $648 will be key.
The medium-term target is $697–710.
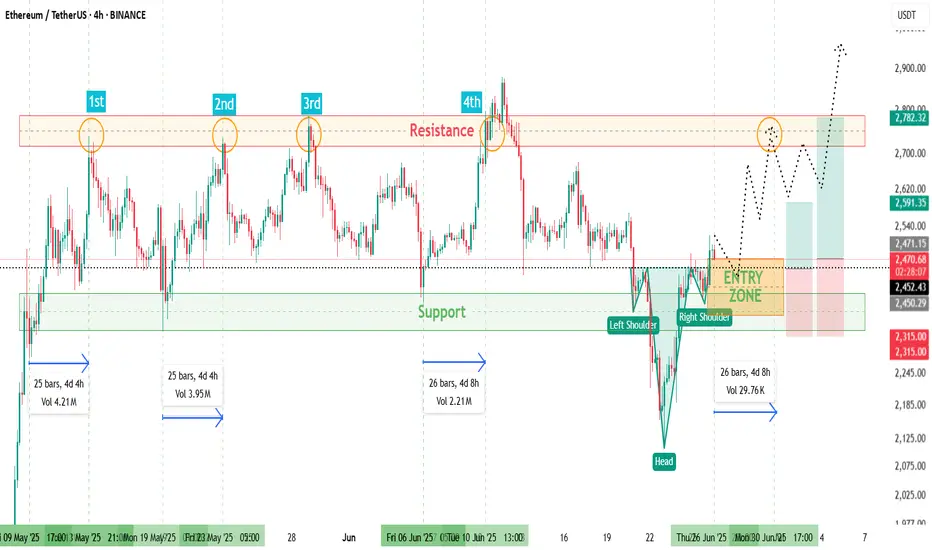
ETHUSD📊 ETH/USD 4H Trade Setup For Long
🔍 Watching an Inverse Head & Shoulders 🫱🫳👤
🔼 Entry: At Fib levels or marked zone
🛡️ Stop Loss: Below support / right shoulder
⏳ Time to Move: ~4 to 5 days from Support ➡️ Resistance
🚪 Tried to break major resistance 4 times
🌍 Geopolitical tensions 🌐 caused pullback
⚡ Now, resistance is weakening —
💥 Breakout likely
🎯 High Risk:Reward setup
📈 Get ready for the move!
MKR/USDT (MakerDAO) on the 4H time frame🔷 1. Trend and market structure
🔸 Upward channel:
The price is moving in a wide, ascending channel (orange lines).
The lower line of the channel was last tested on June 22, 2025, which ended with a dynamic upward bounce.
The upper limit of the channel reaches around 2,450 USDT.
🕸️ Market phase:
In the short term, the market was in a downward correction phase within the uptrend.
Currently, we see a strong rebound from support - a new uptrend is possible.
🔷 2. Key horizontal levels (support/resistance)
🟥 Support:
1,637 USDT - local support (the lowest level of the red zone), almost tested at the bottom.
1,717 USDT - very technical support, tested several times.
1,800 USDT – psychological level and local consolidation.
1,901 USDT – last support peak, currently broken upwards.
🟩 Resistances:
2,003 USDT – current price level, currently tested as new resistance.
2,129 USDT – strong resistance from previous peaks.
2,264 USDT – previous swing high.
2,433 USDT – upper boundary of the channel and technical level from historical peaks.
🔷 3. Price and candle behavior
Strong demand reaction at the lower boundary of the channel: long pin bar/bull's embrace at the lower boundary.
The upward movement was dynamic and uniform, which indicates high buyer activity.
If the price stays above 1,901 USDT – further increases are possible.
🔷 4. Technical indicators
🔁 Stochastic RSI (4H):
Currently in the overbought zone, just below the level of 100 - a temporary correction or consolidation may occur.
However, with a strong upward trend, Stoch RSI may "stick" to the upper band - it does not yet give a clear S/S signal.
🔷 5. Technical scenarios
🟢 Bullish scenario (continuation of growth):
Condition: maintaining the level above 1,901 USDT.
Targets:
TP1: 2,129 USDT
TP2: 2,264 USDT
TP3: 2,433 USDT (upper limit of the channel)
Stop-loss: below 1,800 USDT
🔴 Bearish scenario (rejection of resistance):
Condition: strong rejection of 2,003 USDT and return below 1,901
Targets:
TP1: 1,800 USDT
TP2: 1,717 USDT
TP3: 1,637 USDT
SL: return above 2,003 USDT
🔷 6. Final remarks
The current upward movement looks like a "V-shape reversal" reaction - a sharp turnaround with dynamic volume suggests strong buyer interest.
The key will be the reaction to 2,003 USDT - a breakout and retest can give a very good long entry.
Short positions are risky as long as the price is in the lower half of the ascending channel.

BTC/USD Analysis – 4H Interval (Sample Workflow)BTC/USD Analysis – 4H Interval (Sample Workflow)
Note: I do not have access to the exact 4H chart from your screenshot, so I will perform the analysis based on the current market situation and typical price zones and setups that are worth following (you can apply them to your chart in TradingView).
📊1. Support and resistance zones
Resistance: 110,000 USD
(the last local peak and the place where a strong supply reaction was visible)
Support: 105,000 USD
(the place of the highest volumes and previous bounces, supported by POC levels from your screenshot)
Next support: 103,000 USD
(important level resulting from previous consolidations)
🔍2. Trend & Price Action
Direction: In the short term, the uptrend dominates (a series of higher lows and highs), but a stronger supply wick has appeared - a local pullback is possible.
Observe: Possible correction to the nearest support zones, rebound from POC/VAL/VAH levels.
Price channels: You can draw a rectangle (channel) between 107,000 and 110,000 as the current volatility range.
📌3. Indicators
Stochastic Oscillator: Close to the overbought zone (above 75) - a signal of a possible short-term pullback.
CHOP (Choppiness Index): Low - suggests that the market has just moved from consolidation to a trend (another strong movement after the correction may develop).
📊4. Candlestick structures
Last H4 candle: Long upper shadow (a possible signal of demand exhaustion).
Watch:
Reversal patterns (e.g. pinbar, engulfing) on support/resistance zones.
🧠5. Scenarios and levels to watch
Bull scenario
Breakout of resistance 110,000 USD → possible quick move to 112,000–114,000 USD.
Condition: Increased volume and closing of 4H candle above resistance.
Bearish scenario
Bounce from 110,000 USD and drop to 107,000 or 105,000 USD.
If 105,000 USD is broken, possible retest of 103,000 USD.
Detailed analysis of the BTC/USD 4H chart🔍1. Chart Context
Interval: 4 hours (H4)
Current price: Around 104,950 – 105,400 USD
Range of recent candles: Strong rebound after a decline to around 101,000 USD.
Lower indicator: Stochastic RSI
📊2. Price Action Analysis
Market structure
Main trend (recent days): Downtrend – from the peaks of ~114,000 USD a clear sequence of lower highs and lower lows.
Recent hours: Dynamic decline, followed by a quick, strong rebound from around 101,000 USD to ~105,000 USD.
Key technical levels
✅Resistance:
~105,500–106,000 USD – local peak of the last rebound wave and earlier lows from the end of May.
~108,000 USD – next key level, with a bigger upward movement.
Support:
~102,000–101,000 USD – bottom of the last movement, quick demand reaction, so-called “stop run” or false breakout.
~99,000 USD – psychological zone and important level in case of further declines.
📊3. Indicators
Stochastic RSI (bottom of the chart)
Currently: Stochastic RSI strongly overbought (above 80 points), both lines (blue and orange) are at the top and slightly curling.
Conclusion: Possible short-term correction/slowdown in growth. Overbought Stochastic RSI often precedes pullbacks, especially when testing important resistances.
🧠4. Possible scenarios
Bulls – Upside scenario:
If BTC breaks above $105,500 with momentum, a move to $106,000–108,000 is possible (another resistance and short squeeze).
The key will be the closing of the 4h candle above $105,500.
Bears – Downside scenario:
If the price does not break $105,500, profit taking and a pullback to $103,000–102,000 are possible.
Strong defense of the $101,000–102,000 level by the bulls – if it is broken again, it threatens to deepen the declines even to $99,000.
📊5. Additional Notes
Reduced Volatility: After such a strong bounce, there is often a period of “calmness” and consolidation.
Potential Traps: False breakouts for 4h and sudden changes in direction (characteristic of the crypto market).
📌6. Warning Signals
Stochastic RSI overbought – suggests to be cautious with long positions “on the top” without additional confirmation.
Lack of continuation after a strong bounce – if the price does not “reach” higher in the next candles, the risk of a correction increases.
🧠Summary:
Currently: BTC/USD in a short-term bounce phase after a strong decline. The price is approaching a significant resistance (~105,500 USD). Stochastic RSI shows overbought – possible correction or sideways movement.
Direction for the next few hours: Reactions at USD 105,500 (resistance) and ~USD 102,000 (support) will be key.
BTC/USD 4h Char ReviewHello everyone, I invite you to review the current situation on BTC taking into account the 4-hour interval. We can see how the price is maintained just below the upward trend line, while a downward trend channel may be forming locally.
Here you can see how the price decline is maintained in a strong support zone from $ 105,000 to $ 103,150, however, if the support zone is broken, the price may quickly fall to the support area at $ 100,700
Looking the other way, you can see that when the trend reverses, we first have resistance at $ 106,560, the next is at $ 108,590, and then you can see very strong resistance at the level of the last ATH in the area of $ 112,000.
On the MACD indicator and the RSI indicator, you can see how we are maintaining in the lower part of the range, which indicates that the price bounce is still taking place to continue the growth.

Will BTC hold its price?Hello everyone, I invite you to review the current situation on BTC. When we enter the four-hour interval, we can see how the BTC price has left the ongoing upward trend line at the bottom, and what's more, we can see how the current movement is creating a local downward trend channel in which the price is currently on the border of the previously created upward trend channel, which gives a strong support point.
Here we can see how the current downward movement has entered the support circle that starts around $ 104,800 and ends around $ 102,200, this is the place where two conflicting channels have converged. If these supports do not hold the price, we can see a quick recovery to around $ 98,000, and then to the level of $ 93,900.
Looking the other way, we can see that when the trend reverses, we first have resistance at $107,670, then a resistance zone from $110,000 to $111,700 is visible, at the border of two channels, and then resistance is visible around $113,800.
On the MACD indicator, we can see a return to the downtrend, while on the RSI we return to the lower part at the lower border, which could potentially provide energy for a future upward movement.
BTC/USD 4h Chart ReviewHello everyone, I invite you to review the current situation on BTC. When we enter the four-hour interval, we can see how the BTC price is moving in the upward trend channel, in which several upward waves can be marked, which may indicate the beginning of another wave of growth.
Here you can see how the current rebound has brought the movement closer to a strong resistance zone from $ 110,400 to $ 113,200, only breaking out of this zone on top can give the price an increase in the area of strong resistance at $ 121,000.
Looking the other way, you can see that when the trend reverses, we first have a support zone from $ 106,600 to $ 105,400, however, if this zone is broken, we can see a quick return of the price to the area of strong support at $ 102,000.
The RSI indicator shows how a support line was formed from which the indicator bounced many times, giving the price an increase, while the MACD indicator maintained the upward trend and created room for another upward movement when the price recovered.

LINK/USDT 4H Chart ReviewHello everyone, let's look at the 4H chart LINK to USDT, in this situation we can see how the price was moving in a downward channel, from which we saw an exit to the top and the formation of a new local uptrend line.
Let's start by defining the targets for the near future that the price has to face:
T1 = 15.08 USD
T2 = 16.87 USD
Т3 = 17.93 USD
Т4 = 19.07 USD
Now let's move on to the stop-loss in case the market continues to fall:
SL1 = 13.98 USD
SL2 = 13.12 USD
SL3 = 11.74 USD
SL4 = 10.76 USD
SL5 = 9.48 USD
If we look at the RSI indicator we can see how the price correction gave a strong rebound on the indicator, which could potentially give strength for new growth.

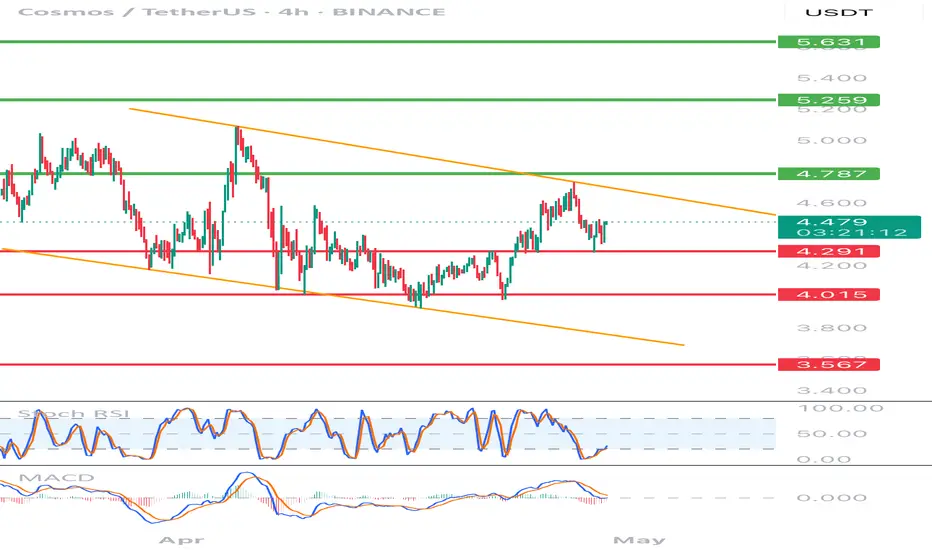
ATOM/USDT review chart 4HHello everyone, let's look at the 4H ATOM chart for USDT, in this situation we can see how the price has affected from the upper limit of the downward trend channel, however, staying in the upper part of the channel. Going further, let's check the places of potential target for the price:
T1 = $ 4.79
T2 = $ 5,26
Т3 = 5.63 $
Let's go to Stop-Loss now in case of further declines on the market:
SL1 = $ 4.29
SL2 = $ 4.02
SL3 = $ 3,57
Looking at the RSI indicator, you can see a healthy relaxation crossing the lower limit, which produces space for a potentially new growth movement. The MacD indicator that has returned to the center of the range, which also creates potential for upward movement.
ETH gives a strong exit from the descending channel!Hello everyone, I invite you to review the current situation on ETH, because you can see a significant rebound at the level of 30% from the last low. When we enter the four-hour interval, we can see how the ETH price moved in the local downtrend channel, from which we got an exit at the top, such a scenario often gives increases at the level of the channel height, which would bring the price closer to the levels of $ 2100.
Here you can see how the current rebound brought the movement closer to the resistance at the level of $ 1830, and then resistance is visible at the price of $ 1950, where the ETH price must then face a strong resistance zone from $ 2060 to $ 2100, where there could potentially be an upward movement after leaving the channel as in this case.
Looking the other way, you can see that when the trend reverses, we first have support at the level of $ 1730, but if it is broken, the ETH price may continue to fall and return to a strong support zone from $ 1480 to $ 1380.
It is worth paying attention to the MACD and RSI indicators because you can see how in the 4H interval we have gone beyond the upper limits of the ranges, which may translate into visible price consolidation on the chart in order to cool the situation.

#FARTCOINUSDT is set for a bearish scenario📉 SHORT # BYBIT:FARTCOINUSDT.P from $0.7376
🛡 Stop loss: $0.7830
🕒 Timeframes: 1H + 4H
✅ Overview:
➡️ On the 4H chart BYBIT:FARTCOINUSDT.P , price broke down from the Bullish Flag, thereby invalidating the bullish scenario.
➡️ The Top 2 formation failed to break the previous high, confirming a bearish structure.
➡️ The $0.7822 level was broken and now acts as resistance — currently being retested.
➡️ The current entry at $0.7376 is optimal after a weak bounce, with high downside potential.
➡️ Volume increased on the red candles, confirming that sellers are in control.
➡️ Support levels are at $0.7172, $0.6970, and $0.6765. The main target lies near the volume-based POC at $0.5269 (in the next stage).
🎯 TP Targets:
💎 TP 1: $0.7172
💎 TP 2: $0.6970
💎 TP 3: $0.6765
📢 The bearish scenario is confirmed. A continuation of the downtrend is expected.
📢 The channel breakdown and weak bounce with declining volume are strong confirmation signals for entry.
📢 Stop-loss is placed above the rejection zone.
📢 Local VPVR and price structure confirm seller pressure in this area.
🚫 Long positions are not valid at the moment — no reversal patterns or confirmations above volume resistances.
🚀 BYBIT:FARTCOINUSDT.P is set for a bearish scenario — downward movement is the priority! Watch price action and manage your levels carefully!

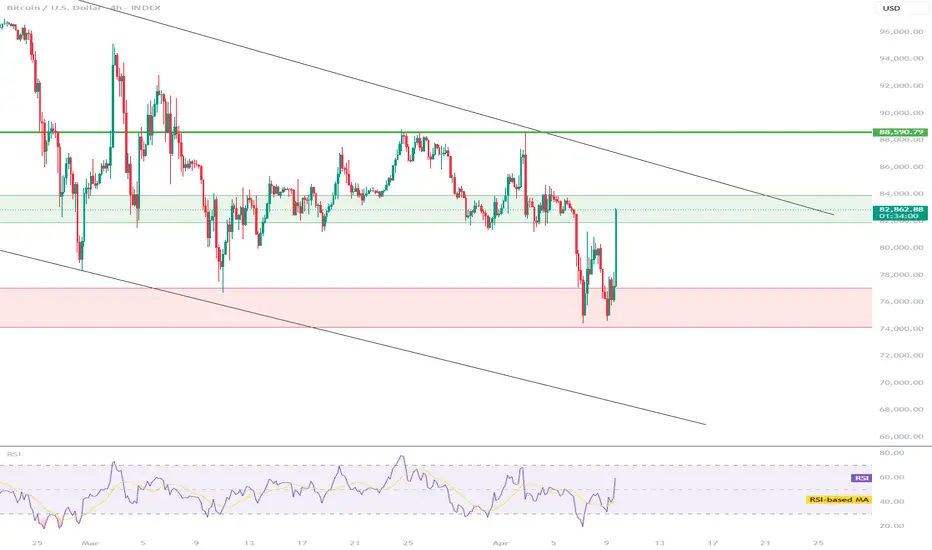
Will BTC emerge from the resistance zone on top?BTC bounced off an important support zone at $74,154 - $77,050 and we are currently seeing a very strong upward movement at the 10% level. It is also clear that the price drop created a higher low and the upward impulse gave a higher high, which is positive in the short term for continued growth.
However, you need to be careful here because the BTC price has entered a strong resistance zone from $81,900 to $83,900, only breaking out of this zone on top will open the way towards $89,000.
It is worth paying attention to the RSI indicator, which confirms the dynamic movement, but considering the 4H interval, there is still room for the price to overcome the zone on top.