Apple Stock Falls Despite Strong EarningsApple stock is down more than 4% in the final session of the week, following the company’s earnings release yesterday. Apple reported earnings per share of $1.57, beating expectations of $1.43, while total revenue reached $94.04 billion, surpassing the $89.53 billion forecasted by the market.
However, despite the strong results, the stock is once again facing a notable short-term bearish bias as investor concerns grow. The primary issue is the perception that Apple is falling behind in the race for artificial intelligence, especially compared to its main competitors. In addition, shortly after the earnings announcement, it was noted that the company may face challenges in sustaining growth throughout the remainder of 2025, which has fueled additional downward pressure on the stock.
Sideways Range Emerges
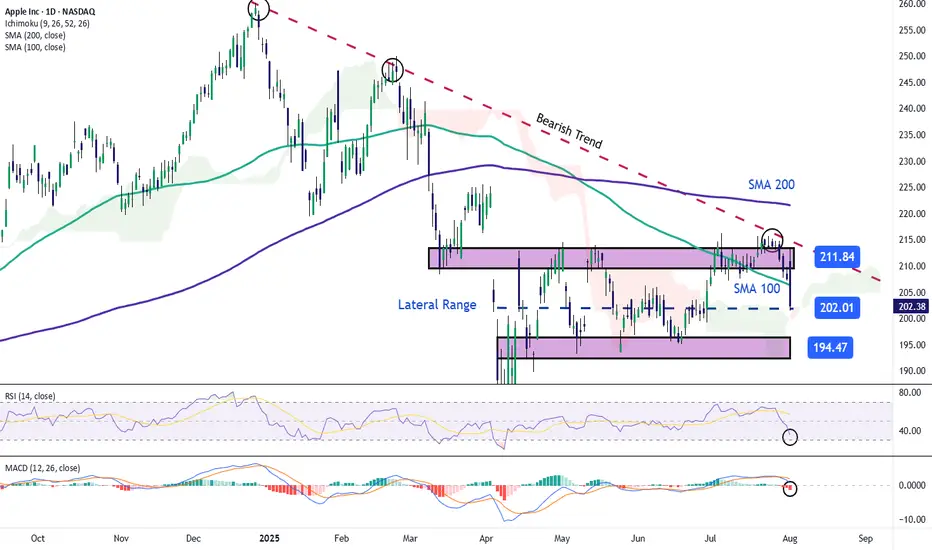
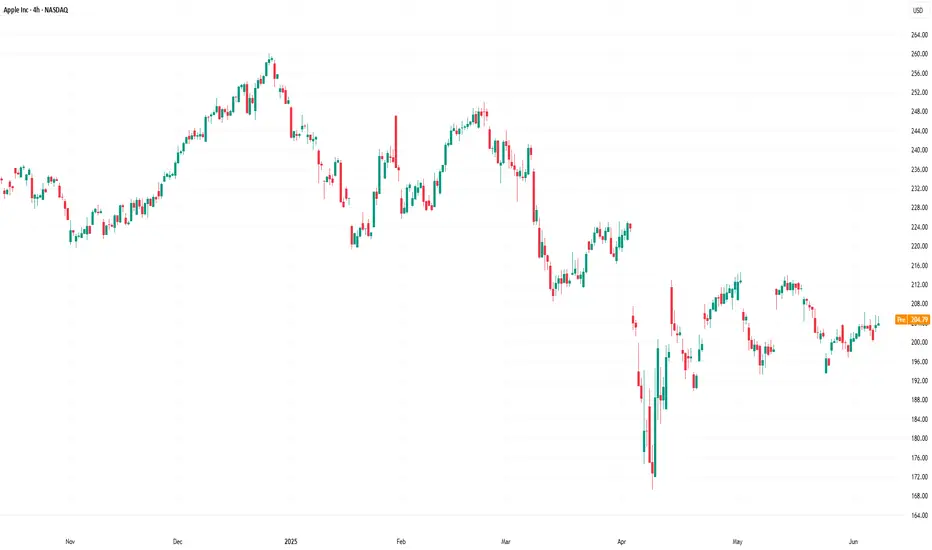
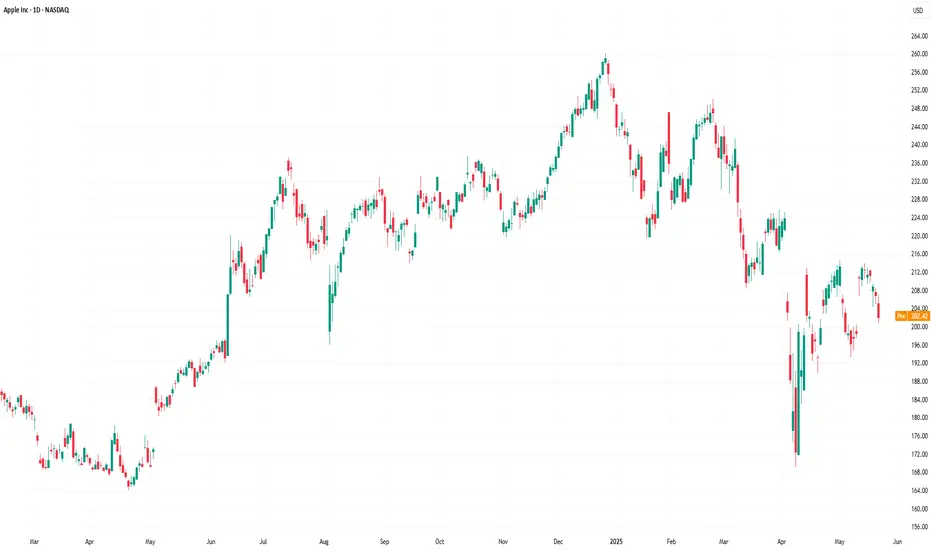
In recent weeks, Apple’s price action has consolidated within a clear lateral range, with resistance around $211 and support near $194. So far, price fluctuations have not been strong enough to break this structure, and the latest bearish candlestick has reinforced the validity of the channel. For now, this sideways range remains the most relevant technical formation to watch in the upcoming sessions.
Technical Indicators
RSI:
The RSI line is falling rapidly and is now approaching the oversold zone at the 30 level. If the indicator reaches that threshold, it could suggest a technical imbalance, opening the door to a short-term bullish correction.
MACD:
The MACD histogram has moved into negative territory in recent sessions, suggesting a clear dominance of bearish momentum in the moving average structure. If this persists, selling pressure may continue to build in the near term.
Key Levels to Watch:
$211 – Main Resistance: Upper boundary of the current range. A breakout above this level could trigger a stronger bullish trend.
$200 – Psychological Support: Round number zone, a breakdown here could activate an immediate bearish bias for the next sessions.
$194 – Key Support: Corresponds to recent weekly lows. A move below this level would likely confirm a more extended bearish trend.
Written by Julian Pineda, CFA – Market Analyst
Aaple
Apple (AAPL) Shares Jump Following Earnings ReportApple (AAPL) Shares Jump Following Earnings Report
Yesterday, after the close of the regular trading session, Apple released its earnings report, which surpassed analysts’ expectations:
→ Earnings per share: actual = $1.57, forecast = $1.43;
→ Revenue: actual = $94.04 billion, forecast = $89.35 billion.
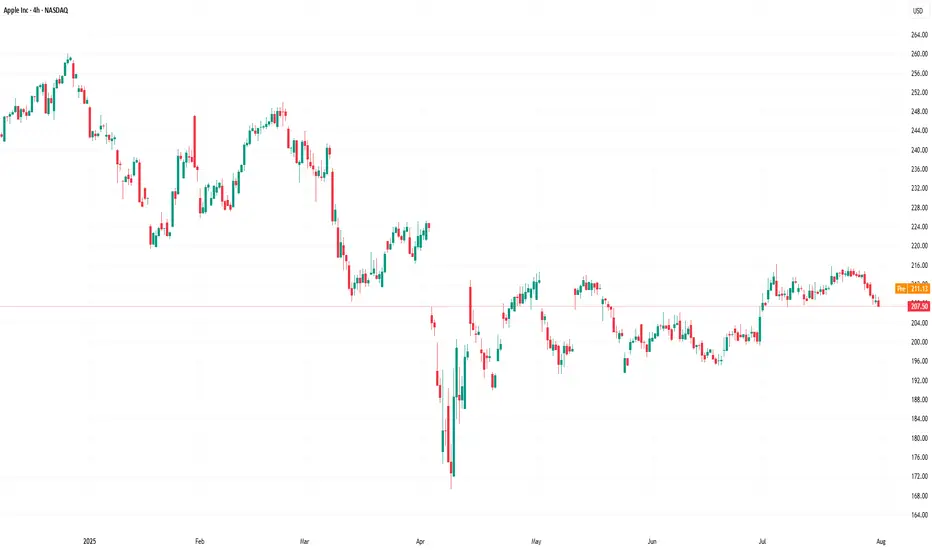
As a result, AAPL shares surged in the post-market, rising from $207.57 to $212.51.
Media Commentary:
→ The company reported a 13% year-on-year increase in iPhone sales.
→ However, according to Tim Cook, tariffs have already cost the company $800 million and this figure could exceed $1 billion in the next quarter.
Technical Analysis of the Apple (AAPL) Stock Chart
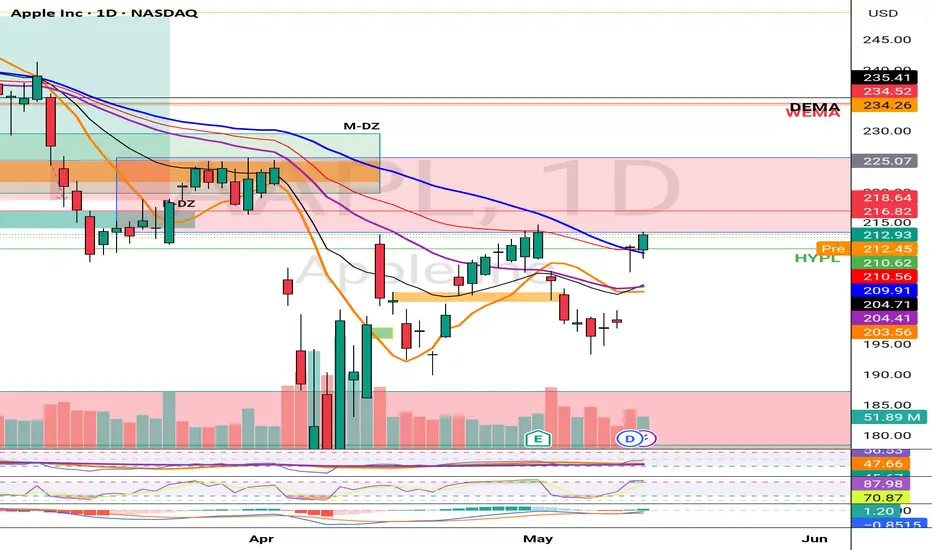
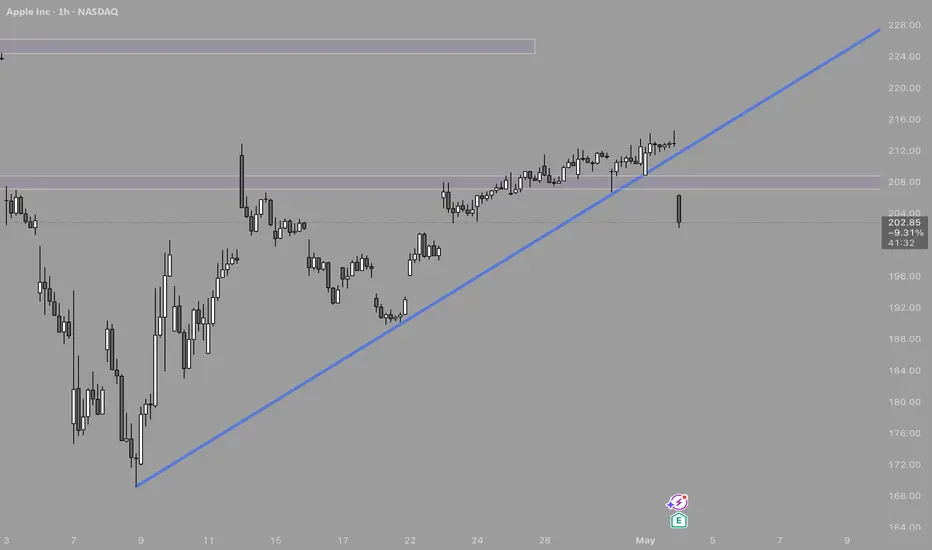
Following the volatility in April 2025, price action has justified the construction of an ascending channel (marked in blue). The $216 level, which has acted as a key reference point since March, remains a significant resistance area, because:
→ It has consistently prevented AAPL from reaching the upper boundary of the channel;
→ Even in the wake of a strong earnings report, the price failed to break through this level in post-market trading.
If the $216 level continues to cap gains in the coming days – despite the positive report – the stock might pull back towards the median line of the blue channel (following the post-market rally). This zone often reflects a balance between supply and demand. While such a retracement would appear technically justified, it may raise concerns among shareholders, particularly when compared to the more aggressive price rallies seen in the shares of other tech giants, such as Microsoft (MSFT), as we discussed yesterday.
From a more pessimistic perspective, peak A may turn out to be yet another lower high within a broader bearish structure that has been forming on the AAPL chart since December 2024, when the stock reached its all-time high around the $260 level.
This article represents the opinion of the Companies operating under the FXOpen brand only. It is not to be construed as an offer, solicitation, or recommendation with respect to products and services provided by the Companies operating under the FXOpen brand, nor is it to be considered financial advice.
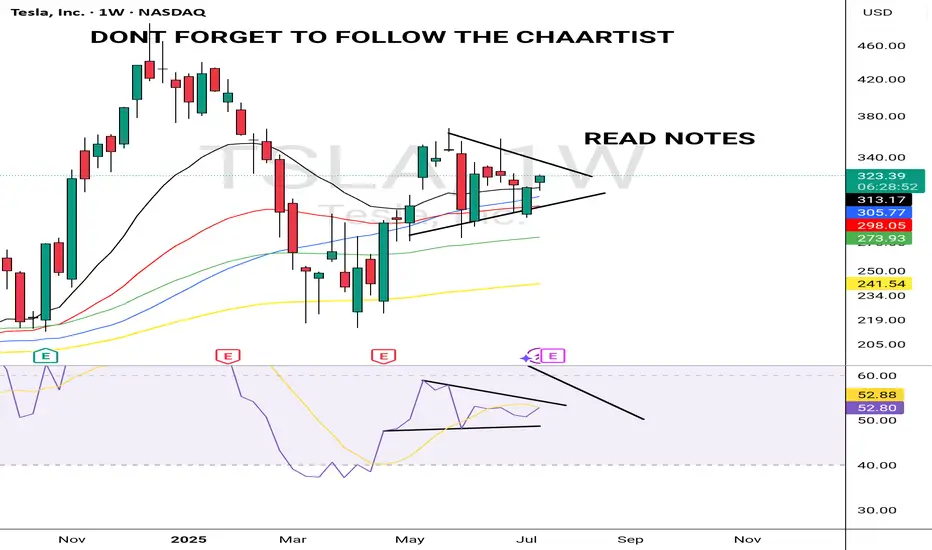
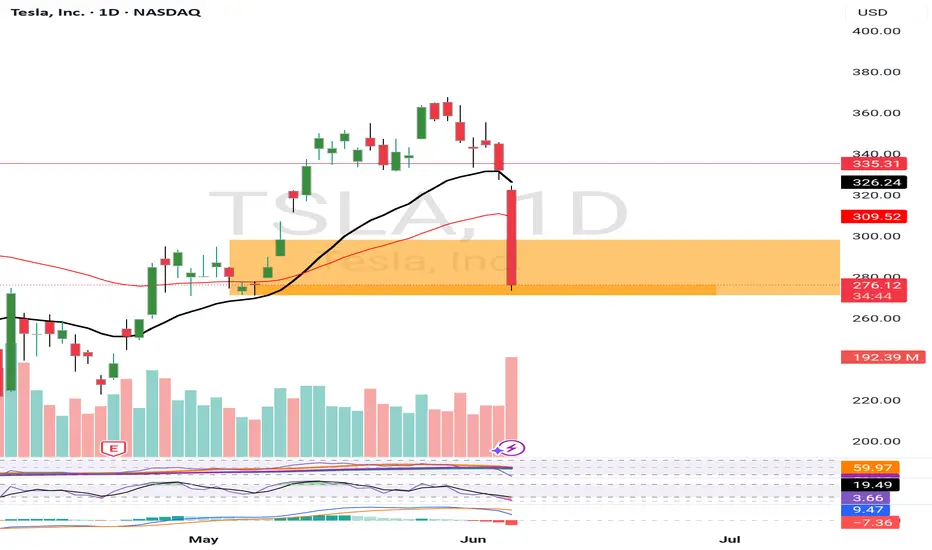
TSLA ULLISH JULY 18 2025Tsla is lloling extremely bullish technically. If it stops me out ,il exit but my my targets from here would be $390.
Always put a SL & decide a target before your entry
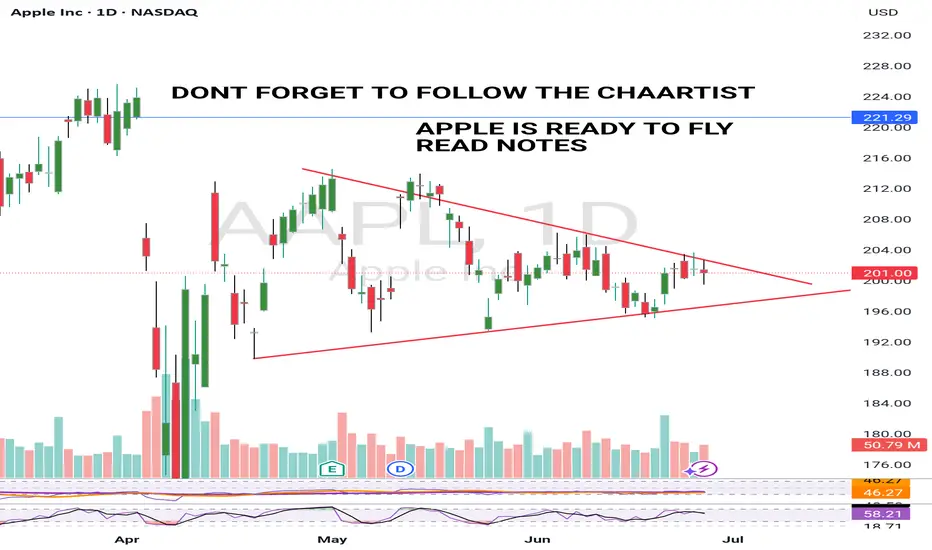
APPLE BULLISH 26 JUNE 2025Apple looks ready to breakout.It is really well squeezed now and ready to form a Green candle.
Breakout is an expectation so dont trade blindly.
I will upload video analysis Asap.
I am bullish and my price target is a minimum $220 from here.
NOTE: RISK MANAGEMENT IS A MUST
Apple (AAPL) Shares Consolidate Ahead of WWDCApple (AAPL) Shares Consolidate Ahead of WWDC
Today, 9 June, marks the start of Apple’s Worldwide Developers Conference (WWDC) — an event that traditionally attracts significant attention from investors and traders.
It is fair to say that WWDC 2025 begins against a rather negative backdrop:
→ Since the start of 2025, AAPL stock price has fallen by 19%, and Apple has lost its title as the world’s most valuable company, now trailing behind Microsoft and Nvidia.
→ Expectations raised by last year’s conference — particularly regarding new AI features in the iPhone — were not fully realised. As Barron’s noted, in March, an Apple spokesperson admitted that the new Siri “will take longer than we thought to implement these features. We expect to roll them out next year.”
Technical Analysis of the AAPL Chart
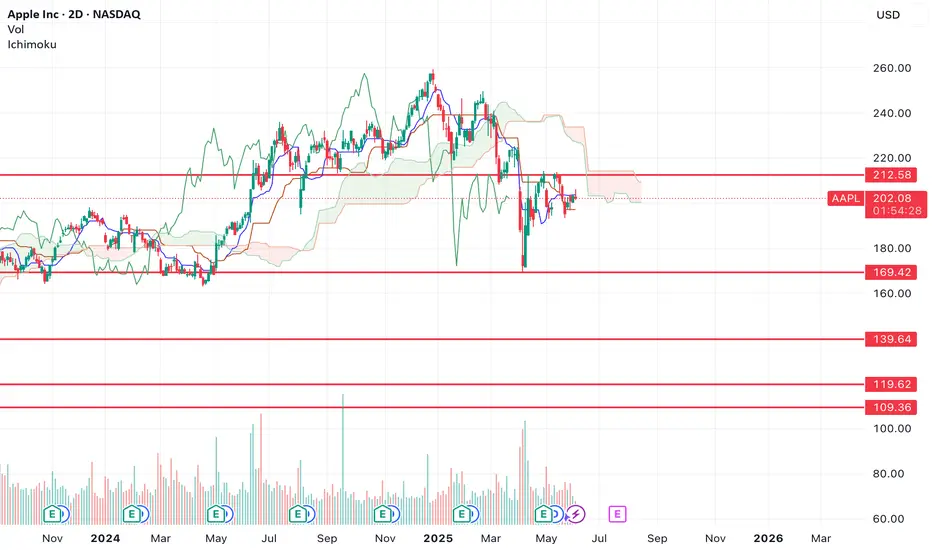
AAPL price movements are forming a narrowing triangle pattern:
→ The red trendline highlights sustained downward pressure on AAPL shares in 2025 — partly driven by concerns over the impact of the ongoing trade war;
→ On the other hand, the area below the psychological $200 level may attract buyers willing to take on risk.
WWDC 2025 could well provide fresh hope for the bulls and prompt an attempt to break out upwards from the triangle pattern.
This article represents the opinion of the Companies operating under the FXOpen brand only. It is not to be construed as an offer, solicitation, or recommendation with respect to products and services provided by the Companies operating under the FXOpen brand, nor is it to be considered financial advice.
AAPL Swing Trade Plan – 2025-06-06🍏 AAPL Swing Trade Plan – 2025-06-06
Bias: Moderately Bullish
Timeframe: 5–10 days
Catalyst: WWDC event, bullish short-term technicals, declining VIX
Trade Type: OTM call option with high R/R profile
🧠 Model Consensus Snapshot
Model Direction Strike Entry Price Profit Targets Stop Loss Confidence
Grok No Trade – – – – 50%
Claude Long $207.50 ~$2.04 $3.00 / $3.75 ~$1.40 72%
Llama Long $205.00 ~$2.87 +20% -50% 78%
Gemini Long $210.00 ~$1.45 $2.10 / $2.90 ~$0.72 75%
DeepSeek Long $215.00 $0.70 $1.05 / $1.40 $0.35 75%
✅ Majority View: Moderately Bullish
📉 Max Pain: $205 → Possible short-term magnet
📆 WWDC Event: Potential catalyst or risk depending on outcome
🧾 Sentiment: Positive, with a bullish skew on options OI
📈 Technical Overview
Short-term: Above 10-EMA on 15m and daily
Medium-term: Challenging 50-EMA (~$204.83)
Weekly: Mixed but improving MACD
VIX: Falling (<20), supportive of calls
Risk: Compression near $205 due to max pain, and event risk from WWDC
✅ Final Trade Setup
Parameter Value
Instrument AAPL
Direction CALL (LONG)
Strike 215.00
Expiry 2025-06-20
Entry Price $0.70
Profit Targets $1.05 (50%) / $1.40 (100%)
Stop Loss $0.35 (50%) or if AAPL closes < $203.33
Size 1 contract
Entry Timing At market open
Confidence 75%
📍 Rationale: Deep OTM offers low-cost exposure with strong potential R/R into an event week.
⚠️ Key Risks to Watch
Break below $203.33 → invalidate bullish thesis
WWDC disappointment → negative gamma risk
Max pain at $205 → short-term pinning risk
Theta decay → rapid loss if no momentum by mid-week

$AAPL new lows incoming?NASDAQ:AAPL doesn't look that great here. The rejection of $212.58 a couple weeks back left us with a double top at the highs.
Unless we can retake that level, I think more downside is likely.
I've marked off key support areas on the way down.
Let's see where we end up.
The key is whether it can rise above 209.27
Hello, traders.
If you "Follow", you can always get new information quickly.
Have a nice day today.
-------------------------------------
(AAPL 1D chart)
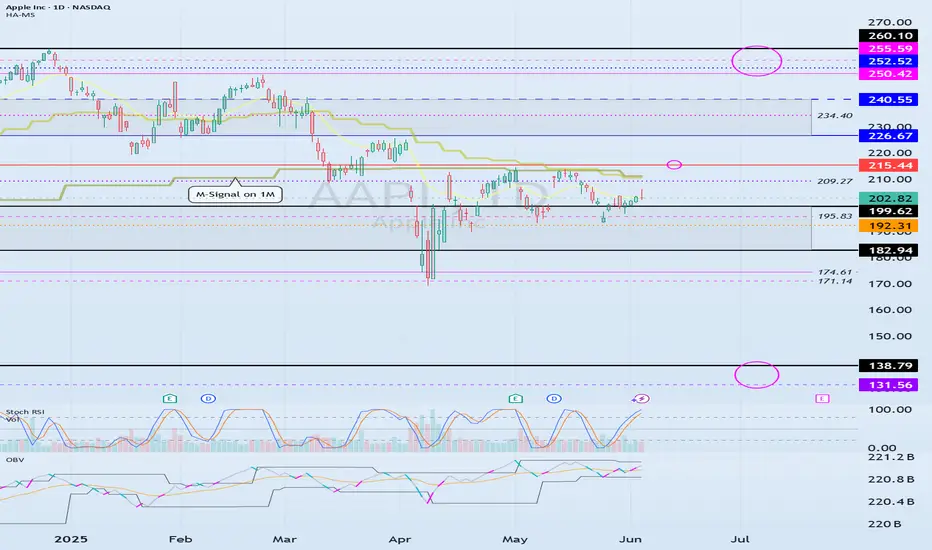
In order to continue the uptrend in the medium to long term, the price needs to stay above the M-Signal indicator on the 1M chart.
The important support and resistance zones at the current price position are the 182.94-199.62 zone and the 226.67-240.55 zone.
In that sense, the key is whether it can support near the 182.94-199.62 zone and rise above 209.27 to maintain the price.
The 226.67-240.55 zone is expected to act as resistance, but if it breaks through upward, it is expected to renew the ATH.
The important support zone is the 131.59-138.79 zone. If it falls to this area and shows support as the trading volume increases, you should focus on finding a buying point.
-
The basic trading strategy is to buy on the HA-Low indicator and sell on the HA-High indicator.
This trading strategy is a trading method within the box range.
If it falls below the HA-Low indicator or rises above the HA-High indicator, you should create a trading strategy using the trend trading method.
Therefore, the basic trading method should be a split trading method.
The 215.44 point is the OBV Low indicator point on the 12M chart, and from a long-term perspective, it can be interpreted that an uptrend can begin only when it rises above 215.44.
Therefore, you can see that the 209.27-215.44 section is an important section for turning into an uptrend.
-
Thank you for reading to the end.
I hope you have a successful trade.
--------------------------------------------------
AAPL Stock Trading Plan 2025-05-25AAPL Stock Trading Plan (2025-05-25)
Final Trading Decision
Models’ Key Points
DS Report
Technical: Strong bearish—price ($195.27) below all EMAs (10/50/200) on M30/daily/weekly; RSI oversold but in downtrend; bearish MACD; hugging lower Bollinger band. Sentiment: Rising VIX (22.29), negative tariff news, heavy institutional distribution. Trade: Short at $195.27; target $189.56; stop $197.50; 3–4 week hold; confidence 70%.
LM Report
Technical: Bearish price vs EMAs; RSI near oversold; Bollinger lower‐band touch hints at bounce; bearish MACD. Sentiment: Elevated VIX; negative headlines. Trade: No trade—mixed oversold/bearish signals; confidence 55% (below 60% threshold).
GK Report
Technical: Bearish across daily/weekly; RSI approaching oversold; MACD bearish but weakening; Bollinger lower‐band proximity. Sentiment: Rising VIX; tariff news headwind. Trade: Short at $195.00; target $189.56; stop $200.35; 4 week hold; confidence 65%.
GM Report
Technical: Multi‐timeframe bearish—price below EMAs M30/daily/weekly; RSI oversold short‐term; strong bearish MACD. Sentiment: VIX up; negative tariff/profit‐risk headlines; 5-day −7.6% drop. Trade: Short at $195.00; target $187.50; stop $198.90; 3–4 week hold; position sizing example 25 shares on $10k equity; confidence 85%.
CD Report
Technical: Bearish across timeframes; RSI oversold; lower Bollinger band; MACD bearish but showing early convergence. Sentiment: Elevated VIX; tariff threat. Trade: Short at $195.27; target $189.56 (secondary $185.00); stop $202.41; 3–4 week hold; confidence 72%. Agreement and Disagreement
Agreement
Broadly bearish technical setup: price below key EMAs; bearish MACD; lower‐band Bollinger action. Negative fundamental catalyst: potential tariffs and geopolitical risk. Rising VIX supports risk‐off bias. Recommendation skewed toward shorting AAPL shares.
Disagreement
LM sees too much mixed signal (oversold + bearish) to trade; all others recommend a short. Entry divergences: $195.00 vs. $195.27. Stop‐loss levels range from $197.50 up to $202.41. Take-profit levels range from $189.56 down to $185.00 (secondary) or $187.50. Confidence varies 65%–85%. Conclusion
Overall Market Direction Consensus: Strongly Bearish
Recommended Trade
Strategy: Short AAPL shares Holding Period: 3–4 weeks Entry Timing: At market open (~$195.00) Position Sizing: Risk 1% of trading capital (e.g., 25 shares on a $10 000 account; scale accordingly) Entry Price: 195.00 Stop‐Loss: 198.90 (≈2% above entry; sits above recent resistance) Take‐Profit: 187.50 (below key support for a ~3.8% move) Confidence Level: 85%
Key Risks and Considerations
Severe oversold conditions could trigger a technical bounce. AAPL’s strong balance sheet may limit downside if market stress eases. Tariff news or policy reversal could abruptly shift sentiment. Monitor VIX and major support at $189.56 for early signs of exhaustion.
TRADE_DETAILS (JSON Format) { "instrument": "AAPL", "direction": "short", "entry_price": 195.00, "stop_loss": 198.90, "take_profit": 187.50, "size": 25, "confidence": 0.85, "entry_timing": "open" }
📊 TRADE DETAILS 📊 🎯 Instrument: AAPL 📉 Direction: SHORT 💰 Entry Price: 195.0 🛑 Stop Loss: 198.9 🎯 Take Profit: 187.5 📊 Size: 25 💪 Confidence: 85% ⏰ Entry Timing: open
Disclaimer: This newsletter is not trading or investment advice but for general informational purposes only. This newsletter represents my personal opinions based on proprietary research which I am sharing publicly as my personal blog. Futures, stocks, and options trading of any kind involves a lot of risk. No guarantee of any profit whatsoever is made. In fact, you may lose everything you have. So be very careful. I guarantee no profit whatsoever, You assume the entire cost and risk of any trading or investing activities you choose to undertake. You are solely responsible for making your own investment decisions. Owners/authors of this newsletter, its representatives, its principals, its moderators, and its members, are NOT registered as securities broker-dealers or investment advisors either with the U.S. Securities and Exchange Commission, CFTC, or with any other securities/regulatory authority. Consult with a registered investment advisor, broker-dealer, and/or financial advisor. By reading and using this newsletter or any of my publications, you are agreeing to these terms. Any screenshots used here are courtesy of TradingView. I am just an end user with no affiliations with them. Information and quotes shared in this blog can be 100% wrong. Markets are risky and can go to 0 at any time. Furthermore, you will not share or copy any content in this blog as it is the authors' IP. By reading this blog, you accept these terms of conditions and acknowledge I am sharing this blog as my personal trading journal, nothing more.

Apple (AAPL) share price slips towards psychological $200 levelApple (AAPL) share price slips towards psychological $200 level
Yesterday, Apple shares (AAPL) fell by 2.5%, edging closer to the key psychological threshold of $200. Moreover, the stock is underperforming the broader market, which reached new highs earlier this week — a move AAPL has yet to replicate.
Why is AAPL’s stock price declining?
According to media reports, investors may have grown concerned after OpenAI acquired a startup founded by Jony Ive, Apple’s former chief designer, for $6.5 billion.
The move is being interpreted as OpenAI’s first step toward launching a physical AI-powered device — one that could, eventually, pose a challenge to Apple’s hardware, even if not in the near term.
Technical analysis of the AAPL chart
Bulls may be hoping the AAPL price finds support at the confluence of two key levels:
→ the psychological $200 mark;
→ support from the second half of May (the lower blue trendline).
However, the broader technical context raises some bearish concerns:
→ the $215–222 zone, which previously acted as support, is now capping price advances (as highlighted by the arrows);
→ the red descending channel appears to define the current trend trajectory — and its relevance may be reinforced if the price drops and consolidates near its median line, signalling a balance between buying and selling pressure.
This article represents the opinion of the Companies operating under the FXOpen brand only. It is not to be construed as an offer, solicitation, or recommendation with respect to products and services provided by the Companies operating under the FXOpen brand, nor is it to be considered financial advice.
AAPL LOOKING BULLISH 14TH MAY 2025Aapl is looking good to go long at current price as every demand is being respected and price is looking to go deeper into tbe supply zone.
So I will be going long with STOCKS ONLY.
If you any doubts do let me know in the comments below
AAPL SHORT Waiting for NASDAQ:AAPL to reach the high 208 level to short as it has broke a 1 HR multipal touch trend line and broke below a key support and resistance.
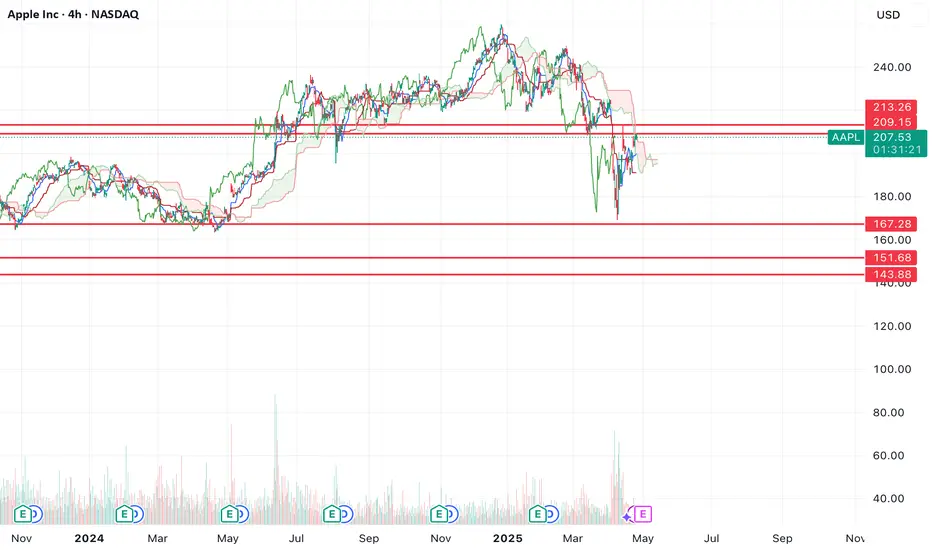
$AAPL doesn't bottom until $143-167Despite a bounce off the lows, NASDAQ:AAPL 's price action is still bearish.
The 4th wave of the correction produced a large bounce, but that wave is coming to an end and now it's time for the final move down to the lows.
I think it's likely that we bottom at the two lower supports at $143 or $151 before the correction is over.
Let's see how it plays out over the coming weeks.
TESLA 22 APRIL 2025This is my analysis for Tesla irrespective of its earnings. If yoiu have any doubts feel free to leave a txt.
I am long with proper RR & risk management

AAPL Weekly Options Trade Plan 2025-04-16AAPL Weekly Analysis Summary (2025-04-16)
Below is a synthesized analysis of the AAPL data and the five model reports:
──────────────────────────────
SUMMARY OF EACH MODEL’S KEY POINTS
• Grok/xAI Report – Observes a slightly recovered 5‐minute bounce but a generally volatile, declining daily trend. – Notes bearish technicals (price below EMAs, RSI recovering from oversold levels but MACD still below signal) and mixed sentiment (max pain at $202.50 with heavy put volume). – Recommends a trade on the $190 PUT given its attractive liquidity and proximity (–2.60% from current price).
• Claude/Anthropic Report – Highlights AAPL trading below key EMAs with persistent bearish momentum on both short and daily timeframes and a downtrend of –17% over 30 days. – Points out oversold conditions on the 5‑minute chart with continuing bearish pressure on the daily charts, alongside caution from negative news. – Chooses the $190 PUT as the best blend of risk and reward given its liquidity and technical setup.
• Gemini/Google Report – Emphasizes AAPL’s price below intraday and daily EMAs, with the short-term bounce near the lower Bollinger Band offering a minor contradiction. – Underlines strong bearish sentiment supported by high VIX and negative news, while noting resistance at the call side. – Recommends a bearish pick – the $187.50 PUT – though with a similar rationale as the others (i.e. trading just out‐of‐the‐money to capture a move).
• Llama/Meta Report – Notes bearish indicators including price under moving averages, low RSI, and MACD below the signal line. – Recognizes key support and resistance levels (supports near $194 and resistance near $197) and the opposing pressure suggested by max pain. – Ends up favoring a moderately bearish setup with the $190 PUT given its attractive liquidity and risk profile.
• DeepSeek Report – Reviews the technical and sentiment picture and concludes a moderately bearish position, underscored by negative news and broad put interest. – Emphasizes that a break from near-term support (around $194) could steer the price toward the $190 area. – Also recommends the $190 PUT, noting that its setup offers a reasonable risk/reward profile.
────────────────────────────── 2. AREAS OF AGREEMENT AND DISAGREEMENT
• Agreement: – All reports agree that AAPL is trading in a bearish environment overall, with price below key moving averages and a downtrend on daily charts. – There is a common focus on the options chain, where puts at or below $190 are highly liquid and carry significant open interest. – Every model, despite minor nuances, leans toward buying a naked PUT as the trade idea for this weekly options expiry. – All analysts recommend an entry at market open.
• Disagreement: – One model (Gemini/Google) slightly deviates by suggesting a $187.50 PUT as an alternative to $190, while the majority favor the $190 strike. – The exact profit target and stop‐loss levels differ somewhat between models, but all align on the general risk controls and short-term nature due to weekly expiration.
────────────────────────────── 3. CONCLUSION AND RECOMMENDED TRADE
Overall Market Direction: • Consensus is moderately bearish. Despite a brief short-term bounce noted on the intraday charts, the dominant trend and negative news sentiment favor further downside.
Recommended Trade: • Trade: Buy a single-leg, naked PUT option on AAPL • Expiration: Weekly (April 17, 2025) • Strike and Price: The $190 PUT (with an Ask around $0.83; it is about 2.60% below the current price) • Strategy Rationale: – This strike is liquid (high volume and open interest) and is supported by the bearish bias from momentum indicators and negative sentiment. – Although the premium of ~$0.83 is a bit above the preferred $0.30–$0.60 band, it is justified by the sharper risk/reward setup in this environment. • Entry Timing: At market open • Proposed Risk/Reward: – Profit Target: Approximately a 50% gain on the premium (target near $1.25) – Stop-Loss: Approximately a 50% loss on the premium (stop-loss near $0.42) • Confidence Level: 70% • Key Risks and Considerations: – A brief intraday bounce (short-term oversold recovery) could push prices above support, triggering the stop-loss. – Any unexpected news or a reversal in overall market sentiment may rapidly alter the risk profile given the short-dated expiration. – Monitor price action closely at open, as weekly options are particularly sensitive to early volatility.
────────────────────────────── 4. TRADE_DETAILS (JSON Format) { "instrument": "AAPL", "direction": "put", "strike": 190.0, "expiry": "2025-04-17", "confidence": 0.70, "profit_target": 1.25, "stop_loss": 0.42, "size": 1, "entry_price": 0.83, "entry_timing": "open" }
Disclaimer: This newsletter is not trading or investment advice but for general informational purposes only. This newsletter represents my personal opinions based on proprietary research which I am sharing publicly as my personal blog. Futures, stocks, and options trading of any kind involves a lot of risk. No guarantee of any profit whatsoever is made. In fact, you may lose everything you have. So be very careful. I guarantee no profit whatsoever, You assume the entire cost and risk of any trading or investing activities you choose to undertake. You are solely responsible for making your own investment decisions. Owners/authors of this newsletter, its representatives, its principals, its moderators, and its members, are NOT registered as securities broker-dealers or investment advisors either with the U.S. Securities and Exchange Commission, CFTC, or with any other securities/regulatory authority. Consult with a registered investment advisor, broker-dealer, and/or financial advisor. By reading and using this newsletter or any of my publications, you are agreeing to these terms. Any screenshots used here are courtesy of TradingView. I am just an end user with no affiliations with them. Information and quotes shared in this blog can be 100% wrong. Markets are risky and can go to 0 at any time. Furthermore, you will not share or copy any content in this blog as it is the authors' IP. By reading this blog, you accept these terms of conditions and acknowledge I am sharing this blog as my personal trading journal, nothing more.

Apple (AAPL) Shares Plummet Over 9% Following Trump's TariffApple (AAPL) Shares Plummet Over 9% Following Trump's Tariff Announcement
Many stock indices declined after the US President announced the introduction of tariffs for multiple countries, as we reported yesterday morning. During yesterday’s trading session, the sell-off in equities intensified.
According to media reports, market participants had hoped that the tariff threats were mere rhetoric and a negotiation tactic. However, many were shocked by both the number of countries affected and the scale of the imposed tariffs. Several well-known technology companies led the market downturn.
How Do Trump's Tariffs Impact Big Tech Companies?
Significant tariffs were imposed on Chinese imports, yet Apple manufactures around 90% of its iPhones in China. Many affordable products sold on Amazon are also set to become more expensive, as they are sourced from China.
Meta Platforms' advertising business could suffer considerable losses as companies worldwide cut advertising budgets. Nvidia and Broadcom may also struggle, given that the tariffs apply to many electronic devices incorporating their chips.
As a result, shares of Apple (AAPL), Amazon (AMZN), Meta Platforms (META), Broadcom (AVGO), and Nvidia (NVDA) fell by approximately 9% by the close of trading yesterday.
Microsoft (MSFT) shares, however, proved more resilient, dropping just 2.3%, as software products are not easily subject to tariffs. Moreover, software developers do not rely on international supply chains.
Technical Analysis of AAPL Chart
Apple’s stock price fluctuations have formed a trend channel (shown in blue), with:
→ The upper boundary acting as resistance since last autumn, although bulls managed to push the price above it during the Christmas rally. We previously highlighted Apple’s overbought condition and the possibility of a correction on 27 December 2024.
→ New data indicates that resistance has now shifted to the median at around $225.
This puts the lower boundary of the trend channel at risk of a bearish breakout. In the coming days, AAPL’s chart may see a bearish assault on the psychological $200 level, which proved significant in August 2024.
This article represents the opinion of the Companies operating under the FXOpen brand only. It is not to be construed as an offer, solicitation, or recommendation with respect to products and services provided by the Companies operating under the FXOpen brand, nor is it to be considered financial advice.

Apple (AAPL) Share Price Drops Over 7% in Two DaysApple (AAPL) Share Price Drops Over 7% in Two Days
As previously reported, AAPL shares had their worst January since 2008, but the challenges for investors have continued. The Apple (AAPL) stock chart shows that:
- Yesterday, the price dropped below $218 during trading—the lowest level since September last year.
- Compared to Friday’s closing price, the decline over the first two days of this week amounted to approximately 7.7%.
Why Has AAPL Stock Fallen?
Yesterday, we noted that bearish sentiment was prevailing in the stock market, leading the Nasdaq 100 index into correction territory. Market conditions were further dampened by news that Apple had delayed the release of an AI-powered update for its digital assistant, Siri 2.0, increasing selling pressure.
What Could Happen Next?
Technical Analysis of Apple (AAPL) Stock
Key price reversals, marked with red dots, outline a downward channel (shown in red). The median line, which previously acted as support (indicated by an arrow), has now been broken, suggesting that bears may expect it to act as resistance going forward.
From a bullish perspective, the lower boundary of the red channel, reinforced by the September low around $214, could serve as an area where selling pressure might ease—if AAPL continues to decline.
AAPL Share Price Forecast
According to TipRanks:
- 18 out of 33 surveyed analysts recommend buying AAPL stock.
- The average 12-month price target for AAPL is $251.
This article represents the opinion of the Companies operating under the FXOpen brand only. It is not to be construed as an offer, solicitation, or recommendation with respect to products and services provided by the Companies operating under the FXOpen brand, nor is it to be considered financial advice.

Retracement phase till April 2025 and then??? who knows...Offcourse the chart is self explanatory.
on daily timeframe where it touches the 200 SMA.
It means that the long term downtrend is gonna start.
Still a big no.... it has to touch the monthly resistance around 200 area.
Dear Traders, Go away and check for another mind.
as investor I already took my position at 240. Will take more position around 200 price.
Let's analyse it again in April-May 2025.

Apple (AAPL) Stock Price Drops Below $240Apple (AAPL) Stock Price Drops Below $240
The last time Apple (AAPL) stock traded below the $240 mark was in late November last year.
Bearish sentiment is being driven by negative news surrounding the company:
→ CNBC reports analysts' views that the excessively thin design of the new iPhone SE 4 models will complicate sales in China. The analysts also note a decline in the appeal of the Apple Intelligence feature.
→ Investment firm Moffett Nathanson downgraded Apple’s stock rating from "Neutral" to "Sell" and lowered its target price for AAPL from $202 to $188. According to analysts, the 30% growth in Apple stock for 2024 is largely unjustified.
→ Criticism from Mark Zuckerberg, who believes that Apple has not invented anything groundbreaking for a long time.
As we mentioned on 27 December, Apple’s stock appeared overbought and vulnerable to a correction.
Technical analysis of the AAPL chart today shows that the price has dropped to:
→ The median of the current channel (marked in blue);
→ The $235 level, which previously acted as resistance.
Therefore, it is plausible that in the short term, this block formed by these two lines may provide support to the falling price. This hypothesis is supported by the long lower wick on Friday’s candle, indicating increased buyer activity.
According to TipRanks:
→ Analysts' 12-month price target for AAPL stock averages $244.77;
→ Of 29 analysts surveyed, 19 recommend buying AAPL stock, while 3 recommend selling.
This article represents the opinion of the Companies operating under the FXOpen brand only. It is not to be construed as an offer, solicitation, or recommendation with respect to products and services provided by the Companies operating under the FXOpen brand, nor is it to be considered financial advice.

Apple (AAPL) Stock Ends the Year Near Record HighsApple (AAPL) Stock Ends the Year Near Record Highs
In 2024, Apple Inc. (AAPL) shares surged by approximately 35%, fueled by the introduction of Apple Intelligence, a groundbreaking AI technology integrated into the company's ecosystem. This feature, designed for iPhones and other Apple products, enhances both productivity and user experience.
Following the June launch of Apple Intelligence, AAPL stock price saw a sharp rise (indicated by the arrow), marking the beginning of a steady upward trend within a channel (highlighted in blue) that remains intact.
In early August, a sell-off in Japan's stock market and fears of a global recession defined the channel's lower boundary.
The stock subsequently rebounded, with prices fluctuating around the channel's central line (bolded) throughout autumn. This balance signified equilibrium between buyers and sellers.
As 2024 comes to a close, AAPL shares exhibit a strong upward momentum, resembling a Santa Claus rally. A new, steeper upward channel (depicted in purple) has emerged on the chart.
Analyst Predictions and Market Sentiment
Analysts are optimistic about AAPL’s prospects. Daniel Ives of Wedbush recently raised his price target for AAPL from $300 to $325, citing the underappreciated potential of Apple's AI initiatives. Ives believes the company is entering a multi-year iPhone upgrade cycle, driven by artificial intelligence integration.
Looking ahead to 2025, analysts project record-breaking iPhone sales of approximately 240 million units, marking a historic achievement for Apple. This momentum could drive AAPL shares to new highs. While the long-term outlook is positive, near-term risks remain.
Current technical indicators suggest AAPL may face a short-term correction:
- The price is approaching the upper boundary of the channel.
- The RSI indicates overbought conditions, with signs of a potential bearish divergence.
Traders should consider the possibility of a pullback below the key psychological level of $250, with the price potentially retreating to the lower purple boundary.
TipRanks Insights:
- Analysts’ average price target for AAPL by the end of 2025: $245.28.
- Among 29 analysts, 19 recommend buying, while 2 suggest selling.
This article represents the opinion of the Companies operating under the FXOpen brand only. It is not to be construed as an offer, solicitation, or recommendation with respect to products and services provided by the Companies operating under the FXOpen brand, nor is it to be considered financial advice

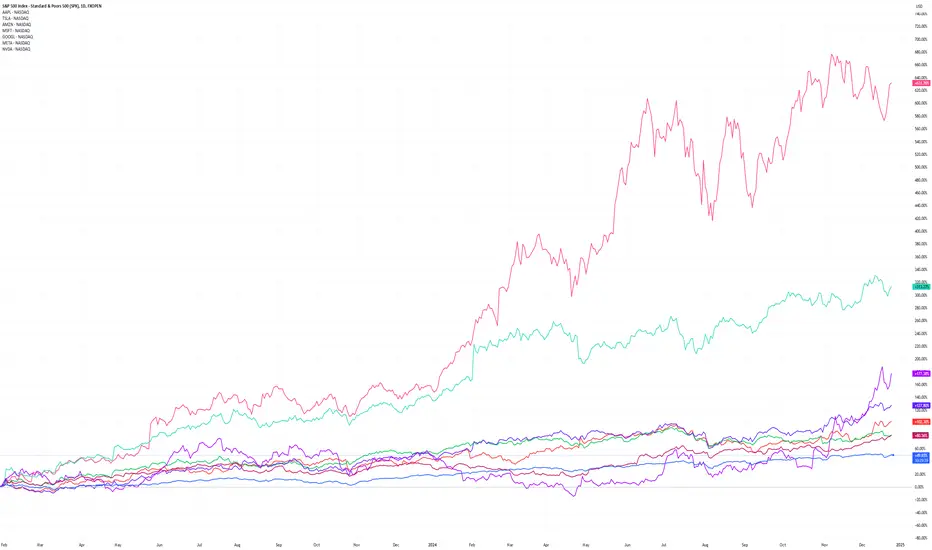
The Magnificent Seven Stocks: A Stellar 2024 and Uncertain 2025The Magnificent Seven Stocks: A Stellar 2024 and an Uncertain 2025
The Magnificent Seven is a term used to describe the seven largest technology companies that dominate the global economy through their scale, innovation, and high market capitalisation.
These companies are often key drivers of the US stock market, and in 2024 (as in 2023), they confirmed their leadership, with most outperforming the broader market indices. Below are approximate performance estimates for the end of 2024:
→ S&P 500 (US SPX 500 mini on FXOpen): +26%
→ Apple (AAPL): +38%
→ Microsoft (MSFT): +18%
→ Amazon (AMZN): +52%
→ Alphabet (GOOGL): +42%
→ Meta Platforms (META): +43%
→ Tesla (TSLA): +87%
→ Nvidia (NVDA): +189%
What does 2025 hold for the Magnificent Seven?
Motley Fool offers a cautious outlook for the coming year, suggesting that some of these leaders may run out of steam due to inflated stock prices relative to their intrinsic value and profit forecasts.
Zacks analysts have examined the fundamentals and identified three stocks from the Magnificent 7 that are worth considering for value investors:
1. Alphabet (GOOGL)
Alphabet has the lowest price-to-earnings (P/E) ratio among the Magnificent 7, standing at 23.9. While this doesn’t say it is a value stock (value stocks typically have a P/E below 15), it is relatively cheap compared to its peers. Moreover, Alphabet now pays dividends.
2. Meta Platforms (META)
Meta Platforms remains attractively valued with a forward P/E of just 25.8. It also boasts a relatively low price/earnings-to-growth (PEG) ratio of 1.3 (a PEG below 1.0 indicates a reasonable price relative to expected profit growth). The 1.3 PEG is appealing, and like Alphabet, Meta has started paying dividends.
3. Amazon.com (AMZN)
Once aiming to be the "store for everything," Amazon has expanded far beyond this with its AWS division, Whole Foods, sports and entertainment programming on Prime, and even chip manufacturing. Amazon has the lowest price-to-sales (P/S) ratio among the Magnificent Seven, at 3.8. Although a P/S below 1.0 is typically considered attractive, Amazon remains appealing to investors. For comparison, Microsoft’s P/S ratio is 13.1, while Nvidia’s is 29.
This article represents the opinion of the Companies operating under the FXOpen brand only. It is not to be construed as an offer, solicitation, or recommendation with respect to products and services provided by the Companies operating under the FXOpen brand, nor is it to be considered financial advice
$AAPL back to $200?The NASDAQ:AAPL chart looks weak. Since October, you can see price formed a lower high and now has been consolidating in a bear flag.
Should the flag break down, I think we'll see a sharp move down to $200 or one of the supports below it.
Why such a large move? The chart has an imbalance on it from how quickly price rose in the first half of the year.
I think price needs to correct lower to fix the chart imbalance.
The move should play out by Jan 6.
Let's see.
