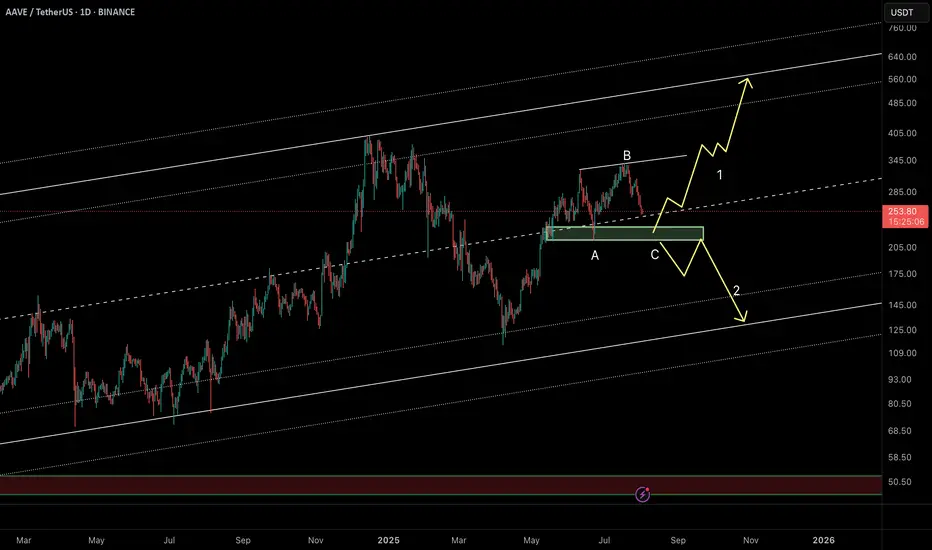
AAVE Daily Chart – Key Buy Zone & Two ScenariosAAVE is currently moving within a well-defined ascending channel on the daily timeframe. The last major bullish leg began from the $120 support and surged nearly +180% to a local high near $330.
Now, after a 25% pullback, price is consolidating around the midline of the channel near $250. More importantly, there’s a strong bullish order block sitting between $220–230, making this a low-risk buy zone with a stop below the order block.
🔸 Scenario 1 (bullish preferred):
Price dips into the $220 OB zone, completes a possible ABC correction, and launches a new bullish leg targeting the channel top above $500.
🔸 Scenario 2 (bearish alternate):
If the $220 order block fails, deeper correction could follow toward the channel bottom near $135.
⏳ This is a critical area to watch for reaction – Smart Money will likely show its hand soon.
🔗 Analysis by CryptoPilot
Aave
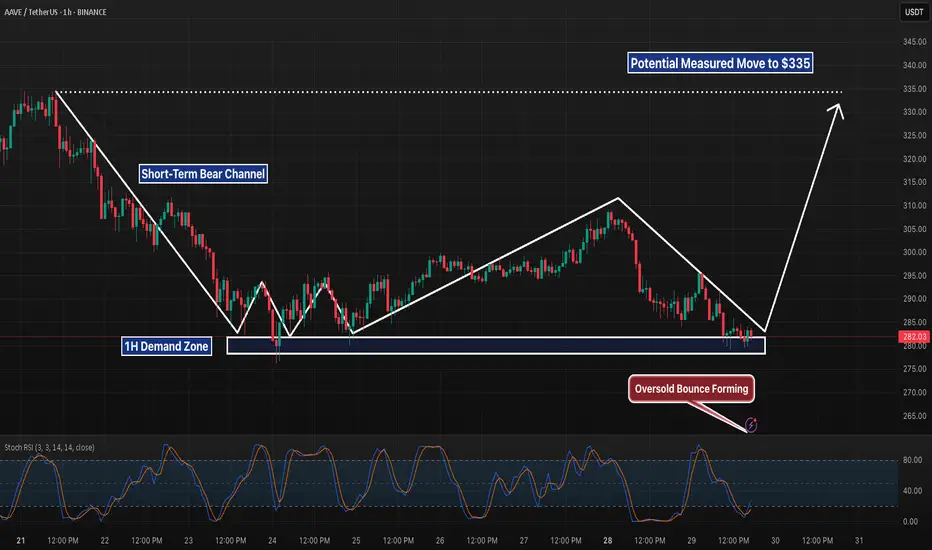
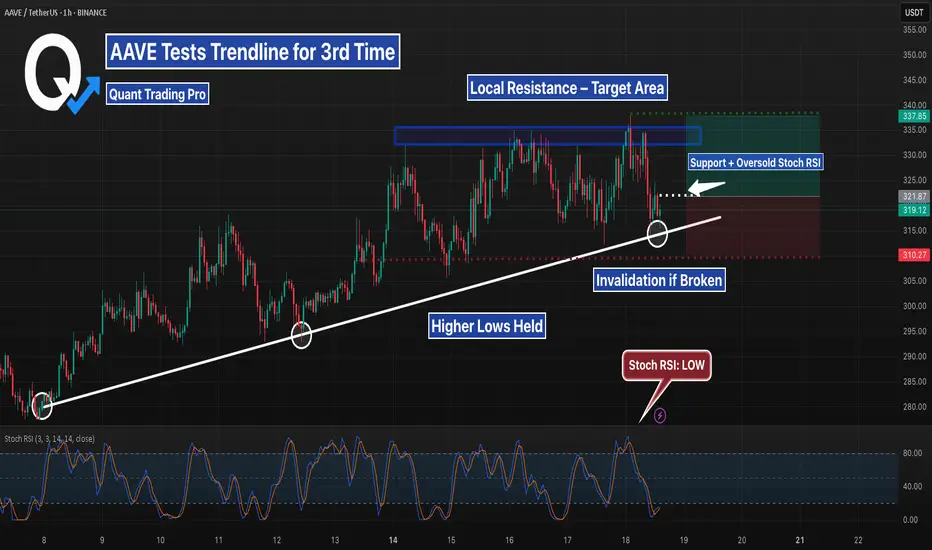
AAVE 1H – Triple Tap Support + Bullish Divergence Incoming?AAVE is painting a compelling reversal setup on the 1H timeframe. After a sharp selloff last week, price has tapped the $278–282 demand zone multiple times — each time printing higher local lows on the Stochastic RSI and showing signs of exhaustion from sellers.
This zone has now been tested three separate times, forming what looks like a triple-bottom structure. During the latest retest, Stochastic RSI is deeply oversold and beginning to curl up — suggesting that momentum may shift in favor of the bulls soon.
We’re also approaching the apex of a descending trendline, meaning compression is reaching its limit. A clean break and reclaim above $290 could be the first real sign of trend reversal, with a potential target near the previous range highs around $335 if momentum follows through.
📊 Why This Setup Matters:
– Strong historical support zone with visible reactions
– Repeated seller failure to break the zone cleanly
– RSI bullish divergence building beneath structure
– Clear invalidation level below support
– Risk-reward skewed in favor of a bounce play
This isn’t confirmation yet — but it’s definitely a chart worth watching closely over the next session. If bulls step in with volume, this could catch momentum fast.
$AAVE Daily Hidden Bullish divergence?CRYPTOCAP:AAVE and alts begin their retracement Wednesday but is this a long term top or just local? Im betting we have a higher to go this summer..
Hidden daily bullish divergence is printing on RSI at the daily pivot and 0.5 Fibonacci retracement which should all act as strong support provided BTC doesn't dump.
The 'alt-coin golden pocket' Fibonacci retracement 0.786 sits at the descending daily 200EMA and High Volume Node support offering a secondary target for reversal and continued upside.
Losing this and closing below would flip me bearish until a new bullish signal emerges.
Safe trading.
TradeCityPro | AAVE Holds Gains as Altseason Optimism Builds👋 Welcome to TradeCity Pro!
In this analysis, I’m going to review the AAVE coin for you. It’s one of the major DeFi coins active in the lending sector and currently ranks number 1 in terms of TVL.
✔️ The token itself has a market cap of $4.58 billion and is ranked 29 on CoinMarketCap.
📅 Daily Timeframe
On the daily timeframe, since our last analysis, the price has increased by over 100%, and the trigger for long or buy positions was activated.
🔄 There was a descending trendline on this coin, and the trigger for its breakout was 148.17. After breaking that level, we could open a long position.
🚀 However, the main trigger was 194.97, and the primary uptrend started with the break of that level, continuing up to a high of 328.9.
📊 The issue with this current uptrend is that, as you can see in the second leg, there is clear weakness, which is not a good sign for the continuation of this trend.
📈 The current top at 328.9 is not far from the previous high, forming a double top-like structure, leading to a strong bearish divergence in the RSI.
💥 If RSI confirms a breakdown below 50, this divergence will become active and a correction toward 222.10 may occur. A break of that level would be the first signal of a potential trend reversal for AAVE.
⭐ On the other hand, if price wants to continue upward, we have a very important resistance at 383.59.
🔍 Breaking this resistance would initiate an uptrend in higher cycles and could even lead to a new ATH for this coin.
💼 I plan to open a long position if the 328.9 resistance is broken, and for spot purchases, I will wait for a breakout of 383.59.As long as the price remains above 279.45, I am not considering any short positions.
📝 Final Thoughts
This analysis reflects our opinions and is not financial advice.
Share your thoughts in the comments, and don’t forget to share this analysis with your friends! ❤️

AAVE Bounce or Breakdown — Trendline Test #3AAVE is testing a clean 3-touch trendline that’s held for days. Current confluence with the range low and Stoch RSI reset makes this a textbook long setup — but if the trendline fails, expect quick downside. Risk defined. Eyes on the next candle.
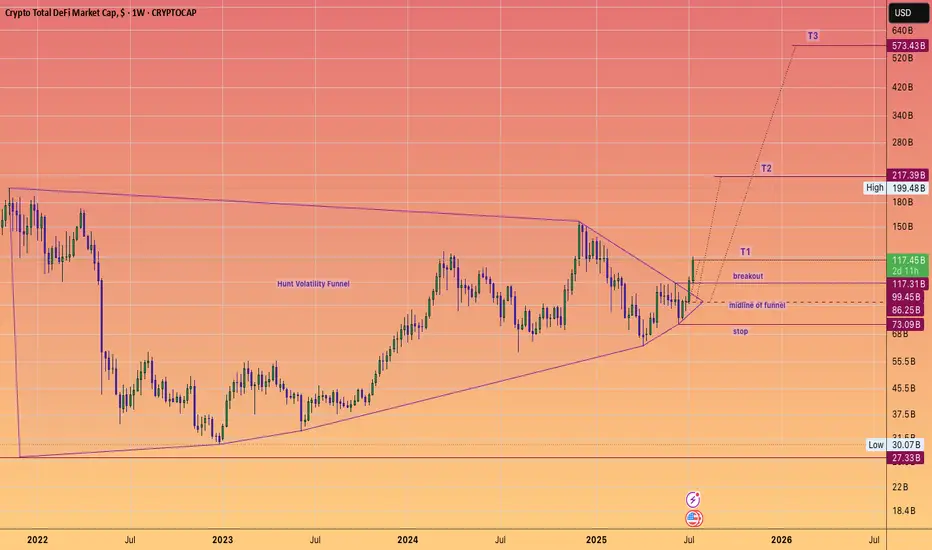
DeFi Moonshot! Moon mission to $573 Billion dollars!DEFI fuelled by Ethereum, built on proven protocols and stablecoin legislation is ready to keep cranking higher for the rest of the year. And instead of a Defi summer of emergence (2020), a multi season of adoption that takes it to half a trillion dollars, hitting these targets of a #HVF
@TheCryptoSniper
The components set to benefit are:
Uniswap #UNI ~ $12.3 Billion
Lido DAO #LDO ~ $9.1 Billion
Aave #AAVE ~ $7.5 Billion
MakerDAO #MKR ~ $4.6 Billion
GMX #GMX ~ $2.5 Billion
Curve #CRV ~ $1.9 Billion
Synthetix #SNX ~ $1.1 Billion
Pulsex #PLSX ~ $0.46 Billion
Key points:
The #TotalDefi index is currently at $117B aligning closely with the $123.6B of TVL
As we see hundreds of billions of dollars get digitized watch this index climb onwards and upwards... With $1 Trillion dollars and obvious milestone that is surely set to be met ... one day.
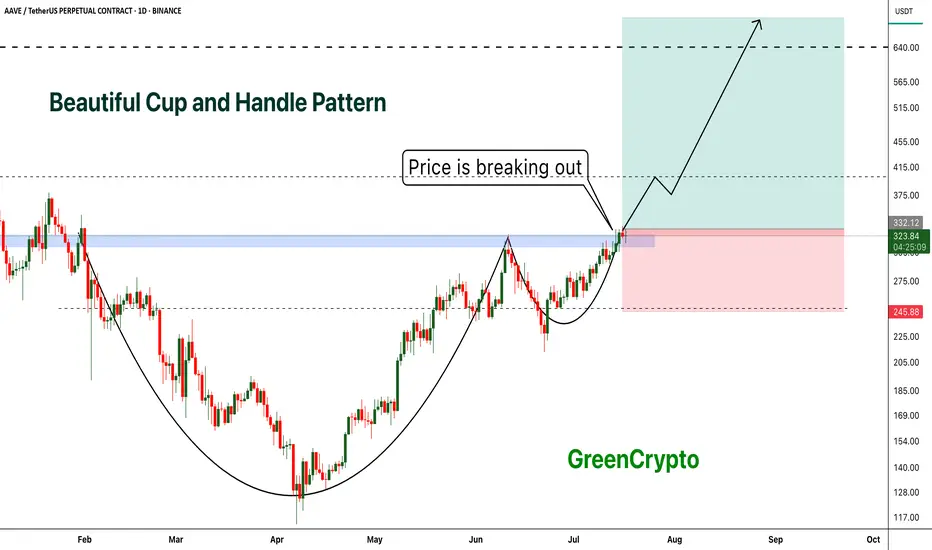
AAVE - Beautiful Cup and Handle Pattern Breakout- AAVE is breaking out from cup and handle pattern finally
- Cup and handle pattern breakout usually results in perfect trend continuation
- A huge long trade opportunity from this
Entry Price: 335 Above
Stop Loss: 245
TP1: 381.89
TP2: 429.16
TP3: 525.94
TP4: 628.78
TP5: 712.89
Max Leverage 5x:
Don't forget to keep stoploss
Cheers
GreenCrypto
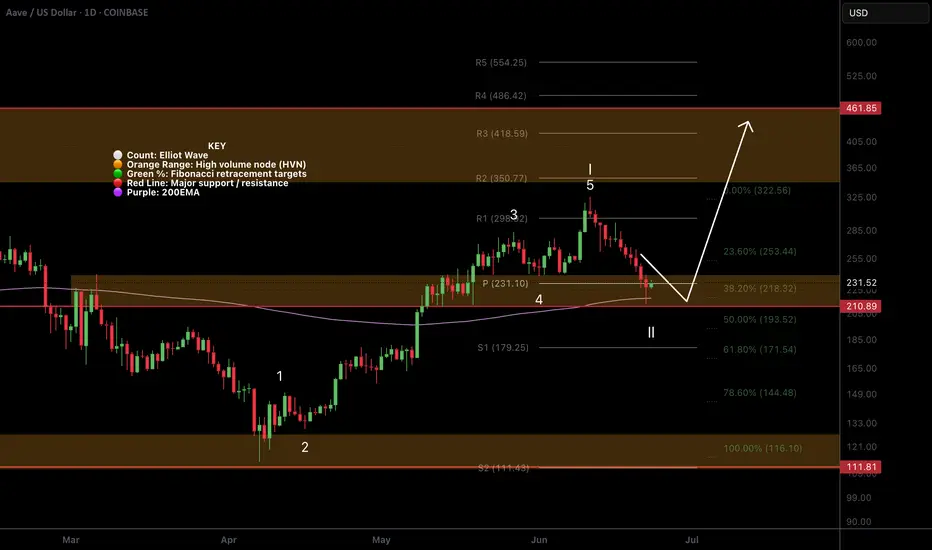
$AAVE Macro outlook Grinding the PathCRYPTOCAP:AAVE continues to grind higher poking above the swing high which was rejected to test the weekly pivot and .382 Fibonacci retracement as support successfully. This was a shallow wave 2 so I am expecting a big thrust up in wave 3. However, the alternative count could suggest a wave is only completing now with wave 2 actually being wave (4) of 1, this would be the case if price falls back below $171.
Weekly RSI is still bullish with plenty of room to rise ahead of it. It printed a weekly bullish divergence at the wave II low and major support high volume node.
AAVE is definitely one too watch this cycle.
Safe trading

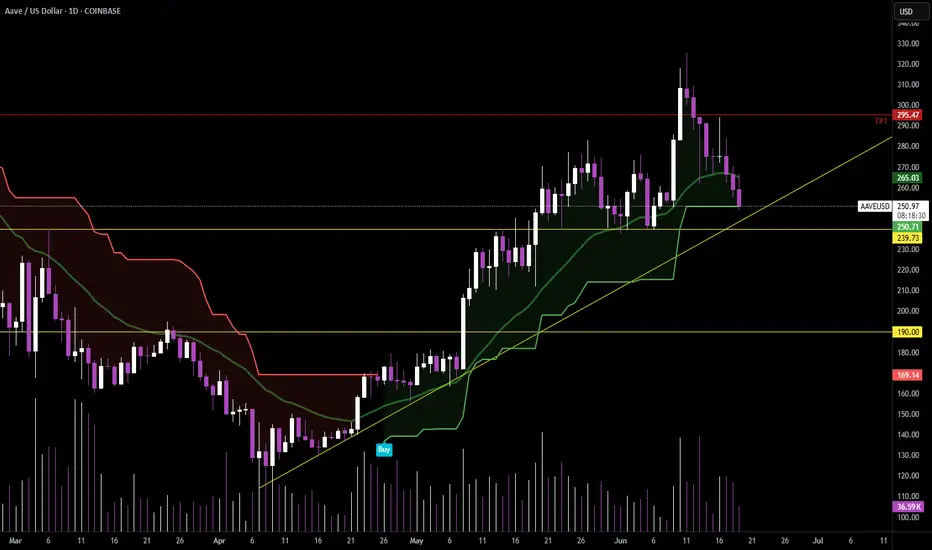
$AAVE Ready to Pop?EURONEXT:AAVE long signal is now active.
Price is still well above the daily pivot and daily 200EMA showing a strong local trend.
I am still expecting a decent move to test the all time high, High Volume Node at $460.
Safe trading
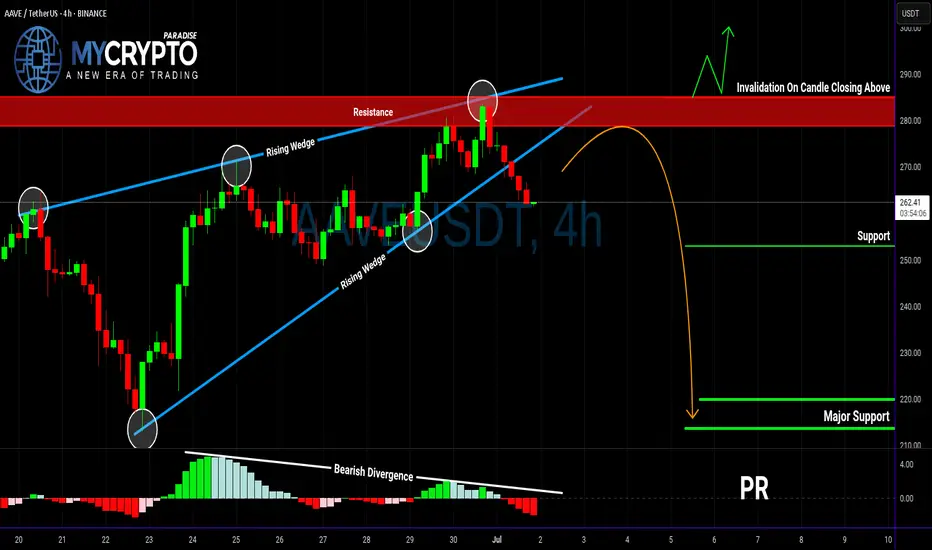
AAVE Breakdown Could Trigger Major DropYello Paradisers — did you spot the bearish setup forming on AAVEUSDT? If not, you might already be a step behind, but there’s still a high-risk-reward opportunity on the table — if you approach it with discipline.
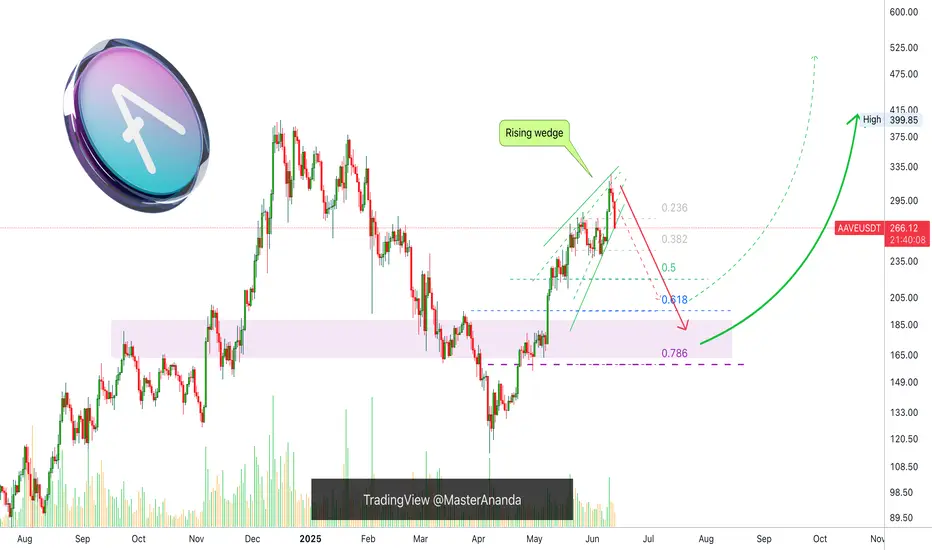
💎Currently, AAVEUSDT is looking increasingly bearish. The asset has confirmed a bearish Change of Character (CHoCH), broken down from a rising wedge pattern, and is showing clear bearish divergence on the chart. These combined signals suggest that the probability of further downside is increasing.
💎From here, there are two main scenarios we’re monitoring. First, AAVE could attempt a pullback to fill the Fair Value Gap (FVG) above, which would offer a clean short-entry zone with strong risk-reward potential. Alternatively, price could reject directly from the nearby Bearish Order Block (OB), offering another chance for well-structured entries. Both setups depend on confirmation and timing, so patience is key.
💎However, if AAVE breaks and closes decisively above the current resistance zone, the bearish thesis becomes invalid. In that case, the best move is to wait on the sidelines and allow new, higher-quality price action to form before re-engaging.
💎This market demands patience and discipline. You don’t need to catch every move — just the right ones. Stay sharp, stay focused, and let the market come to you.
Strive for consistency, not quick profits. Treat the market as a businessman, not as a gambler.
MyCryptoParadise
iFeel the success🌴
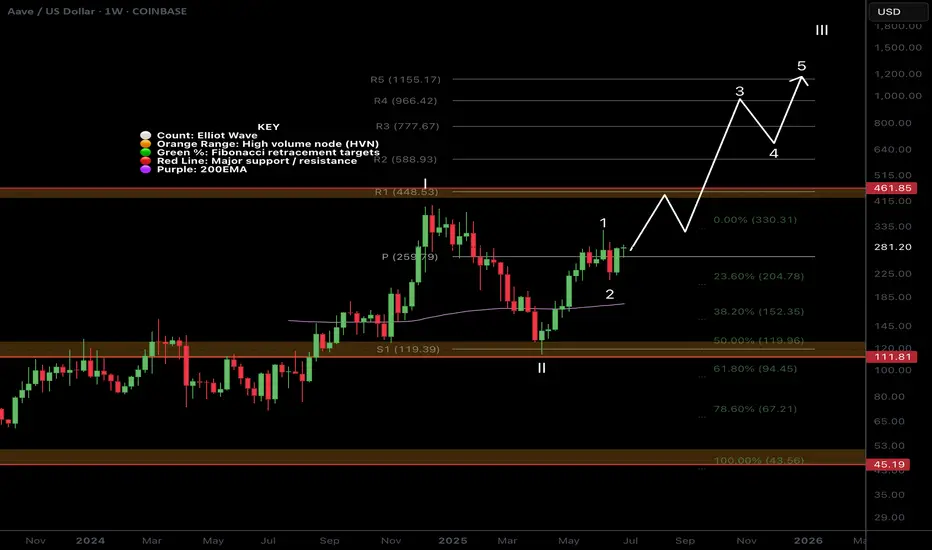
$AAVE Going Through a Major Bullish Trend Shift!CRYPTOCAP:AAVE continues to outperform on pumps and retracements this cycle after being beaten down for many years!
Price consolidated below the weekly pivot and found support, only retracing to the .618 Fibs.
Wave 3 of iii pf a new Elliot Motif Wave looks well underway with the next price target being the R1 weekly pivot High Volume Node at $448.
Long term outlooks is very bullish for AAVE with a terminal target of the R5 weekly pivot £1155
Safe trading
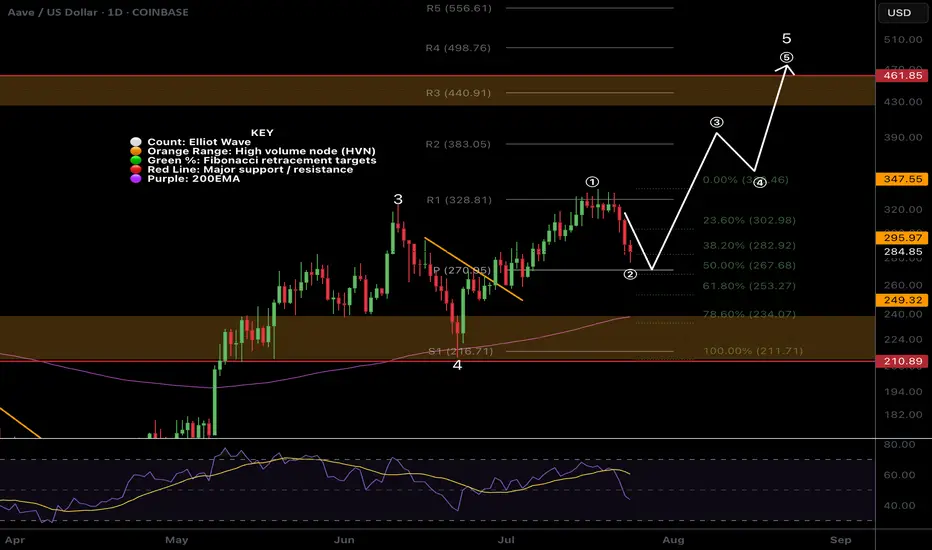
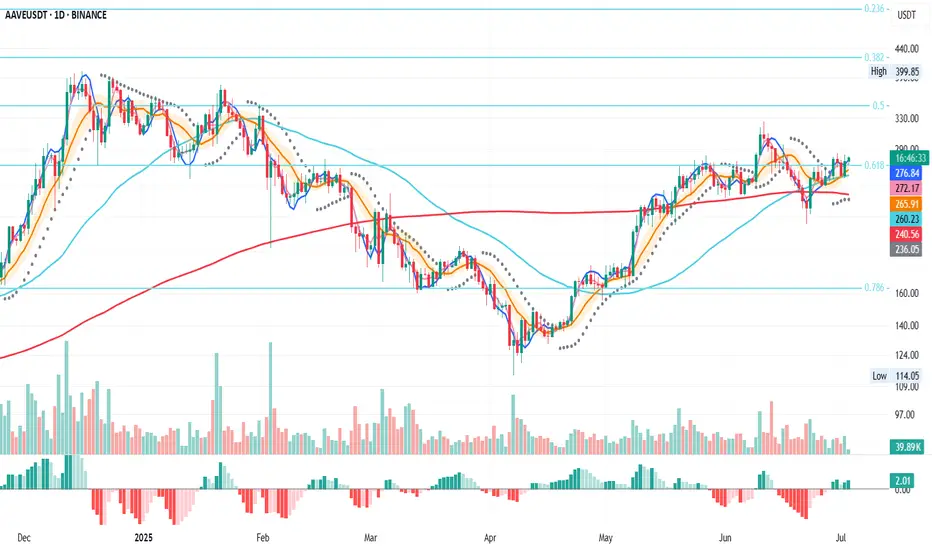
AAVE Daily – 0.618 Fib Reclaimed
AAVE on the daily has reclaimed the 0.618 Fib level after dropping below it and retesting the 200MA.
MLR > SMA > BB center — structure looks constructive.
If price holds this Fib level, there’s a good chance of targeting the 0.5 Fib around $350.
Always take profits and manage risk.
Interaction is welcome.
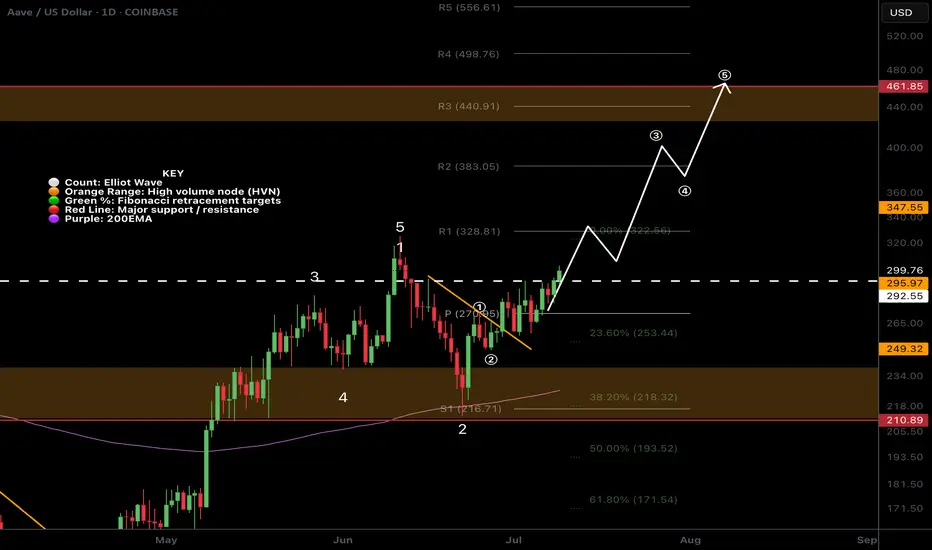
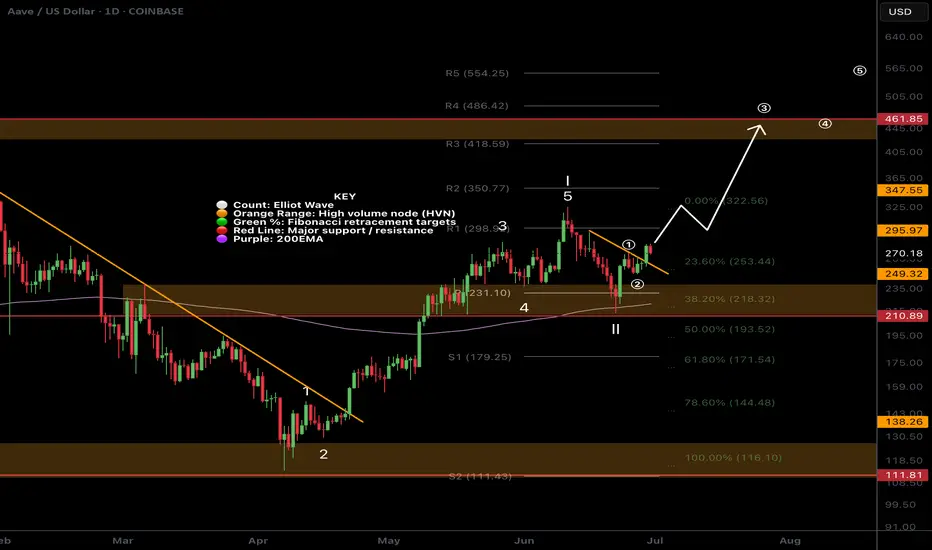
AAVE Ready For New Highs?AAVE is breaking out of its descending trendline after several tests as resistance.
Wave 2 appears complete at quadruple support: Daily 200EMA, daily pivot, .382 Fibonacci retracement and High Volume Node (HVN). If an Elliot Wave (3) of 3 is underway, price should move strongly sooner rather than later with extended price action.
The next major resistance and partial take profit is at the December swing high range $460.
Analysis is invalidated below $210.
Safe trading
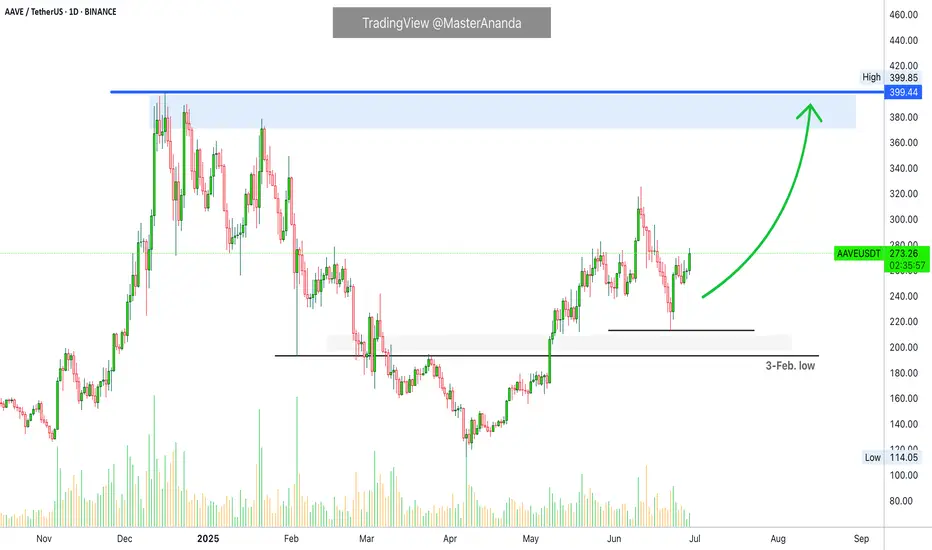
Aave: Next High the Dec. 2024 Price ($400), Then Higher...I thought about Aave today. The retrace was minimum, it was swift and strong. As soon as the retrace is over we get the continuation of the bullish wave. That is what I see on this chart.
The recent retrace did not reach the 3-Feb. low, and this is all you need to know.
Current action is indicative of the continuation of the bullish wave. When a move is very strong, with too much force, it cannot go for too long. This happened with the drop from 11 to 22-June. It was so strong and it ends in a flash. Once it is over there is no other place for the market to go. If the down-move is over, prices can only grow. Aave is growing now, it will hit $400 as the next target, the December 2024 high just to continue higher.
Expect more retraces and corrections along the way. Just as you saw a few weeks back, but always remember that retraces are just an opportunity to buy-in, rebuy and reload. The market will always recover and produce new and more growth.
Namaste.
AAVE price analysis The price of CRYPTOCAP:AAVE has shown steady growth and strength in recent months.
But is everything in the crypto market as good as we would like it to be? Unfortunately, no.
Despite its strength, even the price of OKX:AAVEUSDT may still be subject to correction.
💡 So, for those who remember our global May idea for the price of #AAVE and have decided to buy this asset for their investment portfolio at a favorable price 👇
we have some advice for you: keep your pending buy orders in the $146-$182 range...
Now, not only in Ukraine, but throughout the world, “every day is a "crazy day,” anything can happen...
_____________________
Did you like our analysis? Leave a comment, like, and follow to get more

AAVE Standing out among the alt coins!CRYPTOCAP:AAVE is looking stronger than most for now. Local analysis has broken the bullish market structure on what appears to be a textbook Elliot Wave 1.
Price is testing quadruple support: Daily 200EMA, daily pivot, major support High Volume Node (HVN) and the 0.382-0.5 Fib retracements. This should be a tough nut to crack (as long as CRYPTOCAP:BTC doesn't dump hard).
Wave 2 retracement's are usually deep and come with a strong fear. It is where most retail investors capitulate only to find price turns around and continues bullishly without them in a aggressive wave 3.
Analysis is invalidated below $111, so quite a ways off yet.
If war escalation continue, irrational investor behaviour will likely break this technical analysis.
Safe trading.
Scaling back into $AAVE – 3x Leverage Setup📍Entry zone: $250 → $240 (scaled)
📍Support confluence:
• Daily Supertrend touch
• Rising trendline support
• Major horizontal level near $240
🛑 Stop Loss:
• 5% price move (→ $232.75 avg) = 15% capital loss at 3x
• Or Daily Supertrend flip (closes in ~9 hours)
🎯 TP1: $295 (trim 33%)
🎯 TP2: $372 (full exit)
⚖️ R/R Ratio: 8.29
• ✅ Reward: +124%
• ❌ Risk: -15%
Just booked +133% on the last one. Back in—structure’s still bullish until it’s not.
#AAVE/USDT#AAVE
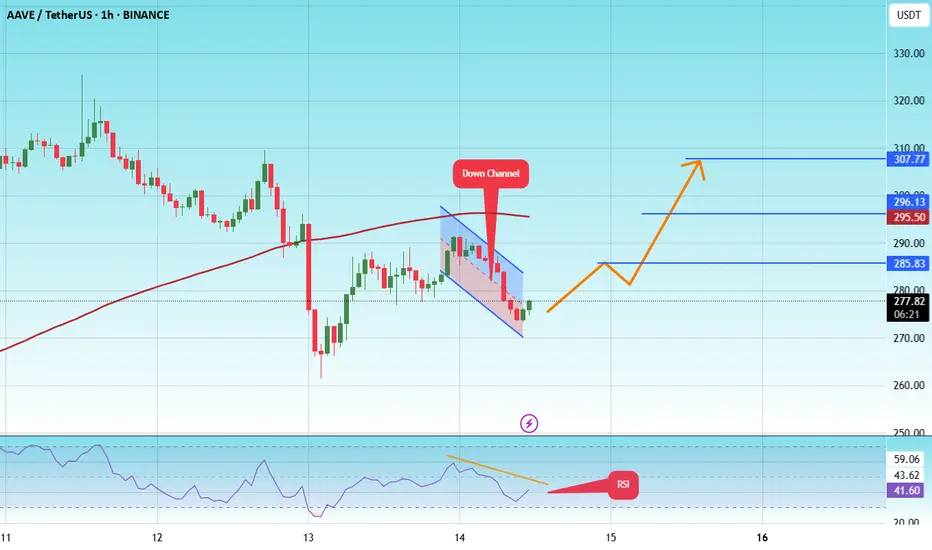
The price is moving within a descending channel on the 1-hour frame and is expected to break and continue upward.
We have a trend to stabilize above the 100 moving average once again.
We have a downtrend on the RSI indicator that supports the upward move with a breakout.
We have a support area at the lower limit of the channel at 268, acting as strong support from which the price can rebound.
Entry price: 277
First target: 285
Second target: 296
Third target: 307
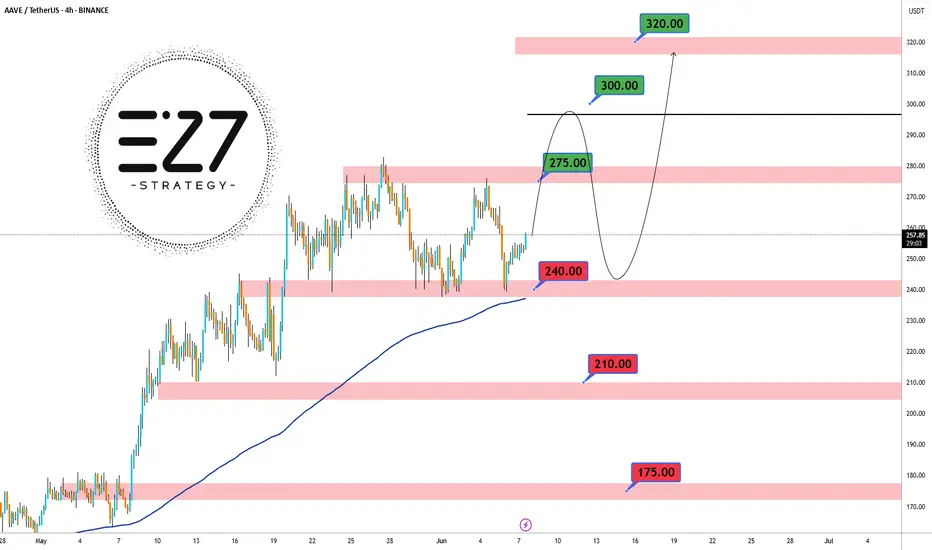
AAVEUSDT 📊The current price BINANCE:AAVEUSDT is trading in a range between 275 and 240 dollars, and it’s likely we’ll see a fake breakout to 300 dollars. After this move, the price is expected to correct to 240 dollars and then head for a bigger move toward 320 dollars and higher.
📈If the 240-dollar level breaks, the next support levels at 210 and 175 dollars should be watched.
🔼Support Levels: 240, 210, 175 dollars
🔽Resistance Levels: 275, 300, 320 dollars
Last Chance to Catch AAVE Before Liftoff! Retest Almost CompleteYello, Paradisers! Are you ready to catch the next big mover before the herd wakes up? #AAVE is now setting the stage for a potentially explosive move, and this retest might be the last stop before liftoff!
💎After forming the low of the inverse head and shoulders, AAVE has been riding an ascending channel, a structure that usually supports sustained bullish trends. Recently, price broke through the neckline of that pattern and is now retesting it, offering us a textbook technical setup.
💎#AAVEUSDT has been holding the neckline supports strongly at $275 to $265 levels. This is the critical area to watch. If bulls successfully defend this zone, we could see price push back up toward $310, which aligns with the midline of the ascending channel and represents the first resistance.
💎If momentum carries through and that level is cleared, AAVE has open skies toward the $370–$400 range. That’s the 52-week high zone, and it coincides with the top of the channel, making it a magnet for price if bullish momentum continues.
💎Adding to the bullish momentum, the EMA-50 and EMA-200 have just formed a golden cross. This alignment often leads to sustained upward moves, especially when backed by a strong structure like the ascending channel we're in now.
Paradisers, strive for consistency, not quick profits. Treat the market as a businessman, not as a gambler.
MyCryptoParadise
iFeel the success🌴

Aave Has Room To Go Lower, I Will Spot The ReversalAave outperformed many pairs. Total growth reached 185%. It even produced one final advance and peaked only two days ago, 11-June. But now the bears are in and taking control of the chart. A strong rise is balanced out by a strong drop.
I think this is a nice project, a great project a nice pair. The strategy here is all the same. Advanced traders go SHORT. The rest, wait for support to be established before going LONG. Wait for the drop to end before buying again.
Remember, there will be plenty of time and plenty of signals showing the low is in. I will be here posting charts everyday.
I will catch the perfect bottom on this retrace, the same we did 7-April. It will be easy.
In fact, we will spot the reversal even before it takes place.
Thanks for the follow and for your continued support.
Namaste.
Is AAVE About to Explode Above or Collapse? Key Levels to WatchYello Paradisers! Is #AAVE quietly prepping for a major breakout… or is this just another setup to wipe out the impatient bulls before the real move begins?
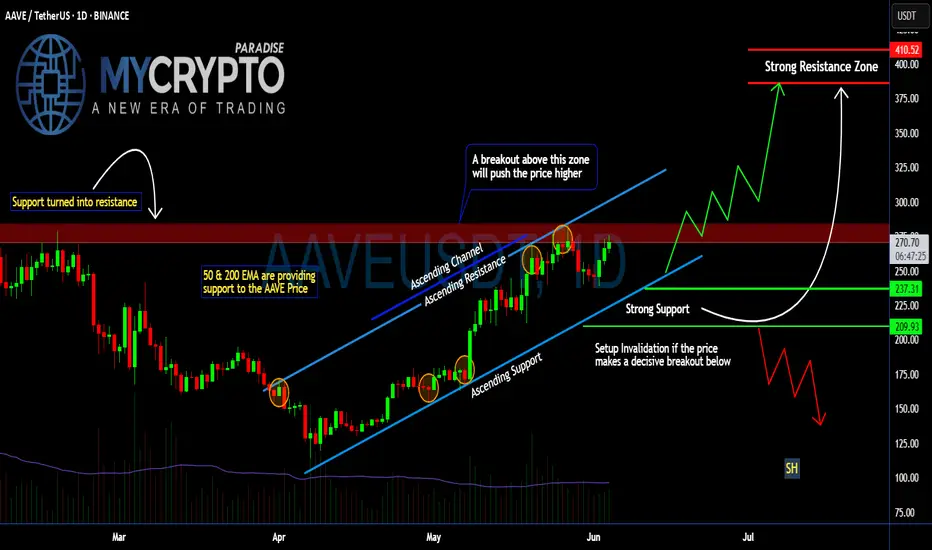
💎#AAVEUSDT is moving in a textbook ascending channel, respecting both trendline resistance and support beautifully. The structure is clean, but deceptive. While many may assume this is an easy path higher, seasoned traders know better — especially with what’s happening near the critical resistance zone.
💎The red resistance zone ($270–$280) that was previously a major support during the last cycle is now acting as heavy resistance again. #AAVEUSD is currently battling this zone after several failed attempts to break through. But the structure still leans bullish as long as we stay within the ascending channel.
💎Both the 50 & 200 EMA are now acting as dynamic support. This is key — if the price remains above these EMAs and the lower channel boundary, momentum favors the bulls. A decisive breakout above $280 could trigger a parabolic rally toward the $375–$410 range, a level where serious resistance and profit-taking are expected.
💎However… if bulls get lazy and we see a strong breakdown below the ascending channel, especially below $237, the setup gets shaky fast. A complete invalidation of the bullish case occurs if AAVE loses $209 — from there, expect a breakdown structure to unfold with a likely test of much lower levels and a possible retest of the $150 zone.
Trade smart, Paradisers. This setup will reward only the disciplined.
MyCryptoParadise
iFeel the success🌴
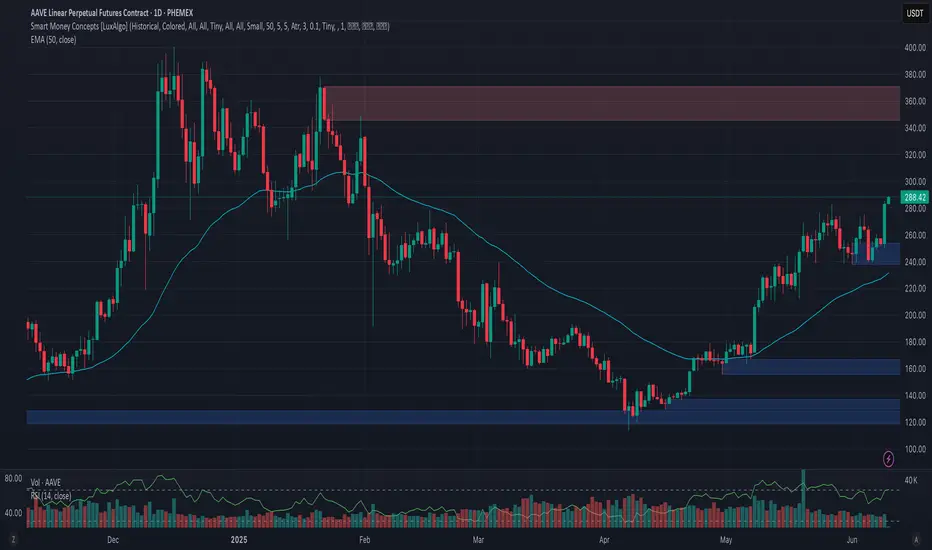
Phemex Analysis #88: Pro Tips for Trading Aave (AAVE)Aave ( PHEMEX:AAVEUSDT.P ), a leading decentralized lending protocol and one of the standout Layer 1 tokens, has attracted substantial trader interest recently by demonstrating remarkable resilience. Impressively, AAVE bounced back by approximately 100% from its recent low of $113 on April 7. Adding to this optimism, AAVE broke through a significant resistance at $282 just yesterday, potentially signaling a bullish continuation.
However, traders must proceed with caution, as this recent upward breakout was accompanied by relatively lower trading volume and a weaker Relative Strength Index (RSI) compared to the previous bullish surge seen on May 27. These factors introduce uncertainty into AAVE’s near-term trajectory, prompting the need for careful evaluation of possible scenarios over the next few days.
Possible Scenarios
1. Continued Bullish Momentum
Despite the RSI divergence observed during this latest peak, AAVE may continue its upward momentum, driven by sustained investor enthusiasm and broader market conditions. Traders should closely monitor price action around immediate resistance levels for short-term profit opportunities.
Pro Tips:
Profit Taking: Consider locking in short-term gains as AAVE approaches significant resistance areas, particularly at around $333 and subsequently at $370.
Risk Management: Set protective stop-loss orders below the recent support at $250 to limit potential losses in case market sentiment shifts suddenly.
2. Limited Rise Followed by Sharp Rejection
Another plausible scenario involves AAVE rising moderately higher but facing strong selling pressure near critical resistance levels, such as $300 and $333. A rejection at these levels could trigger a sharp corrective move, particularly if accompanied by increased selling volume.
Pro Tips:
Cautious Entries: Be cautious about initiating long positions near these resistance zones. Instead, wait for clear signals or confirmations before entering.
Short Opportunities: Experienced traders could potentially capitalize on short-selling opportunities if strong rejection signals manifest at these resistance levels.
3. Retest of Lower Support Levels
Given the relatively weak volume accompanying the recent breakout, there is a potential third scenario in which AAVE retests lower support areas. A pullback towards previously broken resistance (now support) at around $282, or even further down to around $250 & $238, might occur as the market tests buyer strength.
Pro Tips:
Observe Volume: Pay close attention to trading volumes if prices decline. Low-volume pullbacks could present good accumulation opportunities at support levels.
Accumulation Strategy: Consider cautiously accumulating positions near $250 or $238 only after clear signs of price stabilization and potential reversal appear.
Conclusion
While Aave (AAVE) showcases impressive strength and investor confidence, the current RSI divergence and volume trends suggest caution. By closely monitoring the outlined scenarios and implementing disciplined risk management strategies, traders can better navigate the uncertainty and volatility surrounding AAVE’s current market conditions.
🔥 Tips:
Break free from "buy low, sell high"! Our new Pilot Contract empowers you to profit from ANY market direction on DEX coins with up to 3x leverage. Go long, go short, go further!
Check out Phemex - Pilot Contract today!
Disclaimer: This is NOT financial or investment advice. Please conduct your own research (DYOR). Phemex is not responsible, directly or indirectly, for any damage or loss incurred or claimed to be caused by or in association with the use of or reliance on any content, goods, or services mentioned in this article.