AAVE: Approaching SupportTrade setup : Price remains in a Downtrend until it breaks above the 200-day moving average (~$100). After a failed breakout from Channel Down pattern, price dipped back below 200-day moving average and reached $80 support. That's a level where price has found support several times in the past and could be a swing trade entry. This is a riskier trade setup because it’s against the overall downtrend.
Pattern : Price is Approaching Support , which is a level where it could pause or reverse its recent decline, at least temporarily. Support is often a level where price has bounced up in the past, or potentially prior Resistance level that was broken. (concept known as polarity). Once price breaks below support, it can move lower to the next support level. Learn to trade key levels in Lesson 7.
Trend : Short-term trend is Strong Down, Medium-term trend is Strong Down and Long-term trend is Strong Down.
Momentum is Bearish (MACD Line crossed below MACD Signal Line) BELOW days ago. Price is neither overbought nor oversold currently, based on RSI-14 levels (RSI > 30 and RSI < 70).
Support and Resistance : Nearest Support Zone is $70.00. Nearest Resistance Zone is $90.00, then $115.00.
Aavetether

AAVE: Channel DownTrade setup : Price is in a downtrend, trading in a Channel Down pattern. We wait for a breakout, ideally above $100 resistance and 200-day moving average, to signal bullish trend reversal.
Pattern : Price is trading in a Channel Down pattern. With emerging patterns, traders who believe the price is likely to remain within its channel can initiate trades when the price fluctuates within its channel trendlines. With complete patterns (i.e. a breakout) – initiate a trade when the price breaks through the channel’s trendlines, either on the upper or lower side. When this happens, the price can move rapidly in the direction of that breakout. Learn to trade chart patterns in Lesson 8.
Trend : Downtrend across all time horizons (Short- Medium- and Long-Term).
Momentum is Mixed as MACD Line is above MACD Signal Line (Bullish) but RSI ~ 50 (Neutral).
Support and Resistance : Nearest Support Zone is $80, then $60. The nearest Resistance Zone is $105 (previous support), then $130 and $150.

AAVE: Approaching SupportTrade setup : Trends are mixed to down. After a bearish breakout from a Channel Up pattern, price broke below 200-day moving average, which is a sign of downtrend. Trend Traders: It bounced off of $80 support and could approach $100 but it’s a higher risk trade setup since overall trend is down. Price needs to break back above 200-day MA (~$100) to resume its uptrend.
Trend : Downtrend across all time horizons (Short- Medium- and Long-Term).
Momentum is Mixed as MACD Line is above MACD Signal Line (Bullish) but RSI ~ 50 (Neutral).
Support and Resistance : Nearest Support Zone is $80, then $60. The nearest Resistance Zone is $105 (previous support), then $130 and $150.

AAVE: Approaching SupportTrade setup : Trends are mixed to down. After a bearish breakout from a Channel Up pattern, price broke below 200-day moving average, which is a sign of downtrend.
Trend Traders : It’s now sitting at $80 support, which held up a couple of times recently and could be a swing trade entry but it’s a higher risk trade setup since overall trend is down. Price needs to break back above 200-day MA (~$100) to resume its uptrend.
Trend : Downtrend across all time horizons (Short- Medium- and Long-Term).
Momentum is Mixed as MACD Line is above MACD Signal Line (Bullish) but RSI < 45 (Bearish). MACD Histogram bars are declining, which suggests that momentum is weakening.
Support and Resistance : Nearest Support Zone is $80, then $60. The nearest Resistance Zone is $105 (previous support), then $130 and $150.

AAVE: Approaching SupportTrade setup : Trends are mixed to down. After a bearish breakout from a Channel Up pattern, price broke below 200-day moving average, which is a sign of downtrend. Trend Traders: Price needs to break back above 200-day MA (~$100) to resume its uptrend.
Trend : Downtrend on Short- and Medium-Term basis and Neutral on Long-Term basis.
Momentum is Mixed as MACD Line is above MACD Signal Line (Bullish) but RSI < 45 (Bearish).
Support and Resistance : Nearest Support Zone is $80, then $60. The nearest Resistance Zone is $105 (previous support), then $130 and $150.

AAVE: Approaching ResistanceTrade setup : Trends are mixed to down. After a bearish breakout from a Channel Up pattern and below 200-day moving average, price bounced up from $80 support and could swing up to $100 again (200-day MA). Trend Traders: Price needs to break back above 200-day MA (~$100) to resume its uptrend.
Trend : Downtrend on Short- and Medium-Term basis and Neutral on Long-Term basis.
Momentum is Mixed as MACD Line is above MACD Signal Line (Bullish) but RSI < 45 (Bearish).
Support and Resistance : Nearest Support Zone is $80, then $60. The nearest Resistance Zone is $105 (previous support), then $130 and $150.

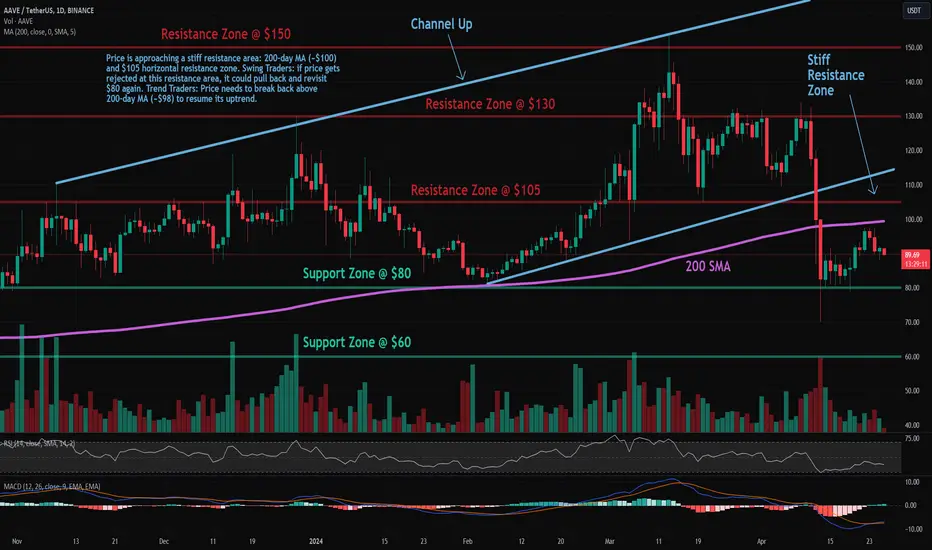
AAVE: Approaching ResistanceTrade setup : Trends are mixed. Price had a bearish breakout from a Channel Up pattern and below 200-day moving average. It got oversold (RSI ~ 30) and bounced off of $80 support. Now it’s approaching a stiff resistance area: 200-day MA (~$100) and $105 horizontal resistance zone.
Swing Traders: if price gets rejected at this resistance area, it could pull back and revisit $80 again.
Trend Traders: Price needs to break back above 200-day MA (~$98) to resume its uptrend.
Trend : Downtrend on Short- and Medium-Term basis and Uptrend on Long-Term basis.
Momentum is Mixed as MACD Line is above MACD Signal Line (Bullish) but RSI < 45 (Bearish).
Support and Resistance : Nearest Support Zone is $80, then $60. The nearest Resistance Zone is $105 (previous support), then $130 and $150.
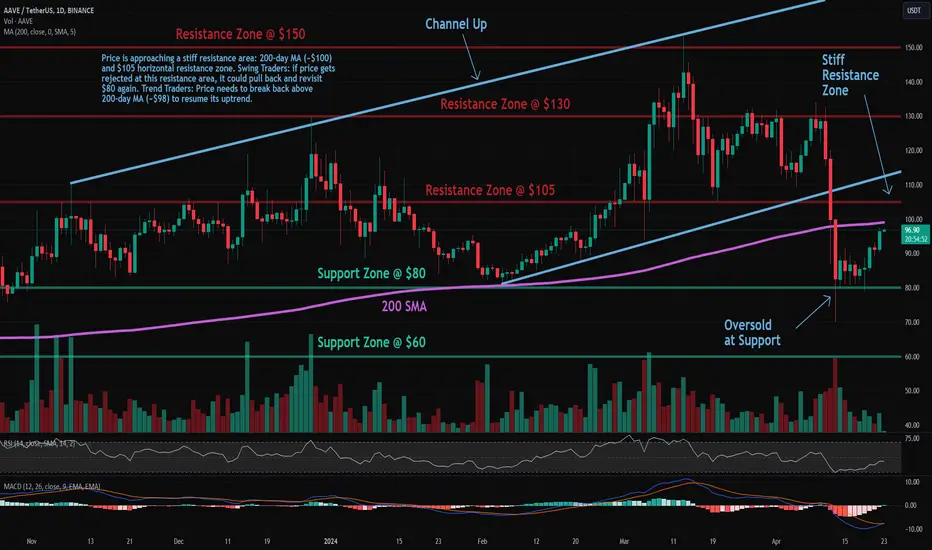
AAVE: Approaching ResistanceTrade setup : Trends are mixed. Price had a bearish breakout from a Channel Up pattern and below 200-day moving average. It got oversold (RSI ~ 30) and bounced off of $80 support. Now it’s approaching a stiff resistance area: 200-day MA (~$100) and $105 horizontal resistance zone. Swing Traders: if price gets rejected at this resistance area, it could pull back and revisit $80 again. Trend Traders: Price needs to break back above 200-day MA (~$98) to resume its uptrend.
Trend : Downtrend on Short- and Medium-Term basis and Uptrend on Long-Term basis.
Momentum is Bearish but inflecting. MACD Line is below MACD Signal Line and RSI is below 45 but momentum may have bottomed since MACD Histogram bars are rising, which suggests that momentum could be nearing another upswing.
Support and Resistance : Nearest Support Zone is $80, then $60. The nearest Resistance Zone is $105 (previous support), then $130 and $150.
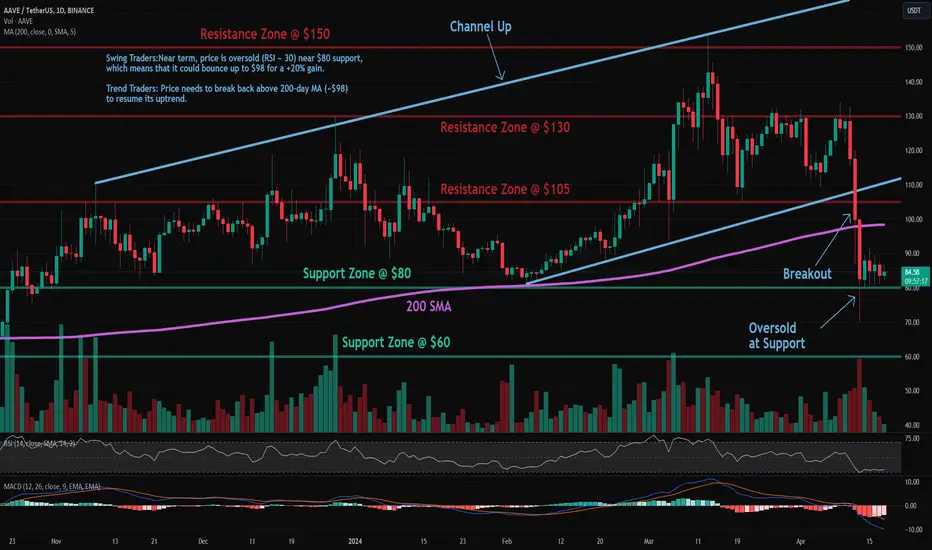
AAVE: Oversold at SupportTrade setup : Trends are mixed. Price had a bearish breakout from a Channel Up pattern and below 200-day moving average.
Swing Traders: Near term, price is oversold (RSI ~ 30) near $80 support, which means that it could bounce up to $98 for a +20% gain.
Trend Traders: Price needs to break back above 200-day MA (~$98) to resume its uptrend.
Pattern : Price was trading in a Channel Up pattern. With complete patterns (i.e. a breakout) – initiate a trade when the price breaks through the channel’s trendlines, either on the upper or lower side. When this happens, the price can move rapidly in the direction of that breakout.
Trend : Downtrend on Short- and Medium-Term basis and Uptrend on Long-Term basis.
Momentum is Bearish but inflecting. MACD Line is below MACD Signal Line and RSI is below 45 but momentum may have bottomed since MACD Histogram bars are rising, which suggests that momentum could be nearing another upswing.
Support and Resistance : Nearest Support Zone is $80, then $60. The nearest Resistance Zone is $105 (previous support), then $130 and $150.
AAVE: Oversold at SupportTrade setup : Trends are mixed. Price had a bearish breakout from a Channel Up pattern and below 200-day moving average.
Swing Traders:Near term, price is oversold (RSI ~ 30) near $80 support, which means that it could bounce up to $98 for a +20% gain.
Trend Traders: Price needs to break back above 200-day MA (~$98) to resume its uptrend.
Pattern : Price was trading in a Channel Up pattern. With complete patterns (i.e. a breakout) – initiate a trade when the price breaks through the channel’s trendlines, either on the upper or lower side. When this happens, the price can move rapidly in the direction of that breakout.
Trend : Downtrend on Short-Term basis, Neutral on Medium-Term basis and Uptrend on Long-Term basis.
Momentum is Bearish (MACD Line is below MACD Signal Line, and RSI is below 45).
Support and Resistance : Nearest Support Zone is $80, then $60. The nearest Resistance Zone is $105 (previous support), then $130 and $150.

AAVE: Channel Up PatternTrade setup : Price remains in an Uptrend. It’s trading in a Channel Up pattern. Swing Traders can enter near channel support trendline, which is also near $105 horizontal support, and exit near channel resistance trendline (~$150). Stop Loss (SL) level at $93.
Pattern : Price is trading in a Channel Up pattern. With emerging patterns, traders who believe the price is likely to remain within its channel can initiate trades when the price fluctuates within its channel trendlines. With complete patterns (i.e. a breakout) – initiate a trade when the price breaks through the channel’s trendlines, either on the upper or lower side. When this happens, the price can move rapidly in the direction of that breakout.
Trend : Uptrend across all time horizons (Short- Medium- and Long-Term).
Momentum is Mixed as MACD Line is above MACD Signal Line (Bullish) but RSI ~ 50 (Neutral).
Support and Resistance : Nearest Support Zone is $105, then $80. The nearest Resistance Zone is $130, then $150 and $200.

AAVE: Channel Up PatternTrade setup : Price remains in an Uptrend. It’s trading in a Channel Up pattern. Swing Traders can enter near channel support trendline, which is also near $105 horizontal support, and exit near channel resistance trendline (~$150). Stop Loss (SL) level at $93.
Pattern : Price is trading in a Channel Up pattern. With emerging patterns, traders who believe the price is likely to remain within its channel can initiate trades when the price fluctuates within its channel trendlines. With complete patterns (i.e. a breakout) – initiate a trade when the price breaks through the channel’s trendlines, either on the upper or lower side. When this happens, the price can move rapidly in the direction of that breakout.
Trend : Neutral on Short-Term basis and Uptrend on Medium- and Long-Term basis.
Momentum is Mixed as MACD Line is below MACD Signal Line (Bearish) but RSI ~ 50 (Neutral). MACD Histogram bars are rising, which suggests that momentum could be nearing another upswing.
Support and Resistance : Nearest Support Zone is $105, then $80. The nearest Resistance Zone is $130, then $150 and $200.

AAVE: Channel Up PatternTrade setup : Price remains in an Uptrend. It’s trading in a Channel Up pattern. Swing Traders can enter near channel support trendline, which is also near $105 horizontal support, and exit near channel resistance trendline (~$150). Stop Loss (SL) level at $93.
Pattern : Price is trading in a Channel Up pattern. With emerging patterns, traders who believe the price is likely to remain within its channel can initiate trades when the price fluctuates within its channel trendlines. With complete patterns (i.e. a breakout) – initiate a trade when the price breaks through the channel’s trendlines, either on the upper or lower side. When this happens, the price can move rapidly in the direction of that breakout.
Trend : Downtrend on Short-Term basis and Uptrend on Medium- and Long-Term basis.
Momentum is Mixed as MACD Line is below MACD Signal Line (Bearish) but RSI ~ 50 (Neutral).
Support and Resistance : Nearest Support Zone is $105, then $80. The nearest Resistance Zone is $130, then $150 and $200.

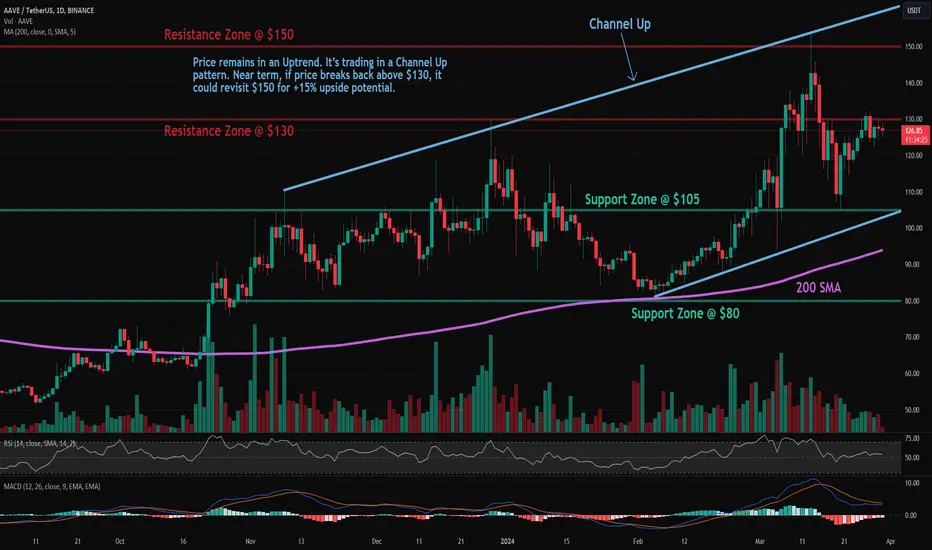
AAVE: Channel UpTrade setup : Price remains in an Uptrend. It’s trading in a Channel Up pattern. Near term, if price breaks back above $130, it could revisit $150 for +15% upside potential.
Pattern : Price is trading in a Channel Up pattern. With emerging patterns, traders who believe the price is likely to remain within its channel can initiate trades when the price fluctuates within its channel trendlines. With complete patterns (i.e. a breakout) – initiate a trade when the price breaks through the channel’s trendlines, either on the upper or lower side. When this happens, the price can move rapidly in the direction of that breakout.
Trend : Uptrend across all time horizons (Short- Medium- and Long-Term).
Momentum is Mixed as MACD Line is below MACD Signal Line (Bearish) but RSI > 55 (Bullish). MACD Histogram bars are rising, which suggests that momentum could be nearing another upswing.
Support and Resistance : Nearest Support Zone is $105, then $80. The nearest Resistance Zone is $130, then $150 and $200.
AAVE: Falling Wedge BreakoutTrade setup : Bullish breakout from a Falling Wedge pattern was confirmed by a break above the prior swing high of $95 (also resistance). This could signal a bullish trend reversal with +20% upside potential to $120. Stop Loss (SL) at $87, just below the prior swing low.
Patterns : Falling Wedge Usually results in a bullish breakout. When price breaks the upper trend line the price is expected to trend higher. Emerging patterns (before a breakout occurs) can be traded by swing traders between the convergence lines; however, most traders should wait for a completed pattern with a breakout and then place a BUY order.
Trend : Uptrend on Short- and Medium-Term basis and Neutral on Long-Term basis.
Momentum is Bullish (MACD Line is above MACD Signal Line and RSI is above 55).
Support and Resistance : Nearest Support Zone is $80. The nearest Resistance Zone is $95, which it broke, then $120, and $130.

AAVE: Falling Wedge BreakoutTrade setup : Bullish breakout from a Falling Wedge pattern needs to be confirmed by a break above the prior swing high of $95 (also resistance). If it does, price could signal a bullish trend reversal with +20% upside potential to $120 thereafter.
Patterns : Falling Wedge Usually results in a bullish breakout. When price breaks the upper trend line the price is expected to trend higher. Emerging patterns (before a breakout occurs) can be traded by swing traders between the convergence lines; however, most traders should wait for a completed pattern with a breakout and then place a BUY order.
Trend : Uptrend on Short-Term basis, Downtrend on Medium-Term basis and Neutral on Long-Term basis.
Momentum is Mixed as MACD Line is above MACD Signal Line (Bullish) but RSI ~ 50 (Neutral).
Support and Resistance : Nearest Support Zone is $80. The nearest Resistance Zone is $95 (previous support), then $120, and $130.

AAVE: Falling WedgeTrade setup : Consolidating in a Falling Wedge pattern. Trend Traders: wait for a breakout, which could signal a potential bullish trend reversal. Swing Traders: Pullback near $80 support could be a swing trade entry with +15% upside potential back to $90 near-term. That $80 horizontal support level also lines up with a 200-day moving average, making it a robust support zone. Stop Loss (SL) at $75 (just below support zone).
Patterns : Falling Wedge Usually results in a bullish breakout. When price breaks the upper trend line the price is expected to trend higher. Emerging patterns (before a breakout occurs) can be traded by swing traders between the convergence lines; however, most traders should wait for a completed pattern with a breakout and then place a BUY order.
Trend : Downtrend on Short- and Medium-Term basis and Uptrend on Long-Term basis.
Momentum is Bearish (MACD Line is below MACD Signal Line, and RSI is below 45).
Support and Resistance : Nearest Support Zone is $80. The nearest Resistance Zone is $95 (previous support), then $115, and $125.
