AAVE Spot SetupAAVE right now is on a support level of 261$ and it can hold it if BTC does not want to go under 57K so with risk management I think right now is a really good price to enter one more step, and if BTC starts a new bullish leg then AAVE can give us a really good profit, I personally think right now AAVE is undervalued.
Aaveusdt
AAVE USDT Big DiscountI hope you enjoy these discounts
Do not forget to like and comment
Your own risk

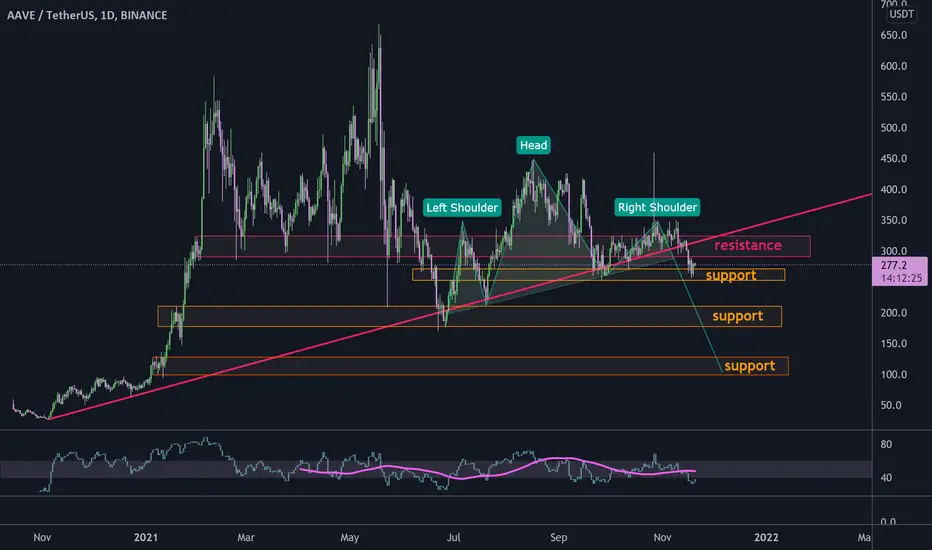
AAVE head and shoulders drop to $100#AAVEUSDT
$AAVE broke down from long term ascending support that can be the neckline of head and shoulders pattern.
now price is above a support zone that can have a pullback to broken neckline, then drop more to $100 that is the target of H&S pattern.
but if price bounce above resistance zone the bearish scenario will be invalid.
AAVE DAILY NEAR FUTURE PREDICTIONSTechnical Analysis Summary (POLKADOT)
AAVE/USDT
TREND ANALYSIS
We have 2 downtrend which is currently active in red.
The wider (weekly trend ) is stronger than the Daily trend.
FUTURE PREDICTIONS
We have many resistanse and support levels that I have mentioned above.
I use thickness as an indicator of stregth of levels (ONLY FOR VISUALS).
Yellow support level are levels from the past (more for explanation purposes rather than entry points) where we could have seen the laddering upward that was happening from the first daily level to second to third.
Good luck everyone, stay safe!
If you need help don't hesitate to send me a message or comment
Trading Involves High Risk
Not Financial Advice
Exercise Proper Risk Management

AAVE 4H - Upside PotentialHello friends, today I am reviewing the 4H chart for AAVE, a crypto altcoin on a linear scale.
In the chart I noted:
1) The price has been in a descending channel since November 9, 2021.
2) The price hit the bottom long term trendline multiple times on November 18, 2021.
3) The price target for the breakout is around $304, which is a 10% upside. This is also a resistance area.
4) If the price can breakout of the resistance area, it could go as high as $347 or about 25% upside.
5) The Ichimoku Cloud is holding the price down so we may not immediately touch the top of the trendline.
6) The RSI (relative strength index) just broke out of a multi-day trend out of the oversold area.
7) The volume seems very low.
What are your opinions on this?
If you enjoy my ideas, feel free to like it and drop in a comment. I love reading your comments below.
Disclosure: This is just my opinion and not any type of financial advice. I enjoy charting and discussing technical analysis . Don't trade based on my advice. Do your own research! #cryptopickk

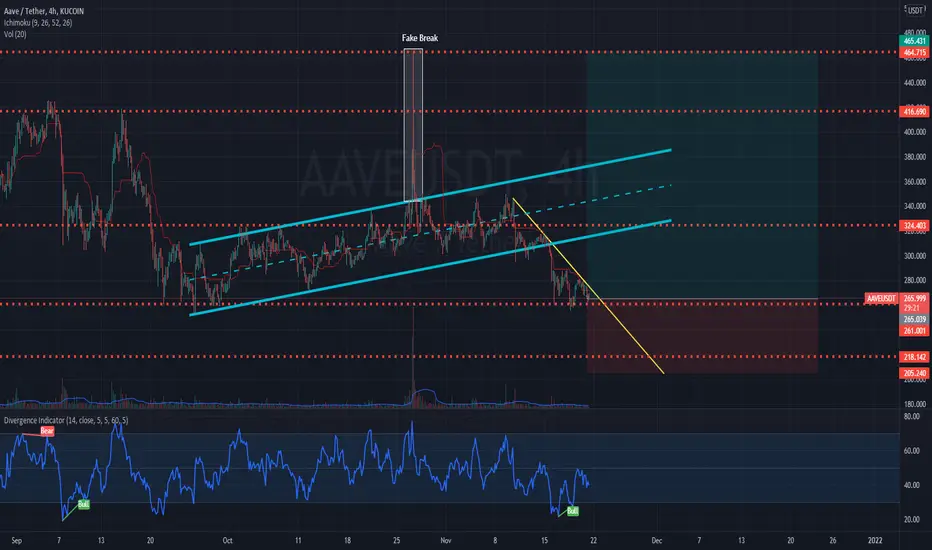
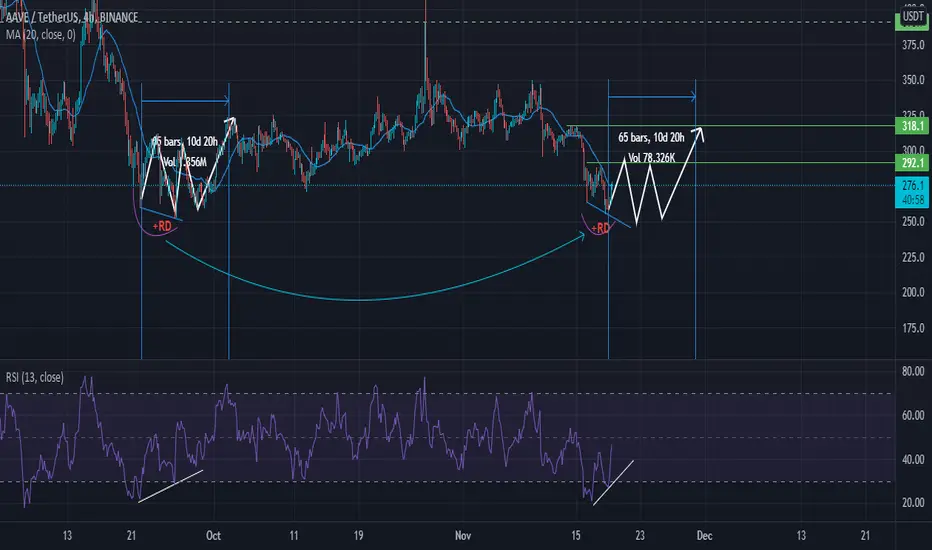
AAVEUSDT analysis professional AlirezaHajianFor the AAVEUSDT analysis, you can see that two symmetric patterns are being completed at the end of 3 months. Given the positive divergence and the correction to $ 255 support over the next 50 to 60 days, we will see such fluctuations as the previous pattern, which will eventually lead to growth to $ 318-320.
REVERSAL COMMING FOR AAVE?!in my opinon AAVE can make a reversal from this zone. i will look for longs after break and retest of resistance and trendline.

aave about to go on a rallyi tried to expirement on this but it is still inline with my analysis each indicators looking good
and each price i gave i am confident you coud even hold till it re hits 550
bottom line great prices for aave
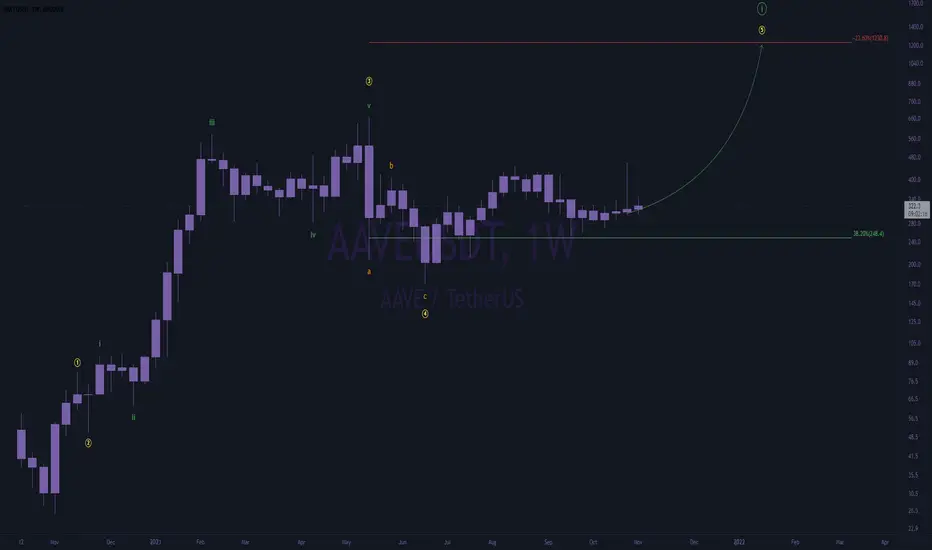
aave w5 swing~hello there, hope everyone is enjoying this pulchritudinous weekend ~
was scanning through some alts today as usual, looking for the next swing (not many recently due to things looking toppish)
found 3 swings which might be worth taking \\ bch, shib, and aave.
(not taking any of these trades just yet, but i might in the days ahead)
aave wave 5 target = $1200
ps. this is a longer term swing, it could take awhile to play out - don't expect this move to happen overnight.
Aave (AAVE) - November 15Hello?
Welcome, traders.
By "following", you can always get new information quickly.
Please also click "Like".
Have a nice day.
-------------------------------------
(AAVEUSD 1W Chart) - Medium to Long-Term Perspective
Above 101.345455 point: expected to continue uptrend
(1D chart)
First resistance section: 419.933-472.221304
Second resistance section: near 629.086220 point
Support section: 158.491471-210.779774
To break out of the downtrend line, we need to see if we can sustain the price above the 315.356387 point.
A decline from the 278.418499 point may lead to a fall into the support zone, so trade cautiously.
The 300.459751-382.934264 section is a section for sale that is formed in the high point section.
Therefore, you should maintain the price in this area and break out of the downtrend line.
------------------------------------------
(AAVEBTC 1W chart)
Above the 0.002157-0.002829 section: expected to continue uptrend
------------------------------------------
We recommend that you trade with your average unit price.
This is because, if the price is below your average unit price, whether it is in an uptrend or in a downtrend, there is a high possibility that you will not be able to get a big profit due to the psychological burden.
The center of all trading starts with the average unit price at which you start trading.
If you ignore this, you may be trading in the wrong direction.
Therefore, it is important to find a way to lower the average unit price and adjust the proportion of the investment, ultimately allowing the funds corresponding to the profits to regenerate themselves.
------------------------------------------------------------ -----------------------------------------------------
** All indicators are lagging indicators.
Therefore, it is important to be aware that the indicator moves accordingly with the movement of price and volume.
However, for the sake of convenience, we are talking in reverse for the interpretation of the indicator.
** The MRHAB-O and MRHAB-B indicators used in the chart are indicators of our channel that have not yet been released.
(Since it is not publicly available, you can use this chart without any restrictions by sharing this chart and copying and pasting the indicators.)
** The wRSI_SR indicator is an indicator created by adding settings and options to the existing Stochastic RSI indicator.
Therefore, the interpretation is the same as the traditional Stochastic RSI indicator. (K, D line -> R, S line)
** The OBV indicator was re-created by applying the formula to the DepthHouse Trading indicator, an indicator disclosed by oh92. (Thanks for this.)
** Support or resistance is based on the closing price of the 1D chart.
** All descriptions are for reference only and do not guarantee a profit or loss in investment.
(Short-term Stop Loss can be said to be a point where profit and loss can be preserved or additional entry can be made through split trading. It is a short-term investment perspective.)
---------------------------------

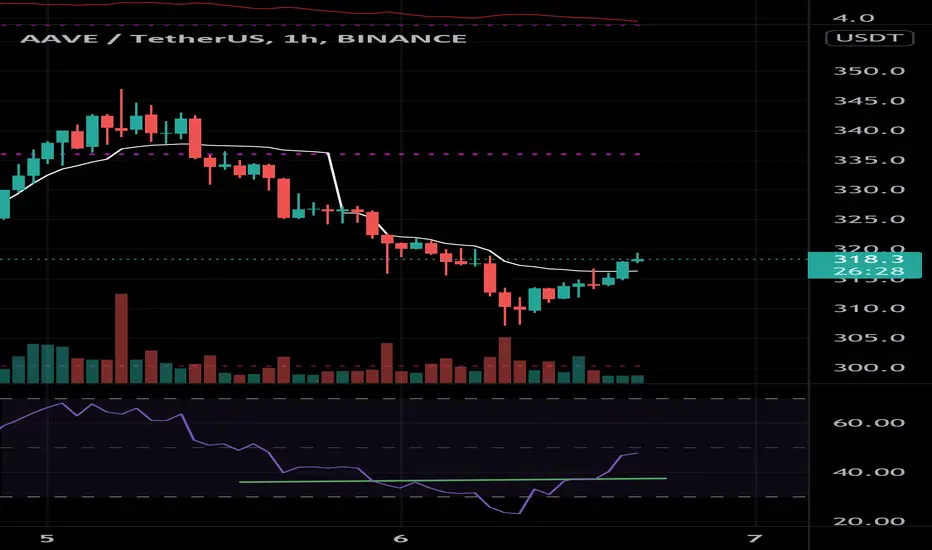
Divergence on the relative strength index Hidden divergence in the rsi on 1h time frame
Showing the bottom is almost reached and soon we will see a move to the upside, I am watching closely I took profits on my positions and am still holding all other positions.

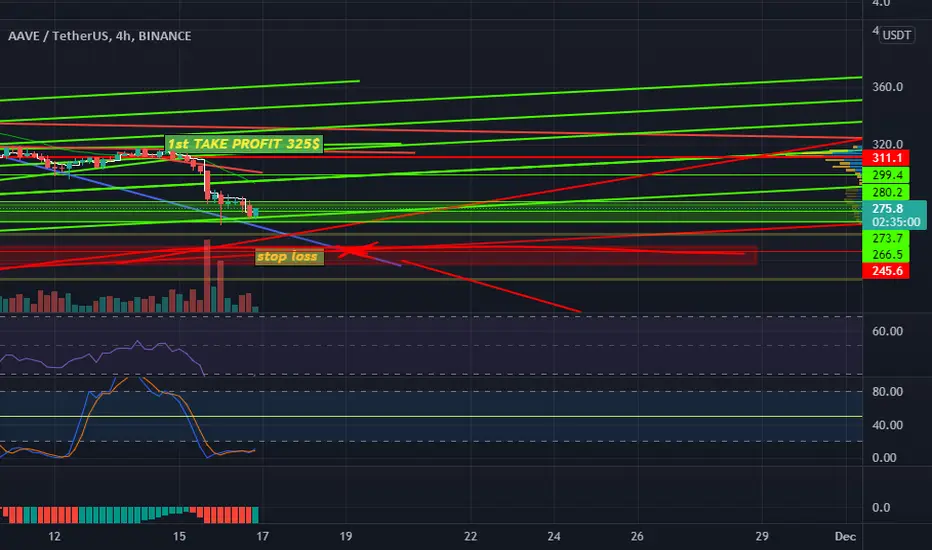
AAVE: A Turn for The Bearish?My Fellow Crypto Traders,
Appreciate you taking the time to view my analysis which I hope you may find beneficial. Please be sure to “LIKE” if you indeed find my analysis useful and/or find my analysis intriguing.
Cheers & Happy Trading!
#AAVEUSDT 3H Chart
Price was consolidating between the support at $300 and the resistance at $350. MACD is showing bearish weakness, RSI is sold and price is trading below EMA ribbon. Huge liquidity was resting below the support which price took out recently liquidating all long positions from this area also leaving a freshly printed supply zone and an imbalance. Liquidity is still resting above the resistance at $350 meaning the supply zone will most probably not hold as much and we should see bullish movements sooner or later.

AAVE/ETH Golden Buying OpportunityAAVE/ETH Is Bottomed Out On Daily And Weekly Time frame Currently Trading On its demand zone Can Be an excellent Buying Opportunity
:)

AAVE Coin Breakout Probability. Next MoveAAVE is moving in Bullish Pennant, I have made a resistance for it and support if it breaks 350$ and sustain their their is high Possibility of going it to 400$. If you like my idea consider Following for such more ideas.

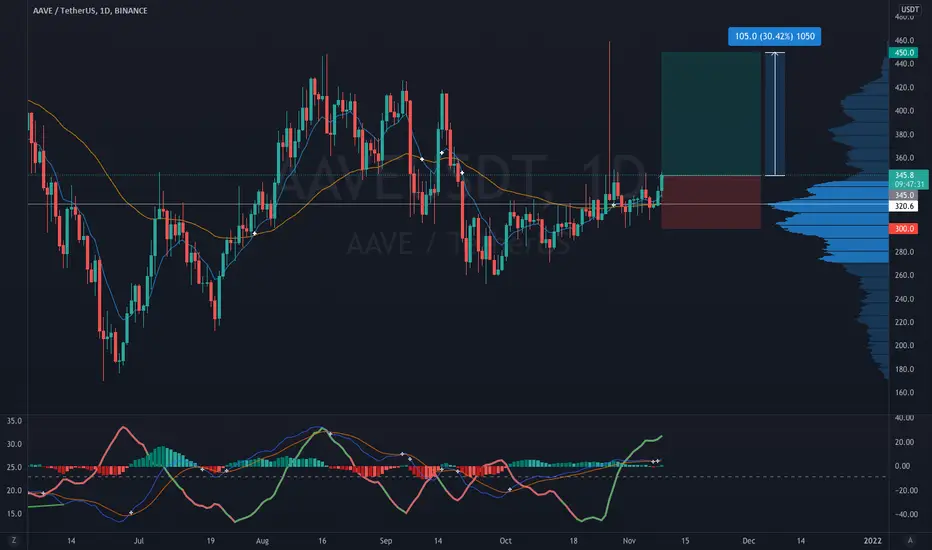
AAVEUSDT daily analysisAAVE has been in the accumulation zone for a while and is now ready for a nice bull run.
I believe that it can reach a little higher than its maximum of the last few months, reaching $450
Target 1: $380
Target 2: $414
Target 3: $450
AAVEUSDTAAVEUSDT
Daily time
✅Buy Recommendation
✅Break downtrend-line
✅on an important support range
AAVE Looks Very GoodIf you look at the channel I draw the first thing you will notice is the price is in the lowest part of the channel and as you are aware the daily view is a very powerful view, in candlestick view, we can see hammer candles that show us the power of bulls and I think at least we are going to touch the mid of the channel in this bull market, Specially if BTC and BTC.D do not mess things up ;D

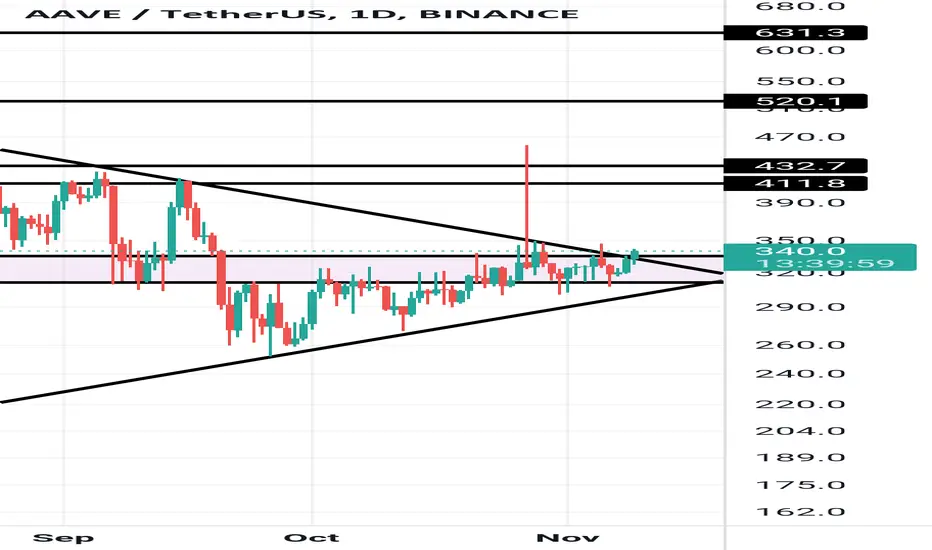
AAVE/weekThis is my idea for AAVE token on weeks. I get a prediction that the price will move sideways to at least a few weeks before can go high.
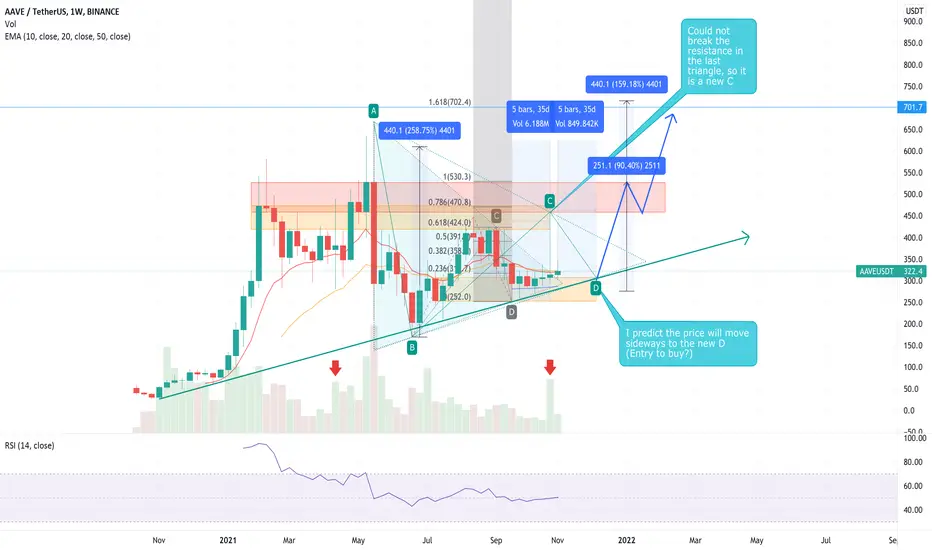
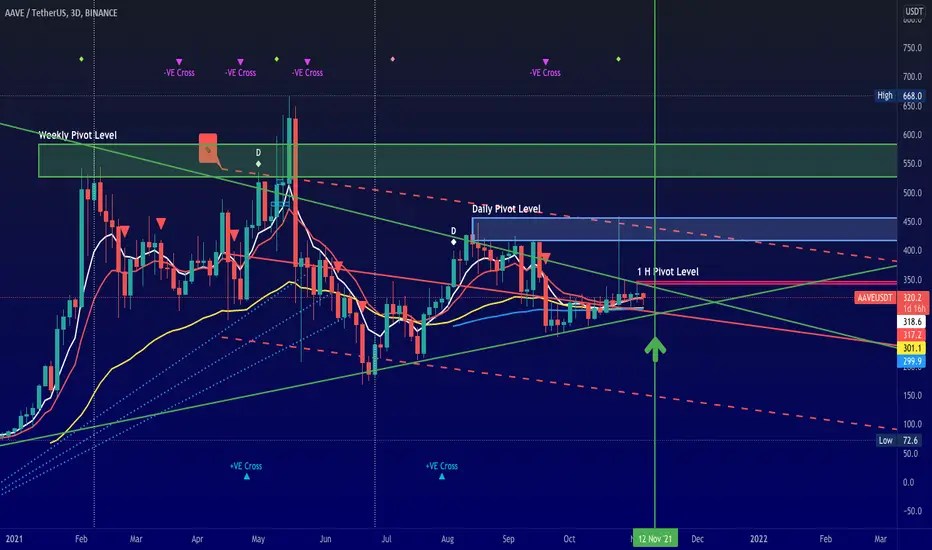
AAVE - 12th Nov breakout prediction (AAVEUSDT)Giving date for a breakout has never been easy.
It is a clear triangle breakout on higher time frames for AAVEUSDT. This weekly chart triangle scaled down to 3Day chart shows that there is a possible breakout that can happen on 12th NOv.
I will start writing how to trade section so that readers can plan their trades accordingly.
How to trade this?
Let the breakout happen on 12th Nov, check Falcon CCI and look for buy signal - when golden color CCI crosses red color EMA.
Wait for Retest to happen on 1H pivot level marked
This is easy 40%++

Inverse head and shoulder on rsi AAVEInverse head and shoulder on the relative strenght index for aave same as dot
Good sign for a very big move today,
I am very busy today so I am not taking time to write targets but just a trade signal for anyone looking for an entry