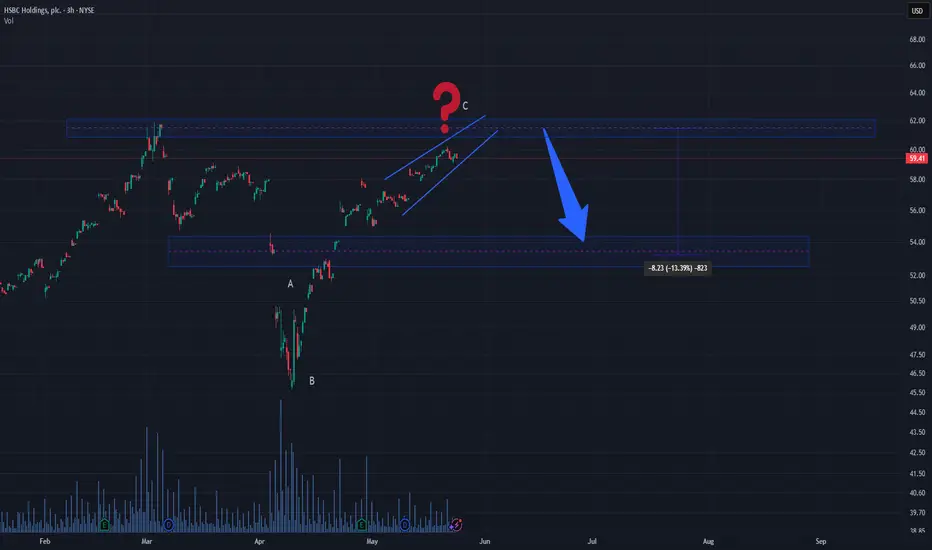
HSBC (HSBC) – $54 Risk Zone if ABC Correction Is Triggered HSBCHSBC is currently trading within a rising wedge, but a potential short-term drop of approximately 5% could trigger a full ABC correction pattern. This scenario is not confirmed yet, as the chart remains structurally bullish.
However, should the price reverse and break below the rising channel, it would likely mark the start of wave C, completing an A-B-C corrective sequence. This development could lead the price toward the $54 support zone, which aligns with a previous demand area.
While there is no immediate breakdown or weakness, traders should remain alert. A simple -5% drop might be all it takes to activate the next phase of correction.
Pattern: Potential ABC correction
Trigger: 5% decline from current levels
Target: $54
Bias: Neutral – watch for reaction if price softens
Abc-correction
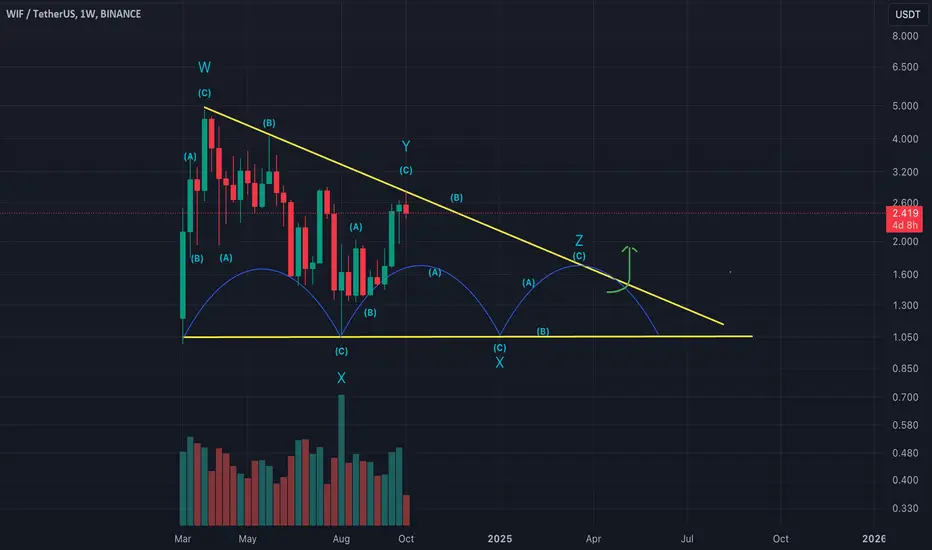
WIF Stuck in a Wedge Pattern: Patience is Key For a BreakoutWIF is forming a very long but distinct WXYXZ wedge pattern, tightly confined within its channel. The structure is clear, with repeated ABC corrective waves confirming the pattern’s integrity. While the setup is clear, it suggests we may have to trade within the boundaries of the channel for now.
For those looking to trade short-term, focus on the key levels within the wedge, but be prepared to wait patiently for the eventual breakout—it could take time, but when it happens, it should be significant.
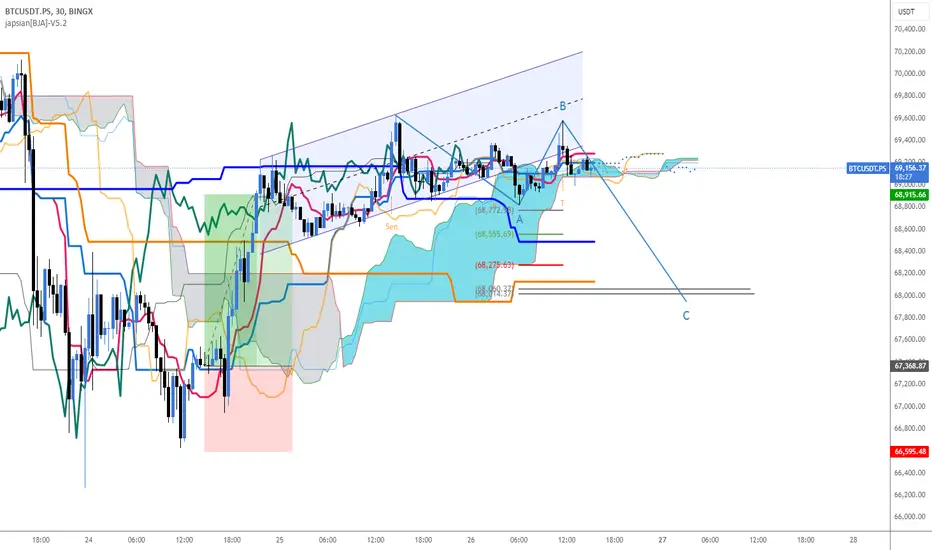
#BTC #Bitcoin correction to $68,000 range#Bitcoin will correct up to the $68,000 range under the ABC pattern.
IBM daily bearish hammer end of wave 5 expect ABC correctionOrder SELL IBM NYSE Stop 136.56 LMT 136.56 will be automatically canceled at 20230401 01:00:00 EST
IBM daily bearish hammer end of wave 5 expect ABC correction at least.


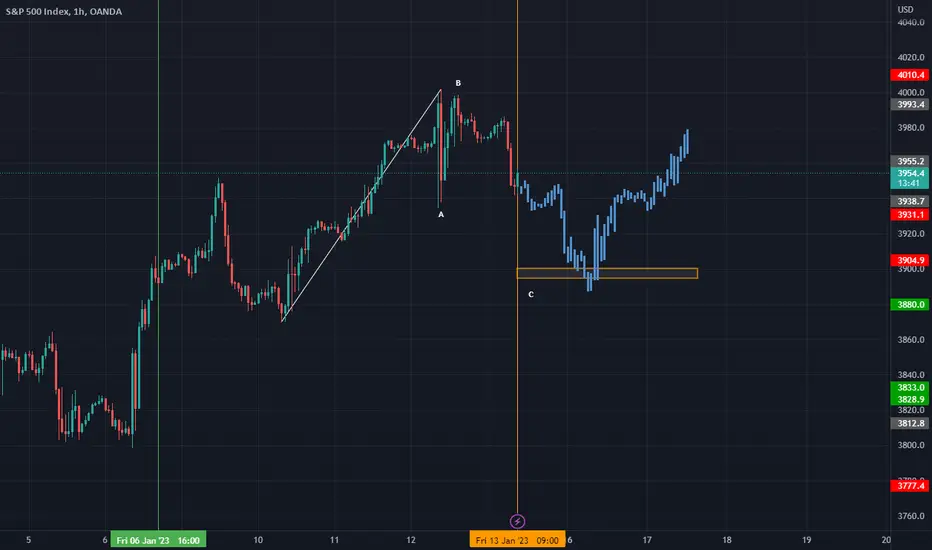
S&P 500 BullishS&P is preparing for a corrective ABC move down before grabbing liquidity and continuation a bullish advance from the $3900 level.
Elliot wavesIn this example.
We could to see the waves 12345 and correction ABC et the big waves in blue. :)
It is necessary to correct all this increase of 221k%

ZEC Trade ThesisZECUSDT
(RSI) under 30 / Elliot wave with ABC correction. Bottomed out @ our support lines.
Entry: $228
EXIT: $269
SL: $212

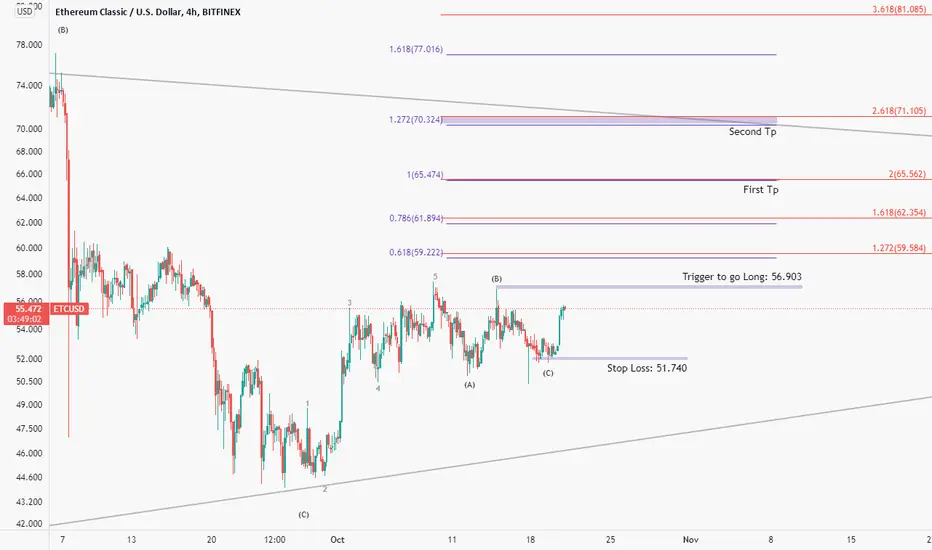
ETCUSD. Possible Long positionhi dear traders.
we have a possible long trade for ETCUSD if B of ABC correction taken out by the price.
Trigger to go Long: few ticks higher than 56.903
Stop Loss: few ticks lower than 51.740
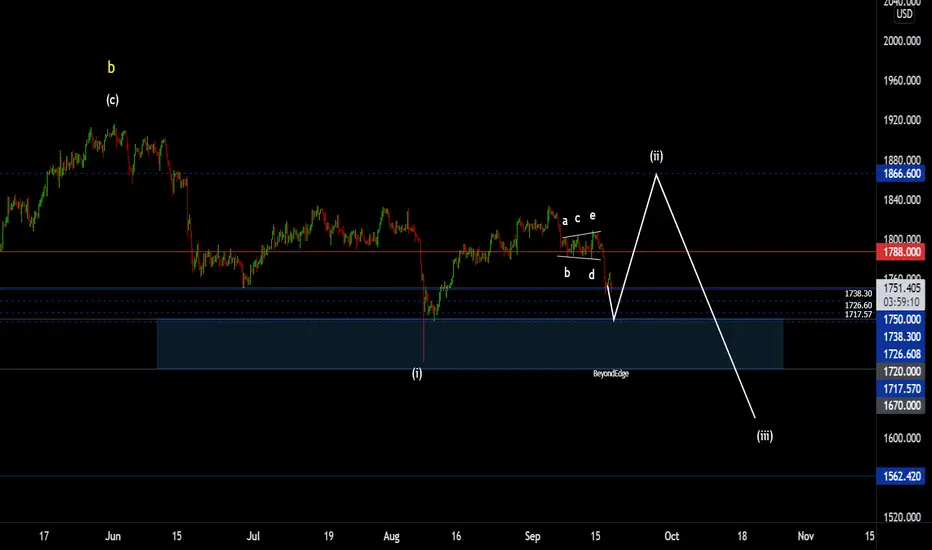
XAUUSD - Ongoing CorrectionGold managed 1808 before breaking out of a reverse symmetrical triangle and dropping to the 1750 level of interest. Keeping an eye on the weekly close here as this could be the pivot for wave (ii).
We could also potentially see price drop further between the 1738 - 1717 levels highlighted before moving back up to complete the wave (ii) of C. Wave (iii) which should eventually bring gold back below the 1680 level. More on that when we get there.
Follow for further updates. Your 'likes' are much appreciated and your comments are most welcomed.
Thank you for taking the time. Trade Safe!
Disclaimer
This is not trading advice. All content/ information shared in this idea is purely educational in nature and is expected to be used for informational purposes only and should not in any way come across as a recommendation to buy or sell in these assets.
You should do your own research and analysis before making any investment decisions. Do not trade or speculate based on the information provided in this idea.
Trust your own analysis.
Beyond Edge
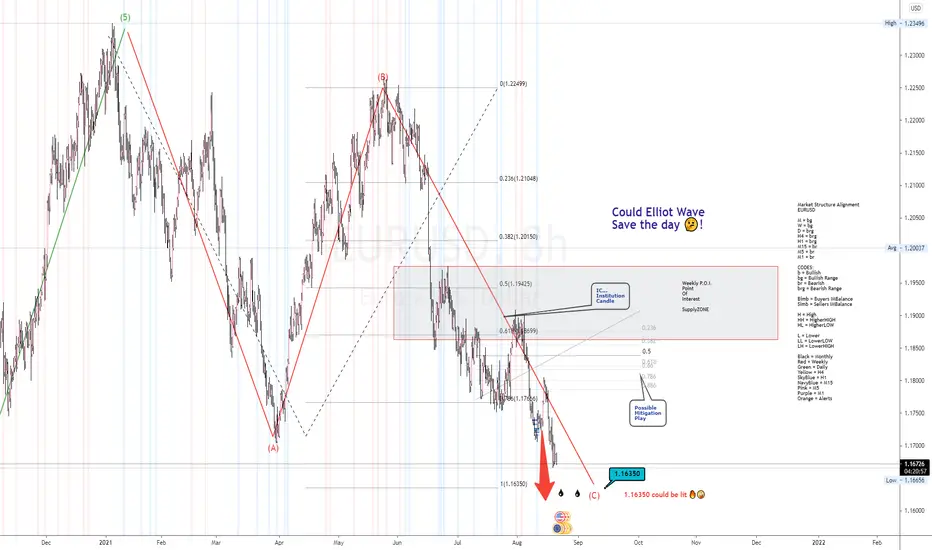
Market Structure Alignment EURUSD --- ABC Correction magnifiedMarket Structure Alignment
EURUSD
M = bg
W = bg
D = brg
H4 = brg
H1 = brg
M15 = br
M5 = br
M1 = br
CODES:
b = Bullish
bg = Bullish Range
br = Bearish
brg = Bearish Range
Bimb = Buyers IMBalance
Simb = Sellers IMBalance
H = High
HH = HigherHIGH
HL = HigherLOW
L = Lower
LL = LowerLOW
LH = LowerHIGH
Black = Monthly
Red = Weekly
Green = Daily
Yellow = H4
SkyBlue = H1
NavyBlue = M15
Pink = M5
Purple = M1
Orange = Alerts
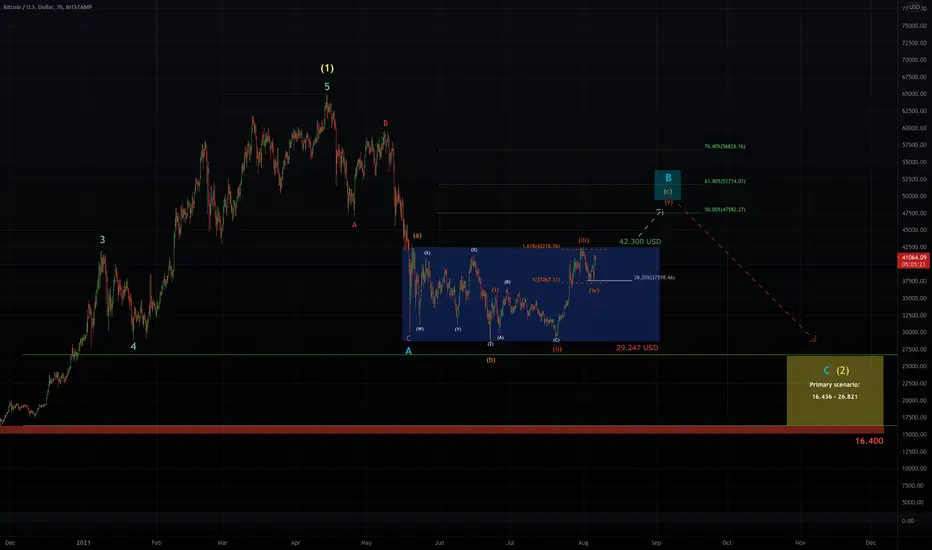
BITCOIN - CURRENT SITUATIONIn the last days of trading we were able to tap into the important support at the 38.2% retracement at $ 37,482 with a precision landing. From there the market showed a solid push to the north side. The bulls now have to show whether this is enough to end the current wave (iv). Theoretically, the ideal goal of the correction was achieved and the bulls could take off now. We should definitely hold $ 35,922 on this move, otherwise the upside scenario could be invalidated. Overall, we could see prices in the $ 51,000 area if we break $ 42,300.
After the B wave, I expect new lows in Bitcoin. My overall primary expectation / scenario is still intact!

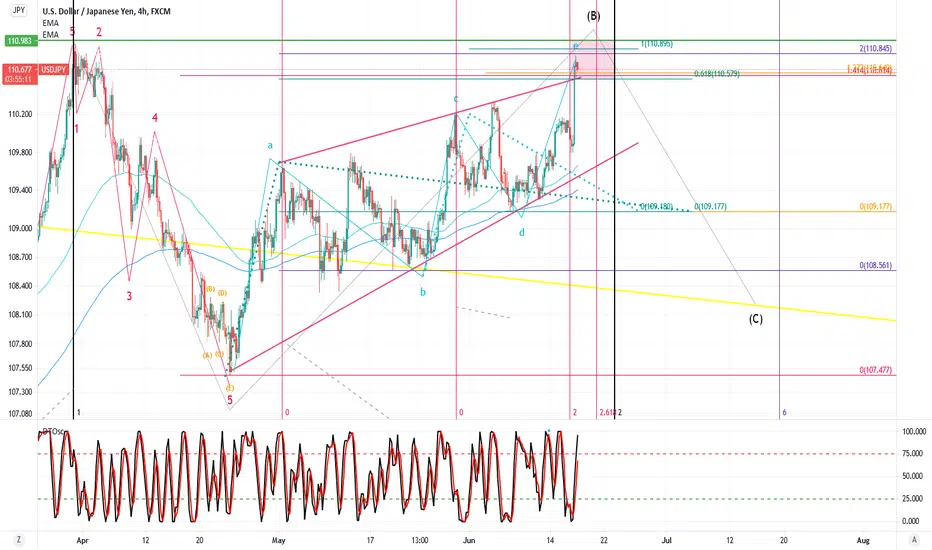
USDJPY ShortHello ladies and lads, hope u all are doing great.
Based on Elliotwave theory, we probably are right at the end of B of ABC correction pattern. But yet still we do not have a sign of a reversal at the time, but i can see there is a high chance that we see reversal signs that confirm this story for our USDJPY.
I have left the tools that i have used to find a Time and Price PRZ, the square that is RED, on the chart itself so you can hover over and see what i think is happening here.
for the last thing, it is nice to mention that DT oscillator in Daily time frame is in Over Bought situation.
I would be glad to hear your ideas on this Idea of mine. and feel free to ask your questions.
thanks for your time.
Good luck
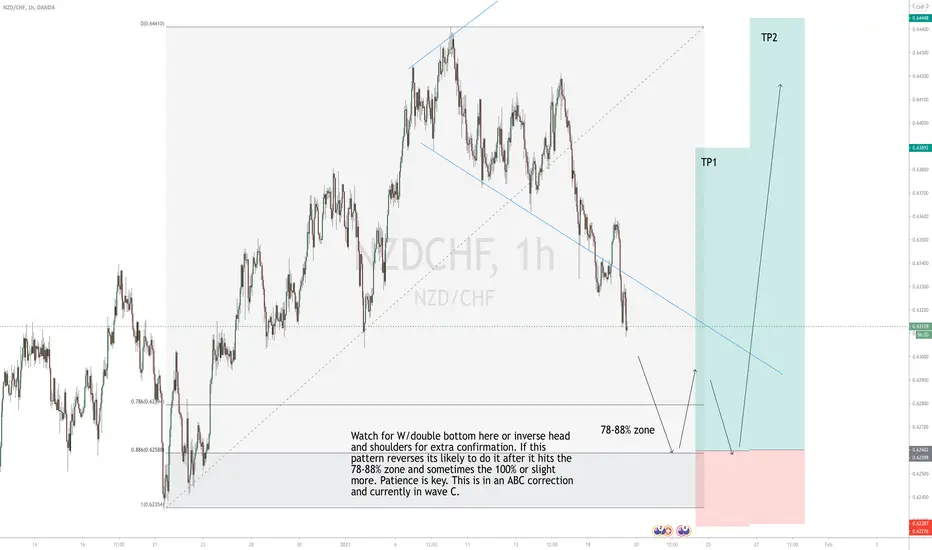
NZD CHF buyPossible buy. Watch for a double bottom or inverse head and shoulders for extra confirmation. Pattern likes to reach the 78-88% fib zone and sometimes the 100% or slight past that. Pattern is in an ABC correction and currently in wave C.
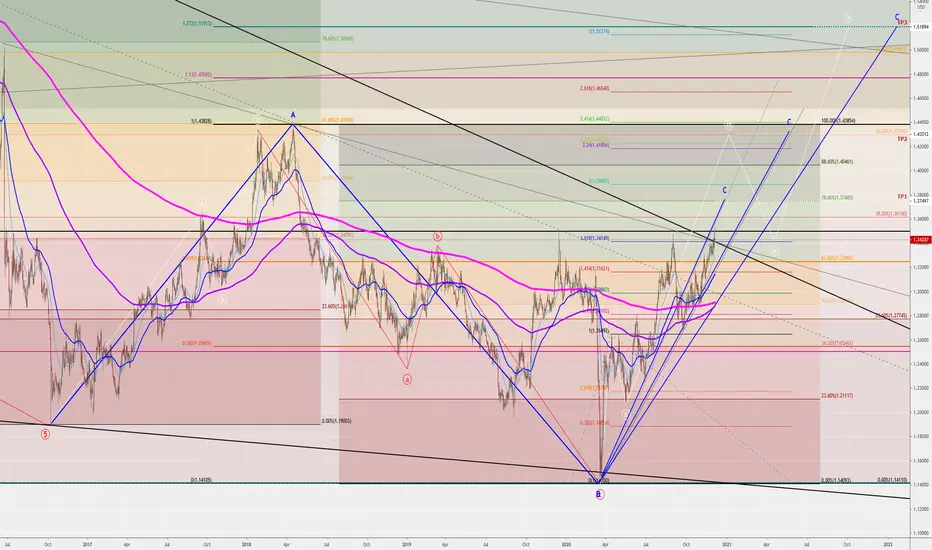
CABLE (GBPUSD): WAVE (C) in play - daily chartI think that we are in a corrective ABC structure inside a wave (C) in the daily chart.
According with this count we may are inside a bigger wave 4 before another big dip for the wave 5, or the previous impulsive movement may already be over also.
So if this count is correct we may have 3 different potential targets for the completition of this (C):
1) 1.374xx in case of a regular flat 3-3-5 ABC
2) 1.43 in case of an expanded flat 3-3-5 ABC
3) 1.518xx in case of a running flat 3-3-5 ABC (that's the mostly rare case of this type of corrections, so this target will be difficult to reach i think, but not impossibile)
Lets see what will happens!
Bitcoin - ABC correction ?I think it would actually be good to complete an ABC correction at this point. It would give all the indicators a chance to reset, fill the CME gap, and give us all a chance to back up the truck. :) You can see where the price broke and retested the yellow trend line and it would make since to continue down to either the 1.0 or 1.27 Fib. Of course Bitcoin does what it wants, when it wants. I already have a good long position but if the opportunity presents itself I will add more under $10K.
Good luck!
BBS out.

GOLD (XAUUSD) - THE BIG ABC DOWNAfter the preview idea of the ABC correction (the Gartely pattern) up to 1965 that earned 1000+ pips in both ways (buying the B and selling the C), this idea would shows my bigger ABC Cycle count with shorts target to 1765. In the follow you can see 2 my short ideas on Gold that are still in play. I will update this idea with screeshots of the inner moves count if it will play out well. Good luck! :D
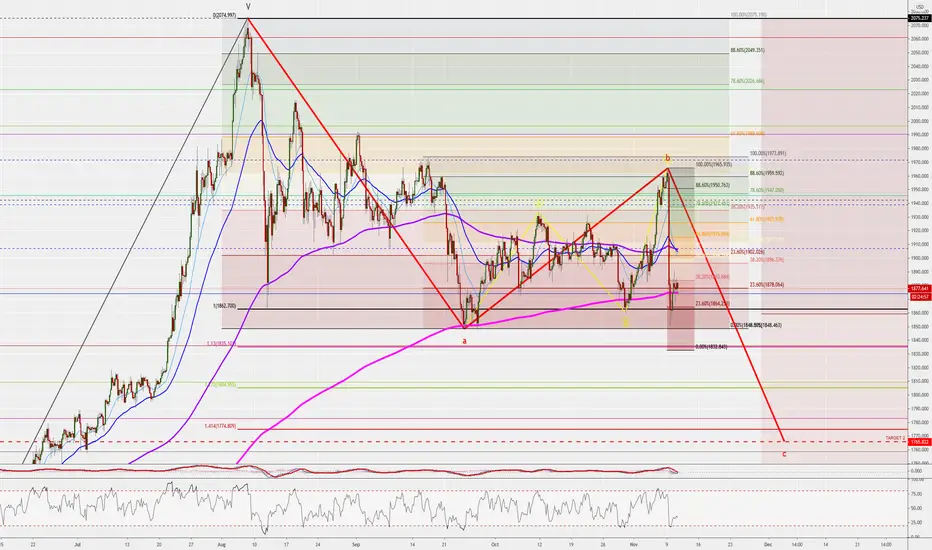
GOLD (XAUUSD) - Possibile GARTELY PATTERN or ABC CORRECTIONSo, we are again in a giant correction and probably we will rest into it untill post elections (middle November?). What i see as possibility now is a slowly drop to 1880 - 1855 area, then from there a rise up to al least 1955. So a strategy atm would be to hold the sells untill 1880 and close them from there to 1860 and then try a buy to 1955.

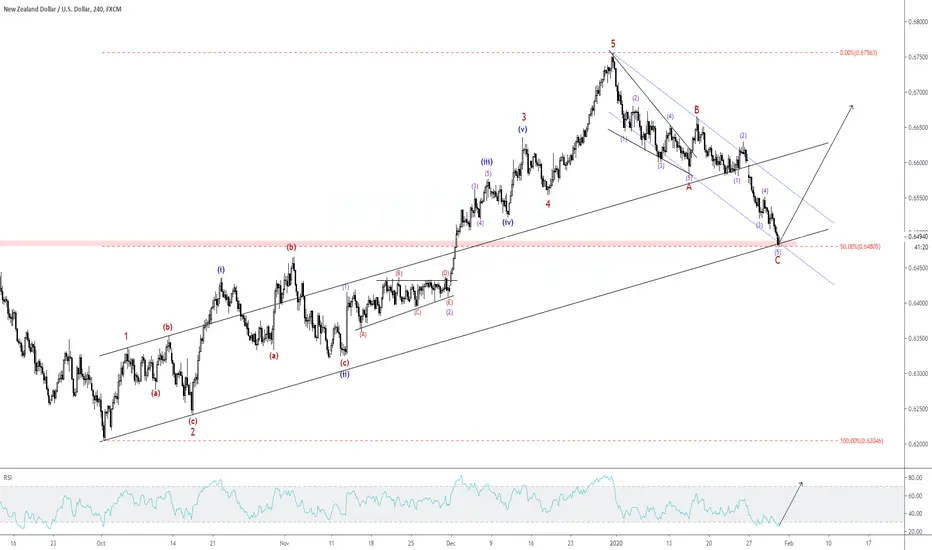
4H NZDUSD Elliott Wave CountLet's count waves.
Do you see the same potential upside for this pair?
I am a beginner in Elliott Wave Analysis and this is my sentiment.
The minor impulsive wave in RED has been completed and corrected via an ABC structure with 5-3-5 sub-waves.
The parallel lines connecting the end of wave B and the end of wave A usually forecast the end of wave C as shown.
Price is currently at a key level marked in the red rectangle which has shown to be resistance and in the past was support level.
Finally, the RSI indicator is currently at 31.20 as I type this and signifies that the price is oversold.
Comments, critiques, and anything else is accepted.
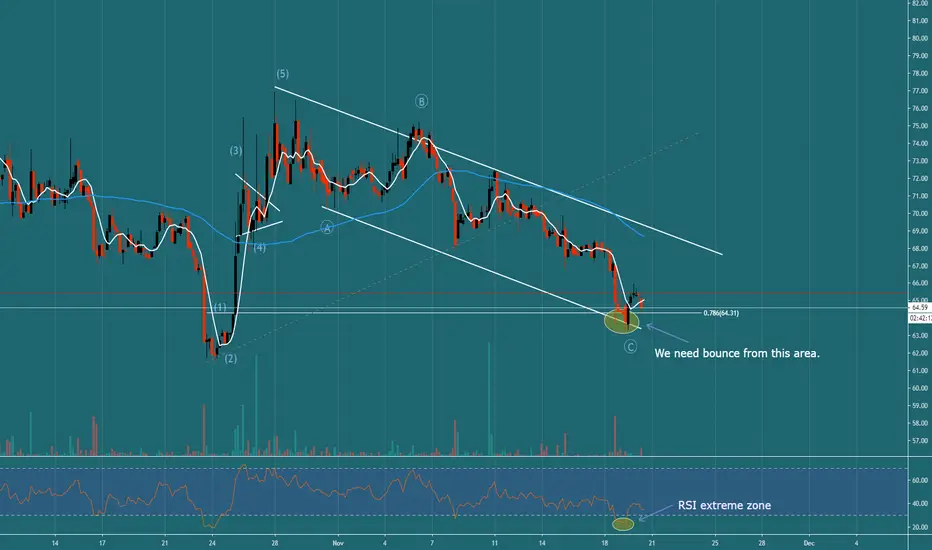
20.11.2019 - Dash (DASH / USD)Hi Traders!
Today we are looking at cryptocurrency Dash. We chose it deliberately because we see an interesting opportunity in it.
We can read a clear bounce (impulse) on the chart, that came last month. Since then, Dash has been moving in the channel. Dynamics, growth and angle which we grew under are much steeper than the decline. In addition, this decline is in the channel. We would be able to annotate the whole decline as ABC correction that could be finishing right now, why?
1. We are currently at 0.786 Fibonacci level of all the growth
2. The bottom edge of the triangle
3. There was already a smaller bounce-off
4. RSI is in the extreme zone
This is a watch zone where we keep an eye on how charts behave. If we break downwards, it's very bad. We are currently on a potential bottom, which may represent a good opportunity to buy.
May the crypto be with you!
AUDUSD Getting Ready for Next Wave HigherAUDUSD is currently finishing a corrective wave and getting ready for the next wave up. The sell zone on the chart would be a good place for a short term sell for 30-50 pips. Take profit (TP) 1 is also our buy minimum which is confluent with the fib cluster of 38.2% & -27%. TP 2 is our buy maximum which is confluent with the -61.8% & 50%. TP for the long is the -27% extension at 0.69250 100-120 pips away from our long entry points. This is for educational purposes only. This is in no way intended to be financial advice. I am not a financial advisor.

Still Bullish on SilverMy next target for Silver is $20.
Disclaimer:
Always do your own research .
We are not registered or licensed to provide investing advice or anything of an advisory or consultancy nature.
