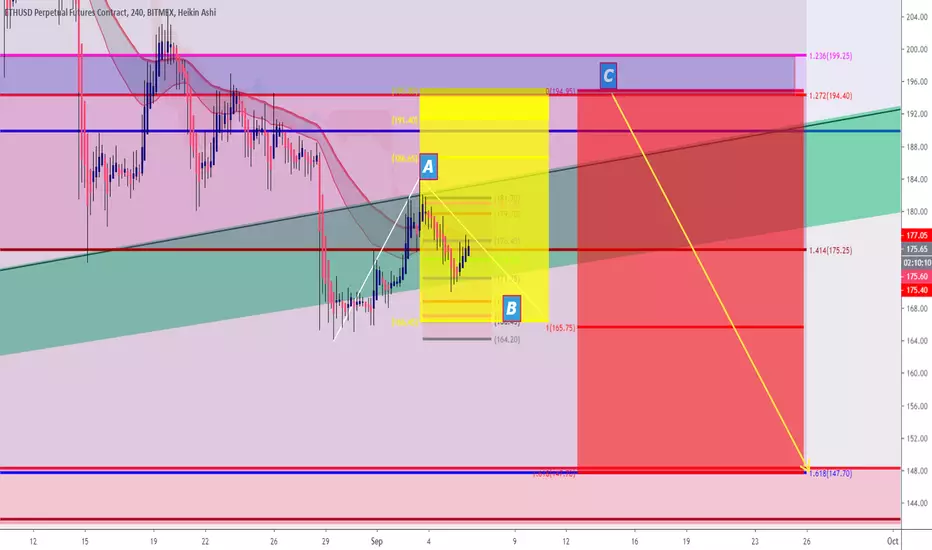
ETHUSD Perpetual BITMEX Futures ;Waiting to Short Potential ABCETHUSD BITMEX Swing trading : Waiting to Short potential ABC Correction.
I would like to see $104,4 Retest.
The information provided here is not financial advice.
Abc-correction
Bayer one more push to the downside...(watchlist)I am expecting Bayer to make one more Push to the downside and then finishing a longterm ABC-Correction. If we are getting this last push into the orange area I will look for buying opportunities in this stock (price action). It could be a potential level to hold the stock for longer term as a ABC Correction should by then have completed.

Gold completes ABC rally, correction time !!A B C rally in gold looks just about done, it will correct/consolidate for the next few weeks.

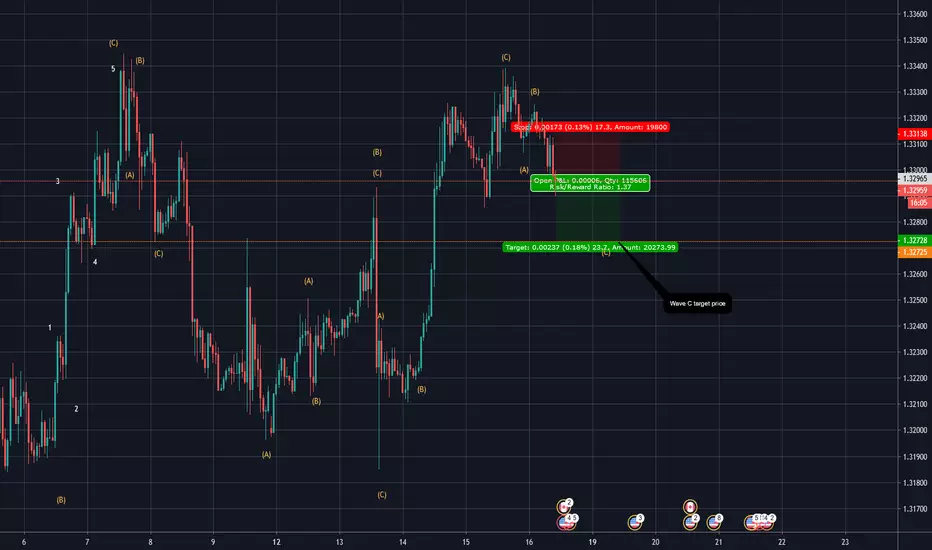
USDCAD Short Visiually we can see the start of a C taking place. However with a lot of buying pressure it may take some time to hit the target price.
EOS - The biggest loser of the last daysEOS - The biggest loser of the last days
Hello traders!
We have been experiencing huge downturns in the last 2 weeks. Today we look at the coin, which probably got the most out of the TOP 20.
We will speak about the EOS coin. At the beginning of June, this coin traded at $ 8.67 and is currently at $ 3.70 . This is more than a 60% decrease per month and half. Especially during last days EOS is really falling. Its decline is spread over 3 waves in the form of ABC correction. However, the last wave, the C wave, is unusually long, so it is possible that the correction will continue . From the whole fall we got almost to 0.786 retracement .
What to notice on the chart right now?
Never catch a falling knife . What does it mean? If the market is still falling, never go into such a brutal decline. If the price for a coin seems attractive to you, never jump into such dumps and wait for the reflection .
What to watch on this coin?
1. Generating a higher maximum and a higher minimum of at least 1H, or 4H
2. The Friedrichs indicator will show the BUY signal at 12H and 1D
3. 3. Divergences of RSI at 1H and 4H
Some of these conditions have been met yesterday, but we must also consider the market as a whole. If we analyze the coin against the dollar, it is strongly bound to bitcoin. EOS looked very good yesterday and still fell by another 17% . Bitcoin may not have completed its correction yet, and therefore EOS may continue to decline . In this case, further downturns would have very bad consequences. In addition to the striking loss of value, the downward angle, which is very steep, is also terrible.
There are several supports marked on the chart . At the moment, it is very difficult to say on which support the gamechanger will come and the EOS will turn. It will not only depend on it but also on bitcoin.

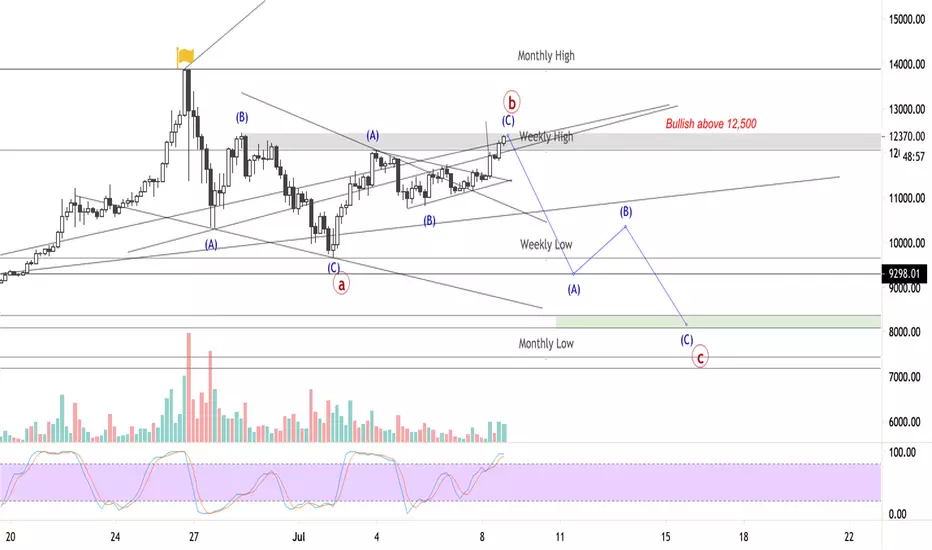
Bitcoin's Final Correction LegBitcoin is no doubt in a bull run, yet that does not mean corrections are out of the picture. These past 2 weeks bitcoin has found itself correction after reaching nearly 14,000. I do however see us finishing our correction with a rejection under the 12,500 mark. Eyes will than be on sub 8500. However, if we do however have a clean close over 12,500 I will look to long the retest of monthly highs.
BITCOIN Might Be Ready For TAKE OFF! Watch Now!Dear Friends!
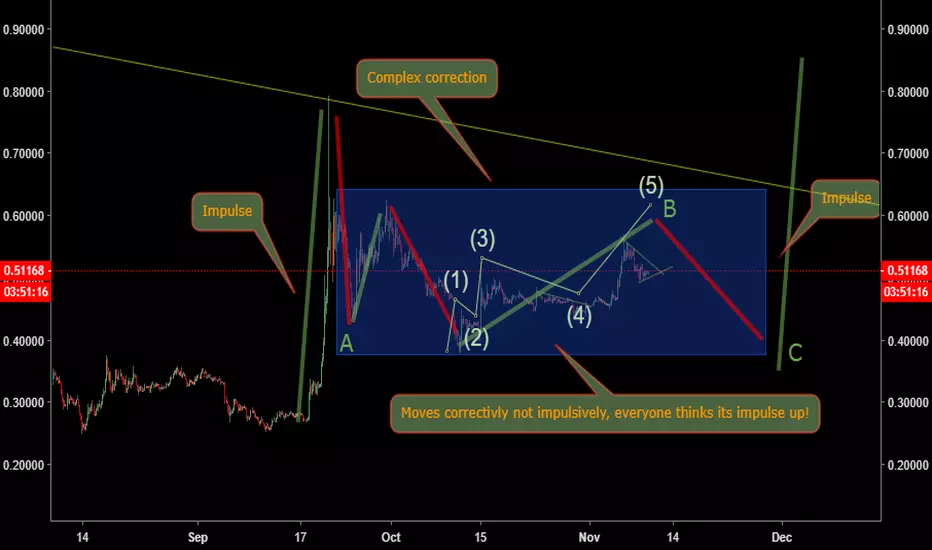
Let's just right into it. I have tried to identify the complex 4th wave correction pattern. It looks like we have a WXY (Double Three), which consist of first a Flat Structure with B as a Triangle Correction (ABCDE) and then ABC followed by a another Triangle Correction ABCDE.
If this is the case we should very soon continue to go up and start our 5th Wave. It's always hard to determine these waves, but one thing is for sure and that is, that the bulls are in control.
Here I have used Classical Charting, which show us the same picture. The Right Shoulder on the Head And Shoulder formation is big, why we usually will not see a huge drop or retracement.
Also this simple chart tells us that the Bulls are in control.
- We have escaped the down trendline
- Bullish Momentum - look at the MACD Histogram
- RSI looks good (not overbought)
- Bullish Volume is again above MA20
- Increasing Global Market Cap and Volume, which tells us that the Market Sentiment is bullish
I hope you liked it! Please leave a LIKE, my friends.
D4 <3

Ziliqa / Bitcoin (ZIL/BTC): ABC Correction On The Way?Find Winning Trades In Seconds >> efcindicator.com (Special Discount)
Ziliqa / Bitcoin (ZIL/BTC): All The Supports, Pivots & Resistences – Short-Term

ADVANCED MICRO DEVICES, INC (AMD): Are More Dips On The Way?Find Winning Trades In Seconds >> efcindicator.com (Special Discount)
It seems that the wave C is missing to finalize this correction. We still have room to go down potentially to the 0.382 Fibonacci level, around 14.

PACIFIC GAS & ELECTRIC CO. (PCG): Buying After A Bloodbath?Find Winning Trades In Seconds >> efcindicator.com (Special Discount)
After a bloodbath, we are in the same levels of 2001-2003 (+15 years ago!!!). The major ABC correction it's likely reaching the end of wave C.

ROYAL DUTCH SHELL PLC (RDS.A): Impulse Waves On The Way?Find Winning Trades In Seconds >> efcindicator.com (Special Discount)
After an ABC correction, the S1 support was able to handle the fall. It seems that we are already starting a reversal.

ETH Correction Wave C and Fib LevelsHere we have a possible Elliott Wave count on the 4h chart where ETH is currently in the C wave of an ongoing ABC correction. ETH going above the swing high from wave 5 (830 level) or the even 725 level might confirm the end of the correction and the start of a new impulse wave.
Fib extension levels of wave A are shown by the dark orange levels. Fib retracement levels of the green impulse wave are shown on the right.
Both the fib arcs and fib spiral are taken from the low to the high of the impulse wave. The scale has been locked at a ratio of 2.
Please note that the positions of the uncompleted waves are arbitrary and should not be taken as price targets.

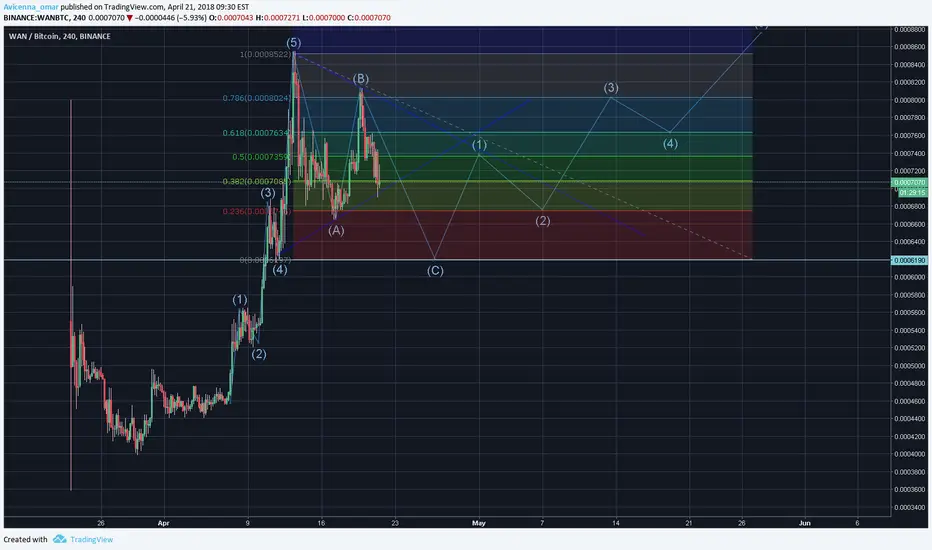
WAN/BTC: ABC correctionAfter the big gains WAN had, it's time for a small correction. I will set a buying ladder 6200-5800 satoshi.
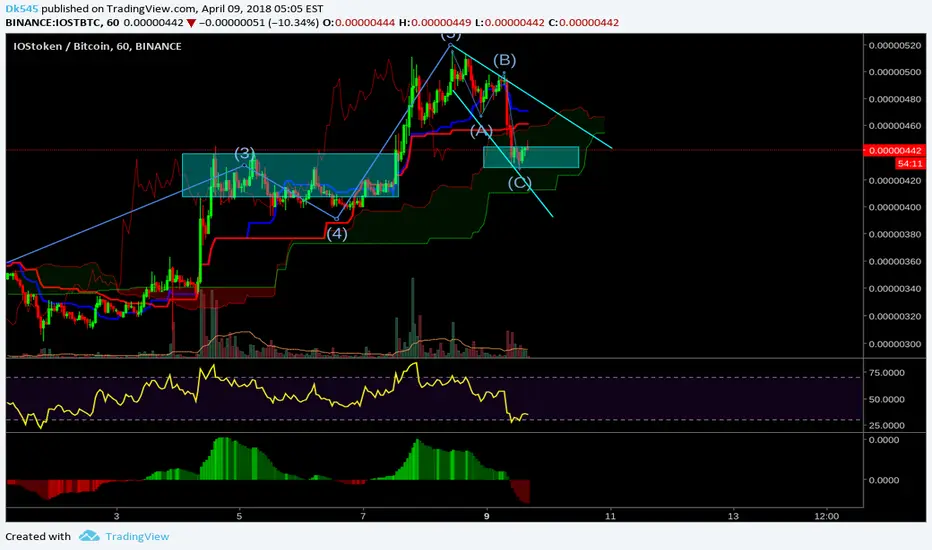
IOST/BTC 09.04.2018After ABC correction, the prices bounces from the target zone. I'll wait for break out and trend confirmation. Ichi indicator doesn't look bad (price is below the conversion and base lines, but future Kumo is still green, TK cross is bullish, candles are closing inside the cloud, so edge-to-edge strategy is possible). If market sentiment is positive, we can see more upside. This coin moves very organically, no struggle in charting
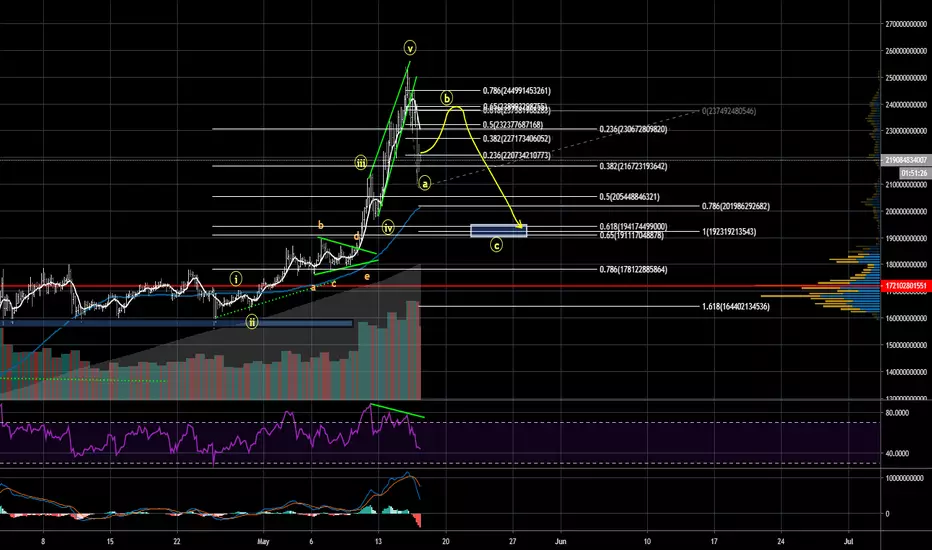
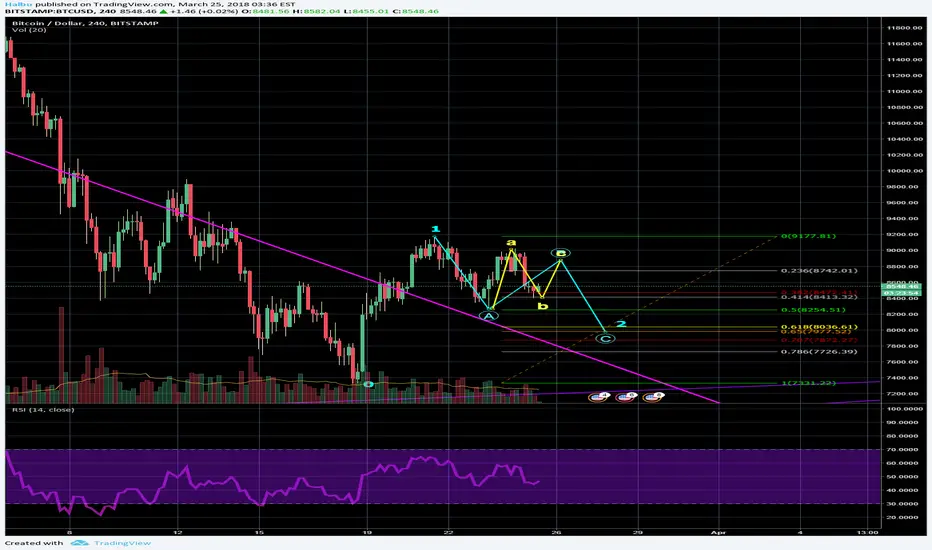
ABC correction of the impulsive wave We retraced only to 0.5 from the recent high.
Now if we dig in into this second wave we made a deep retracement of around 0.786 so this makes an ''a''. Current point might look like a pivot point for ''b'' so we will have ''c'' which doesn't break above ''a''. If we make 1;1 extention A to C we reach exact 0.618-0.65 golden pocket of the whole up movement since 7.2k
This is a long stretch, let's see how things turn out :)
The short term playSeeing this whole recent move of BTC as a failed 5th wave up and currently in an ABC correction down, the failed 5th wave makes it an X wave in a WXYXZ correction of the primary count, therefore we are now in the Z leg down where we hopefully finish the correction and finally bounce to the upside. The question remains where this bounce will be, for now I have hopes that it will be in the 8100-7500 area, but it could go to 6666 as well...the uptrend would still be intact!

S&P 500. Possible map for current correctionIt looks like first 5 waves down of wave A are over in the upcoming zigzag structure.
Next we could see 3 waves up in the countertrend correction, wave B.
It could reach between 50% and 78.6% of wave A.
Then there is a second leg of 5 waves down of wave C.
Let us see how it goes.

Upwards ABC correction expected. Drop to 9.1k before bullrun.Breakout out of the channel needed to confirm B and C. otherwise immidiate drop to 9.1k (previous resistance) before making full bullrun.

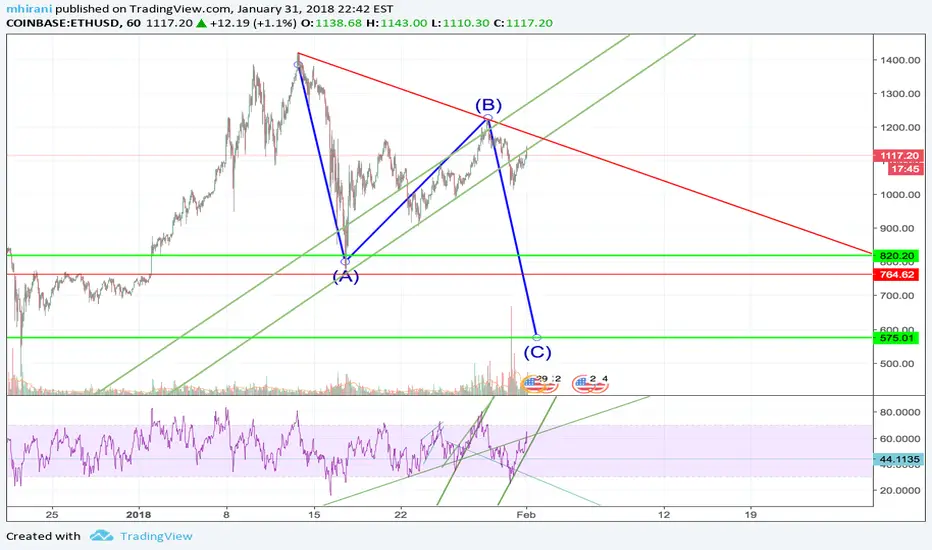
ETH Simple ABC Correction in Play. Targets in $500-$800 RANGE!In this chart I have depicted a simple ABC correction that is playing out on ETH. Wave C is currently playing out and will be composed of 5 subwaves, similar to Wave A. We are currently just beginning Wave 3 of 5 for C if my count is correct. Initial targets are posted as horizontal lines and are based on fib retracement levels.