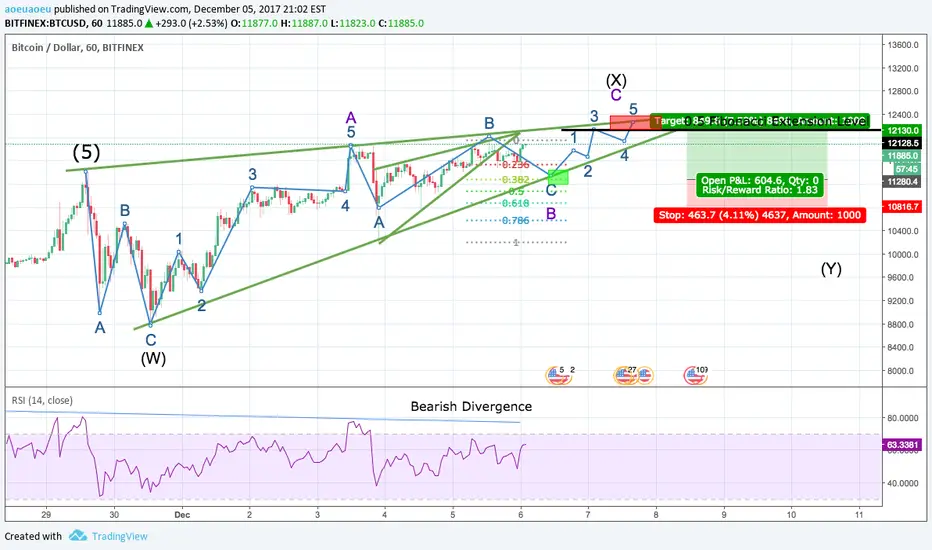
BTC Long From 11280 to 12130After the massive uptick to 11400 on Nov 29, we just finished wave 5 and are currently experiencing corrections. However, that does not mean we can't play the bounces within the correction! Right now, Bitcoin is forming a rising wedge, both a small one and a big one. The small wedge will likely break and go down to around 11280, which is the price at the top of the wedge minus the size of the opening of the wedge. Coincidentally, 11280 is also a support level of the bigger wedge and the 0.382 Fibonacci Retracement of wave B (of the second ABC).
Bitcoin should bounce of that level and complete wave W, which is should be a 5-3-5 zigzag. That would make the overall correction a 3-3-5 flat. We a get resistance level of 12130 by taking a 0.5 extension of the 12345 impulse of the ABC correction up (purple one). Not far off, we get a higher resistance level of 12300 from the top line of the bigger rising wedge.
Some may argue that Bitcoin already went through correction and is starting another impulse wave. Although Bitcoin did already go through an ABC correction, but I doubt that's the end of the consolidation. On the RSI we are seeing a bearish divergence, and the big rising wedge means the price will go down. Also, a 24 hour ABC correction seems way too short for such an impulse that took 2 weeks.
Don't be greedy and take your profits at 12130. Don't get FOMO as we can always buy at a better price after the price of Bitcoin dips from breaking out of the rising wedge. We may see a low of $10,000, but it's too early to tell right now.
Abc-correction
EURCAD ABC correction buyThis looks a correct ABC correction. We just broke the low and for a full pattern we should retrace. I would wait for a retracement above the lower trendline, a consolidation and the buy it.
It would happen fast so look it in a smaller TF.
If you buy once we get around 1.47500, put your buy to break even.
It is a 380 pips buy. If you manage to get around 250 out of it you are good.

XAUUSD Sell, Possible ABC CorrectionInability to break above dynamic resistance zone and clear need for a correction possibly in a classic ABC pattern.

Elliott Wave BasicsHey traders. Here I have provided some notes of mine for the very basics of the Elliott Wave 5 wave structure. I am open to constructive criticism. All of this info is derived from the Elliott Wave Principle Book. Thanks Everyone.

EJ H1 - Things are looking up!Going long here. This is looking like a dilapidated ABC Correction on H1. And possibly and unfinished 2 on H4. But on Daily... this is most definitely a 4 going 5. (SHORT) But for now... this is a temporary Long (buy) that should be good for 120pips if I am right... 43or so pips if I am wrong.

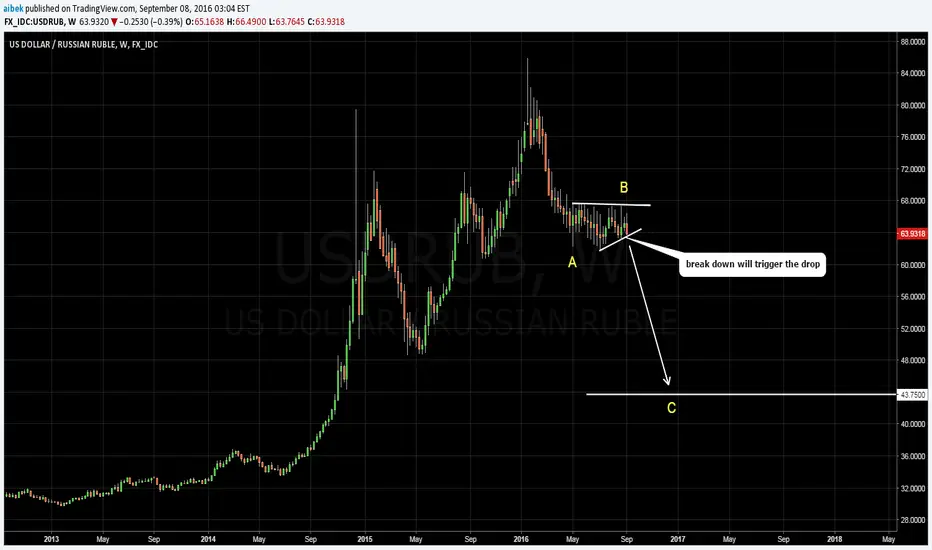
USDRUB. Possible wave count. TARGET 41.75Looks like USDRUB is in a larger corrective move.
Therefore another drop is pending.
C=A = 41.75
(4h) Approaching a "Wave" - Forecasting eventual Shark @ ext.FX_IDC:GBPCHF
With a "BC" wave closing below the 38% after kissing the 50's, we can expect a strong bearish "CD wave".
My first "landing platform" at next fib retracement level, the 50% retracement (blue fib), confluence zone between 127% first wave (AB) extension (or external extension), and 161% second wave (BC) extension (or alternate extension) - This forges a Cluster Zone.
The Bullish Shark @ 224% pattern extension is also a reference, (check the Shark Special Guide link below) and below it, the AB=CD pattern very close to the 618 retracement, 161% wave (A) extension, and 261% extended Shark point D - next cluster (let's call it one extended one).
Note this is the top of daily chart structure...
Safe Trades;

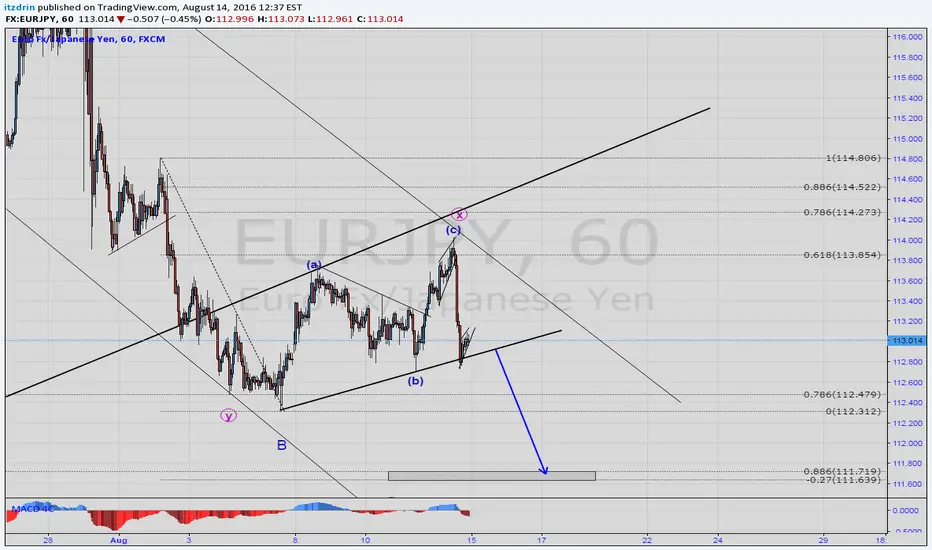
EURJPY SELL SETUPThis setup is looking pretty clear , we have an impulse to the downside, it was correcting until now making an ABC correction now it looks like it wants to break to the downside for the next impulse which will be likely to hit 111.70 area.I'll be looking to sell this after a sell setup appears on lower timeframes. Trade your plan
EURAUD BUY IDEASince it is in the completion of the C wave of a corrective move, EURAUD could turn upside anytime from now.I'll be looking to catch the next impulse up until -0.27 area.This may be a 3 wave correction or it could be a 5 wave structure so If you choose to enter now, It would be good to move stop loss to breakeven when it reaches the trendline and wait if it will break or will come down for another move before going up.

(Weekly) To buy @ Cluster // Finishing ABC(D) correction ?FX:EURNZD
Wait for Divergence:
The Bat:
The Shark:
Ratios:
Safe Trades;

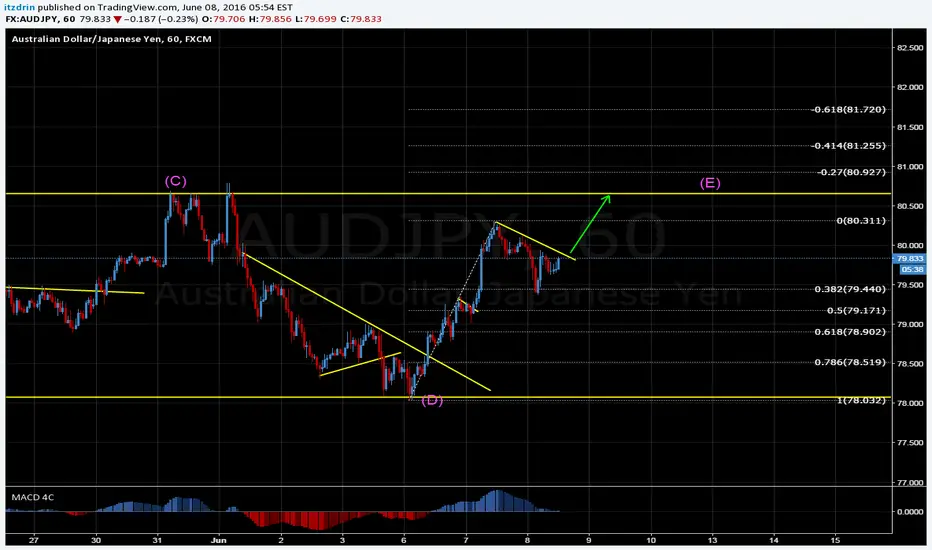
AUDJPY BUY THE BREAKOUTLooks like AUDJPY is about to finish the corrective structure and break the trendline which would take the price to at least 80.60 area.From there the E wave completes and probably we'll see a lot of downside movement.Trade your plan.
Get ready for a sharp bearish impulsePrice is getting closer to a high-probability PRZ (price reversal zone marked in red rectangle.)
Harmonic: AB=CD completion
Elliott waves: ABC correction complete in multiple degrees.
I would wait for the price to reach the red rectangle and show signs of a reversal.

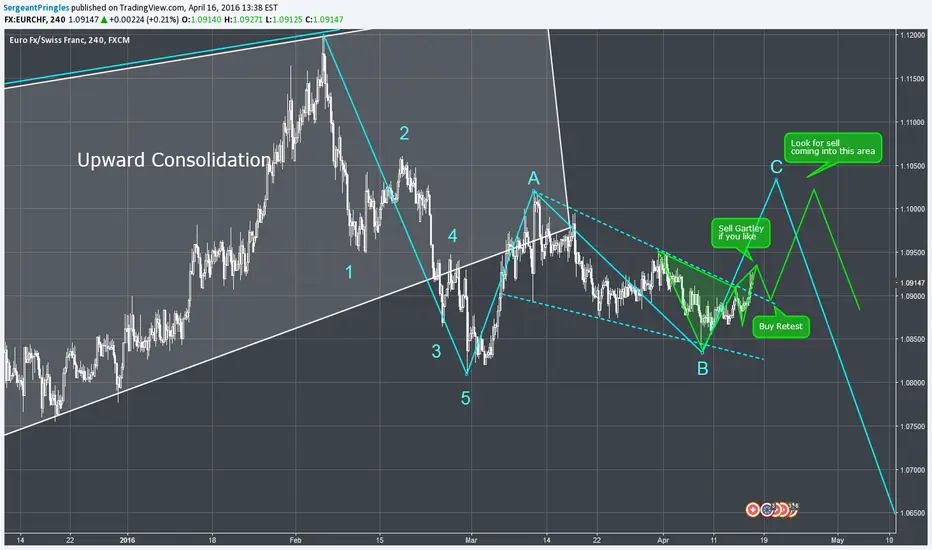
EURCHF - 4H - Gartley and breakoutI posted this idea a couple of weeks ago (link below). now im just updating it coming into an interesting zone this week.
everything else is on the chart and/or in the original idea.
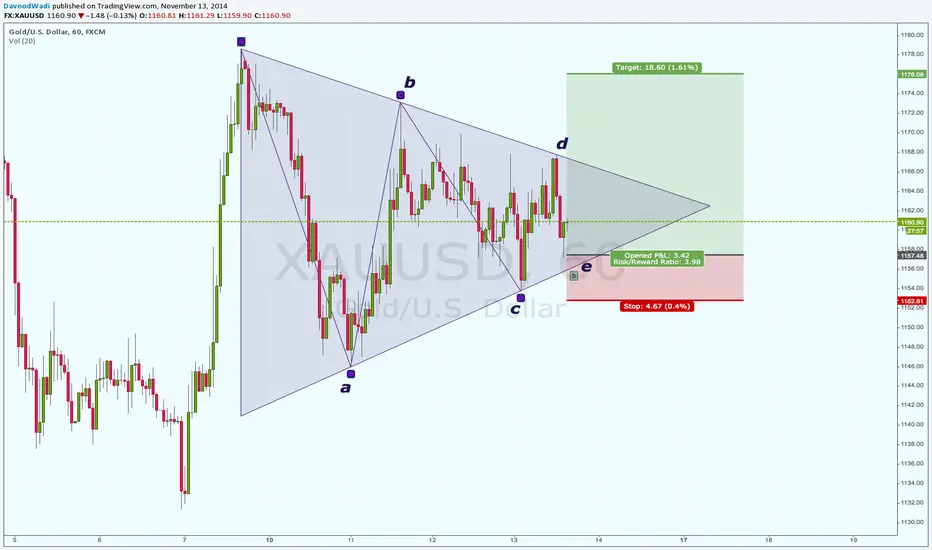
A Symmetrical Triangle in Gold during its b corrective waveHi again,
We're near the end of the week and setups keep forming!
This one is also a bullish symmetrical triangle.
First by looking at the higher time-frames we did expect a rally in gold to correct the Intermediate Bearish wave that completed.
The rally was fast and strong and it is currently resting at a symmetrical triangle for its b wave in order to make another rally to the upside.
My setup is short term but with multiple contracts and partial profit taking you can manage to exploit the whole corrective c move.
My entry would be at the touch of the lower trend line where wave e completes. @ around 1157.00
My stop would be under the c wave as always. @ around 1152.00
The initial profit target is at 1176.00 before the previous high just to get there fast. No other reason ;)
This is the idea for today.
Until next time, take care of your money.
AAPL Elliott Wave analysis updateHello again,
Here I'm taking a look at Apple stocks once again.
Nothing unpredicted,
As you can see from my previous idea I highlighted a zone using fibonacci relations for the price reversal.
Now I has bounced off of that area.
We're currently sitting in the A leg of an ABC correction move. If you're a short term trader you can look for shorting opportunities at this time. But I personally would rather sit aside and watch its completion. Then I'll get a chance to hop on the major bullish trend.
Now I've marked the 38.2 retracement of the whole up move which is a probable spot for the ABC move to terminate and start a new rally. You might seek more confirmation using price action at the time we get there.
Please comment your ideas and questions below this idea.
And don't forget, take these ideas as they are, not as trading signals.
No matter how true they seem to turn out each time.
Have profitable week.
