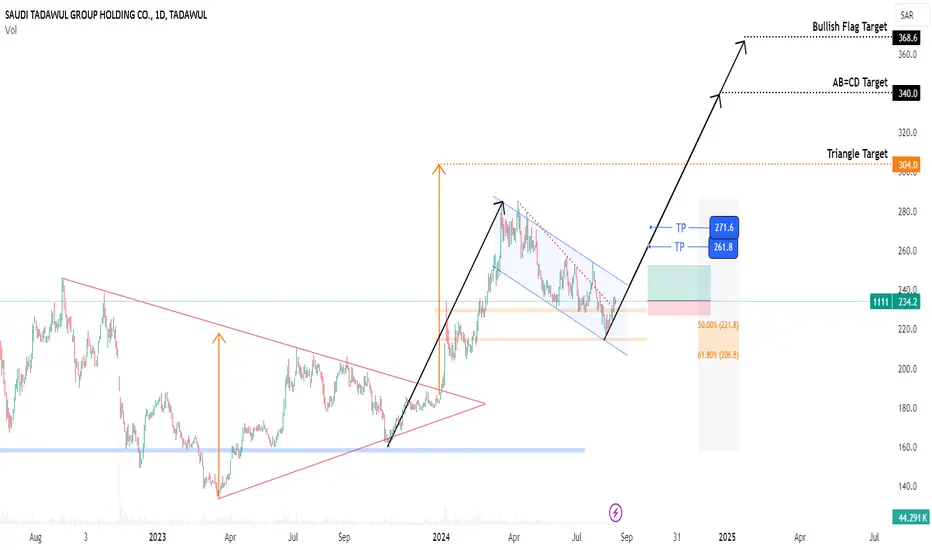
1111: Great Upside Potential After Correction1111 after correction has reached 61.8% fib level (Golden Pocket)
A horizontal support level is also acting as trend reversal
Formation of HH, HL are observed.
Ride the trend with trailing SL.
Manage your risk accordingly.
AB=CD
EUR/USD: AB=CD Harmonic Pattern Signals Potential Bullish TradeAB=CD Harmonic Pattern Pattern Formation:
The EUR/USD pair is currently forming an AB=CD Harmonic Pattern , which is a common and reliable formation in technical analysis. This pattern is typically seen as a strong indicator of potential price movement, making it a crucial point of interest for traders.
Fibonacci Retracement & Projection Analysis:
The BC leg has shown a 58% Fibonacci retracement, aligning with a 2.0 projection of the BC leg. This confluence strengthens the validity of the AB=CD pattern, suggesting a high probability of the price reaching the D point as per the pattern projection.
Entry Strategy:
We recommend taking a Buy entry near the 1.10500 level, at the retest of the Point B breakout. This level offers a strategic entry point, capitalizing on the potential Bullish Trend Continuation toward the projected D point of the harmonic pattern.
Profit-Taking Strategy:
To maximize profit while managing risk, we suggest the following take profit levels:
TP-1: 1.11300 - First resistance zone where partial profits should be taken.
TP-2: 1.12100 - The second resistance zone is critical for further profit-taking.
Stop Loss Placement:
To protect against adverse price movements, a stop loss should be placed near 1.09690. This level is strategically chosen to allow for natural market fluctuations while safeguarding against significant losses.
Conclusion:
The EUR/USD is currently presenting a strong technical setup with the formation of the AB=CD Harmonic Pattern. By entering at 1.10500, traders can position themselves advantageously for a potential move towards the resistance zones near 1.11300 and 1.12100. Proper risk management is advised with a stop loss set at 1.09690.
Disclaimer: This analysis is for informational purposes only and does not constitute trading advice. Forex trading involves significant risk and may not be suitable for all investors. Always consult with a licensed financial advisor before making any trading decisions.

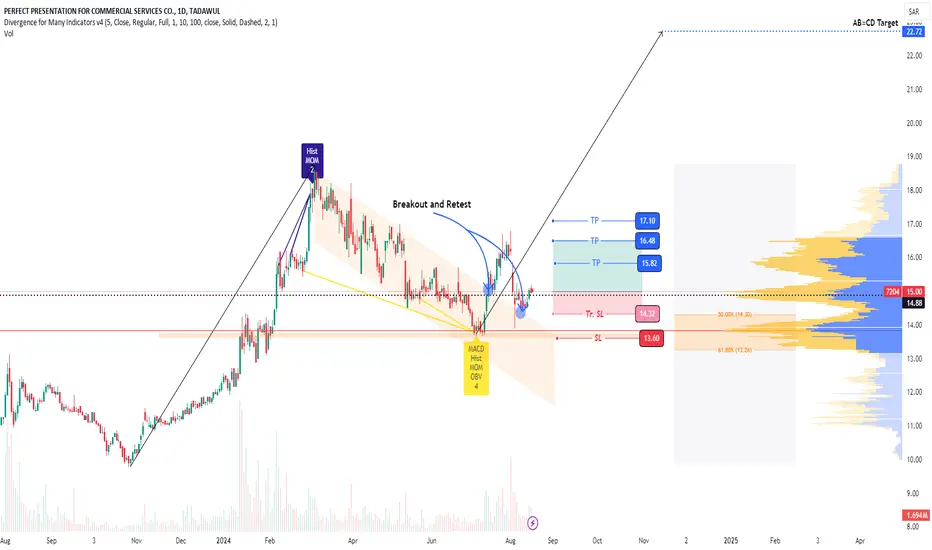
7204: Breakout and Retest7204 was in correction for a while within descending parallel channel.
Breakout followed by retest is observed on parallel channel.
Price has started showing HH, HL formations after
taking support from horizontal line
which is also golden pocket fib level.
A Bullish divergence is also formed.
Take entry now (with aggressive or conservative SL) and ride the trend.
Do proper risk management based on your portfolio and appetite.
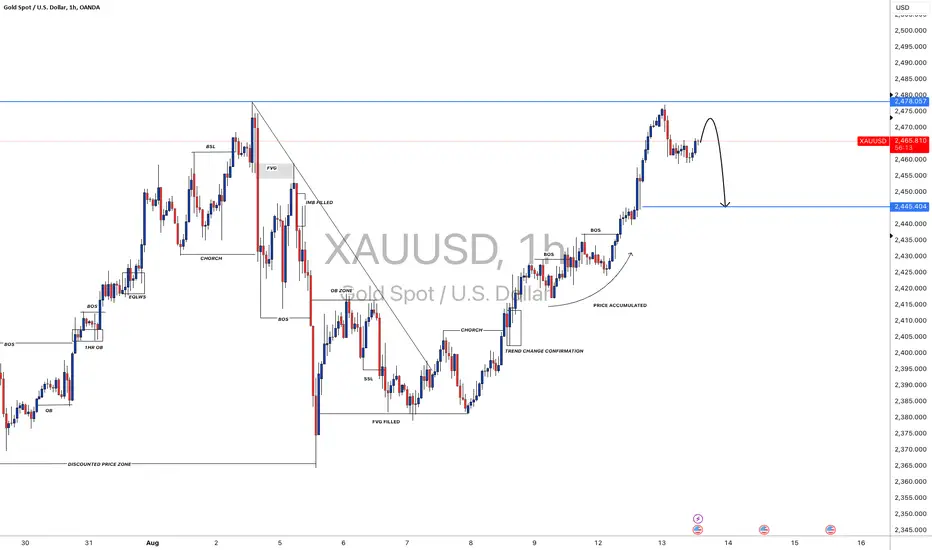
XAUUSD: A small correction before going ATH! OANDA:XAUUSD
We may see price correction on XAUUSD before it continue moving up, price has been extremely bullish since the beginning of the week. However, we may now see price dropping towards 2440 which area remain a strong hold for swing buyers. Good Luck.
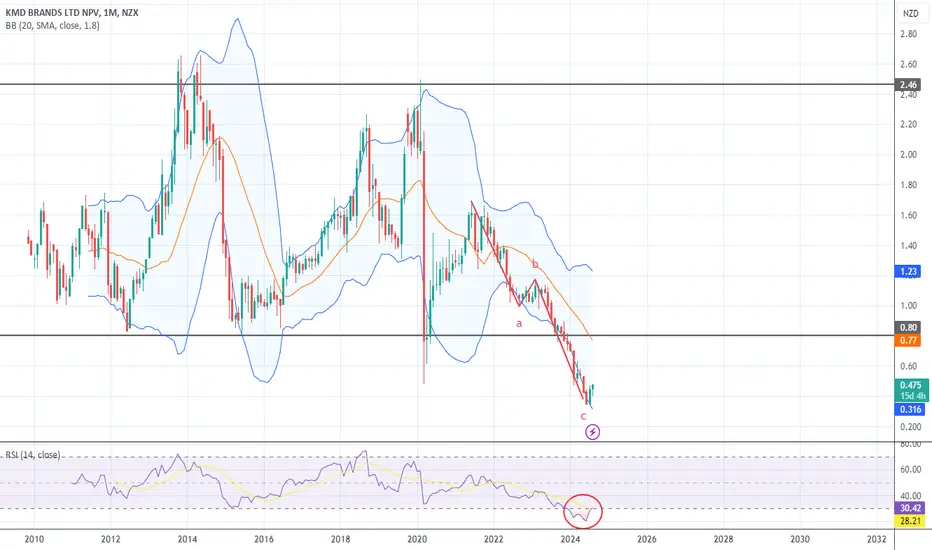
KMD NZ Buying long term positionMonthly chart
Buying long term position trade for a set and forget position
Currently at
- 16% forward dividend
- Large monthly AB=CD pattern
- Monthly oversold RSI
These 3 reasons alone are enough for me to get in....
Retail is doing it tough and there are going to have to be some restructuring taking place, but it is a good brand that makes good products and I know it very well and have some of their clothes in my wardrobe
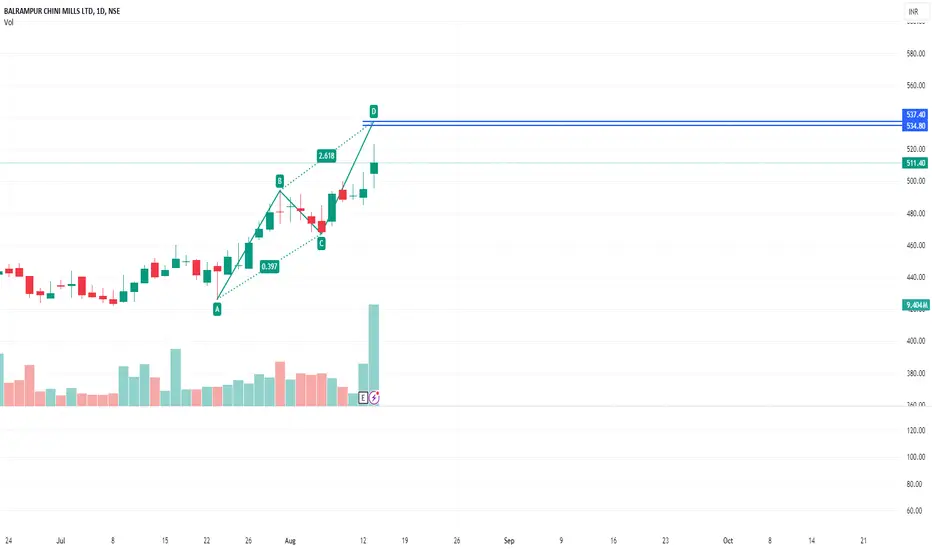
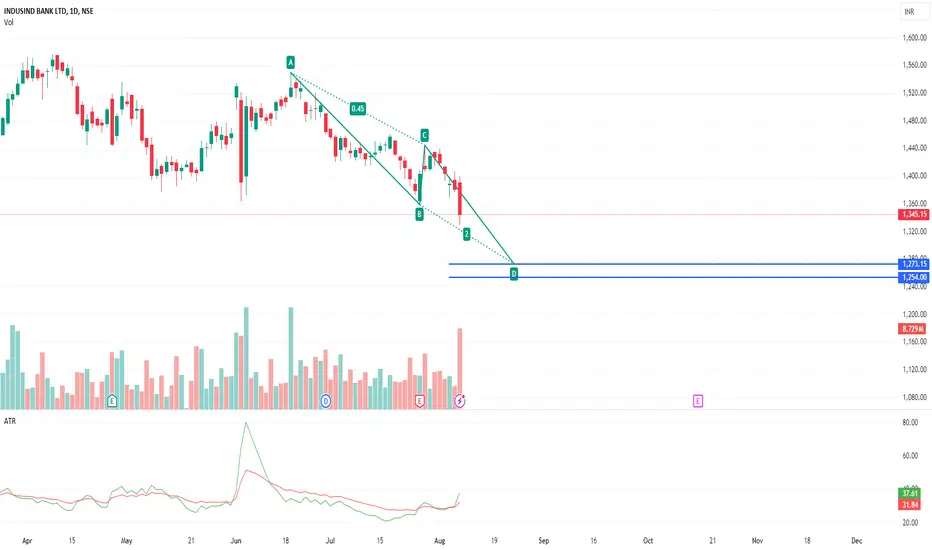
sell at zone - intraday - expecting small fall from the zone .
- good for intraday trade
ENTRY
- entry is strictly inside the zone
- look for confirmation in smaller time frame ( 15 mins preferred )
TARGET
- use fibonacci retracement on C to latest swing high
- mark 0.236 fib value as target
STOPLOSS
- if daily tf candle close is above the zone .
IGNORE
- if u didn't get confirmation inside zone , ignore this pick
- if daily timeframe candle close is above this zone , this pattern become invalid and ignore this pick

sell at zone - intraday- expecting small fall from the zone .
- good for intraday trade
ENTRY
- entry is strictly inside the zone
- look for confirmation in smaller time frame ( 15 mins preferred )
TARGET
- use fibonacci retracement on C to latest swing high
- mark 0.236 fib value as target
STOPLOSS
- if daily tf candle close is above the zone .
IGNORE
- if u didn't get confirmation inside zone , ignore this pick
- if daily timeframe candle close is above this zone , this pattern become invalid and ignore this pick
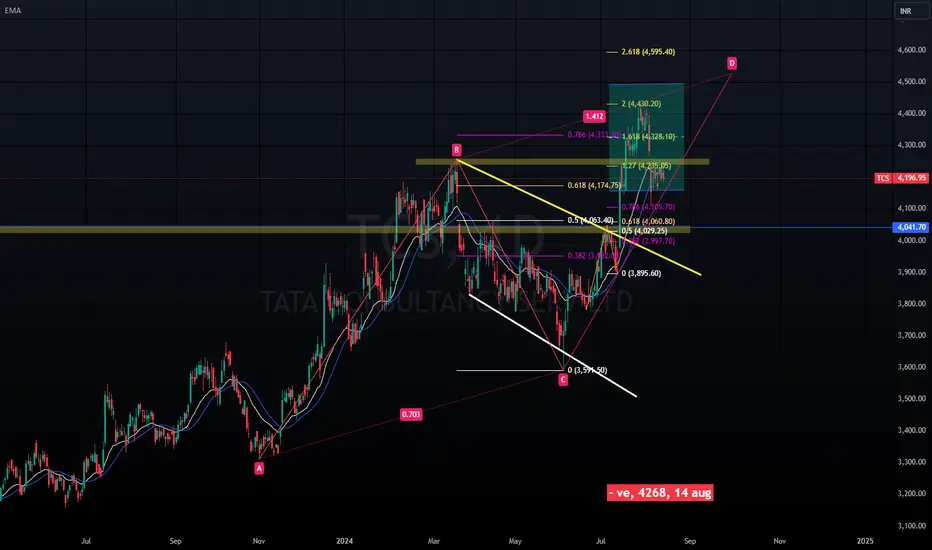
buy at zone - swing / intradayENTRY
- lines marked below is potential reversal zone ( PRZ)
- entry is strictly inside the zone
- look for buying confirmation in smaller time frame ( 15 minutes preferred )
EXIT
1. target
- mark fib retracement from C to latest swing low
- TGT 1 - 0.236 fib level ( intraday tgt)
- TGT 2 - 0.382 fib level
- TGT 3 - 0.5 fib level ( preferred target )
2. SL
- candle close below (PRZ)
- if u didn't get confirmation inside the zone , ignore this pick
- if candle close is below zone , this pattern becomes invalid . IGNORE THIS PICK
- RE-ENTRY can be done , if u again get buying confirmation inside the zone
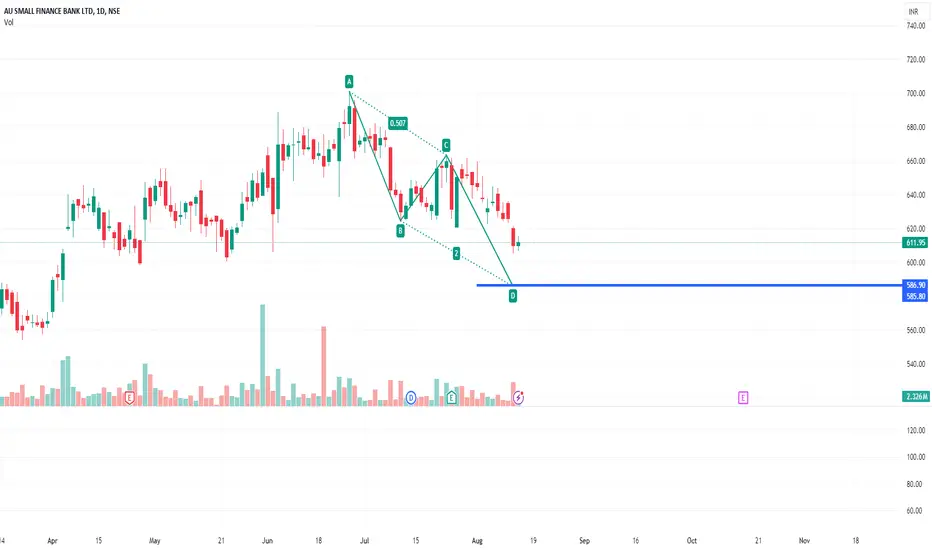

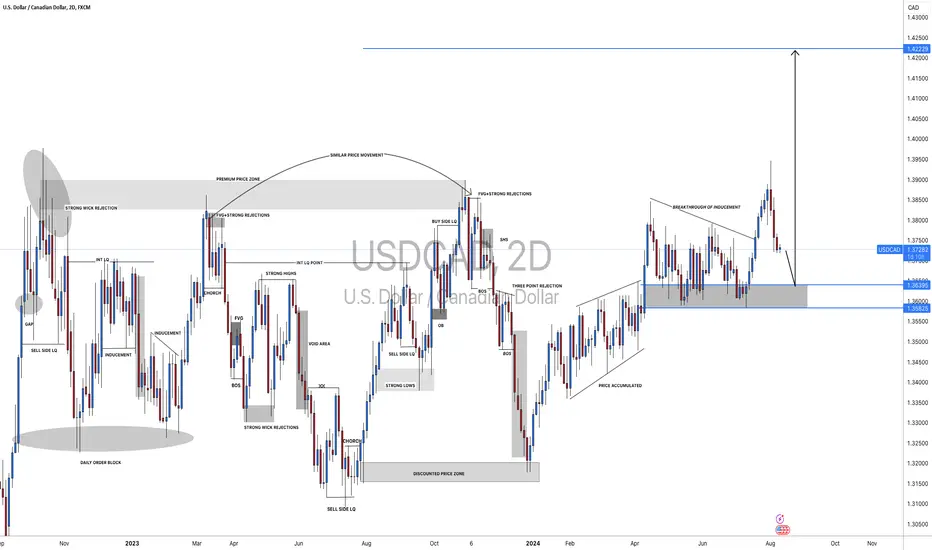
USDCAD: 800+ Pips Move, Do not Miss Out! Dear Traders,
As we stated in our last analysis that price will bounce from our designated buying zone, for us that area remain a key level as price is likely to retrace from the area. Following our last idea, price did rise up higher than that we expected, however, it has almost reached our area of buying.
Good Luck and trade safe.
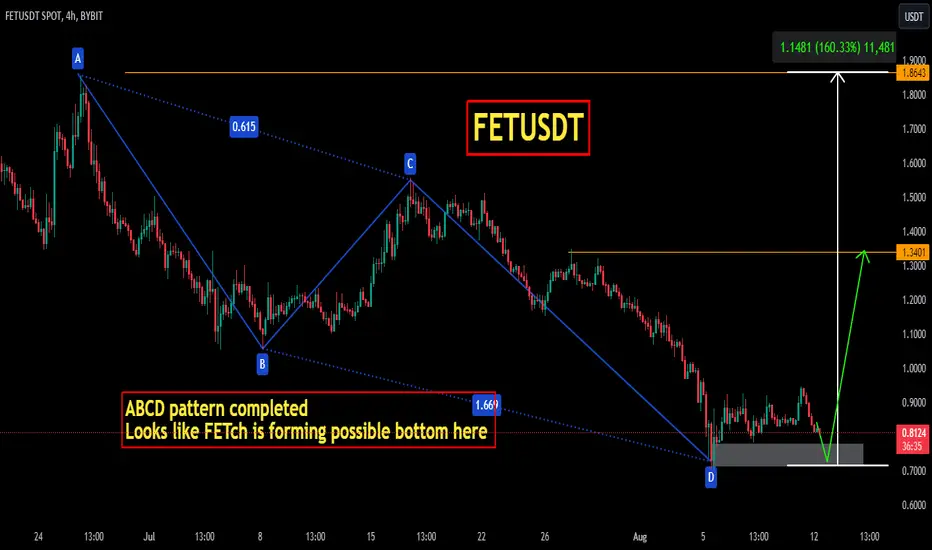
FETUSDTFETUSDT is trading in strong bearish trend and consistently printing LL LHs. and is about complete ABCD pattern at strong daily support level. And it looks like FETUSDT forming a local bottom here .
If the bullish rally starts from here , the next possible target could be 1.3500 followed by 1.800
XAUUSD: 1HR VIEW Targeting $2300! Second Entry UpdateDear Traders,
Price has shown some strong bearish pressure as it failed to go beyond 2408, where it ranged for entire London and New York session. We waited until now to have some strong confirmation of how price may move. We are now confident enough to have a bearish outlook on Gold. If you like the idea then like and comment. Previous idea is running +400 pips. Keep supporting and good luck to everyone. Trade safe.

buy at zone - swing / intradayENTRY
- lines marked below is potential reversal zone ( PRZ)
- entry is strictly inside the zone
- look for buying confirmation in smaller time frame ( 15 minutes preferred )
EXIT
1. target
- mark fib retracement from C to latest swing low
- TGT 1 - 0.236 fib level ( intraday tgt)
- TGT 2 - 0.382 fib level
- TGT 3 - 0.5 fib level ( preferred target )
2. SL
- candle close below (PRZ)
- if u didn't get confirmation inside the zone , ignore this pick
- if candle close is below zone , this pattern becomes invalid . IGNORE THIS PICK
- RE-ENTRY can be done , if u again get buying confirmation inside the zone
Alikze »»GRT | Bearish Flag Pattern🔍 Technical analysis: Bearish Flag Pattern
According to the analysis presented in the previous post, after the completion of corrective wave B, an upward wave in the form of wave 3 or C grew to the size of 1.272 fibo of the previous wave itself.
- Therefore, this rising wave can be labeled as wave one.
💎 According to the structure and behavior of the three-wave correction, an ascending log equal to 61.8 fibo of the previous wave has been returned.
💎 In addition, this return wave was in a channel and formed a descending flag. Therefore, the bearish flag pattern can also correct as much as the bar.
- This descending log can return at least 100% of the previous wave, which will be the range of 0.1446.
- If it continues and breaks it, it can extend to the floor of the channel and shopping area.
💎 Resistance zone: limit 0.39 and fibo 61.8 channel ceiling
💎 Alternate scenario: If the 0.618 Fibo area breaks to the upside, the bearish scenario will be invalidated and should be re-examined and updated.
»»»«««»»»«««»»»«««
Please support this idea with a LIKE and COMMENT if you find it useful and Click "Follow" on our profile if you'd like these trade ideas delivered straight to your email in the future.
Thanks for your continued support.
Best Regards,❤️
Alikze.
»»»«««»»»«««»»»«««

7204: AB=CD, POC, Golden Pocket7204, is in Bullish trend:
AB=CD, POC, Golden Pocket
Enter trade with specified SL
Manage your Risk
Trail SL

BTCUSD - 100k but not an easy path..COINBASE:BTCUSD has had a fairly decent run this year and looks like it will continue. The path seems to be filled with decent Pullbacks to scare a few people but overall looking like 100k will be the major target for now.
The multi year ABCD from the 2020 low gives us a target around the next major level of 80k. The question now is if this PB we had from Thursday is done or will we see one more move lower to the 382 from this move up around the 60k level.
There are a couple of major turn points coming up that I will post.
I will take a look at the shorter TF as well to give some levels to watch.
US Interest Rate decision on Wednesday this week as well will move the market as well.

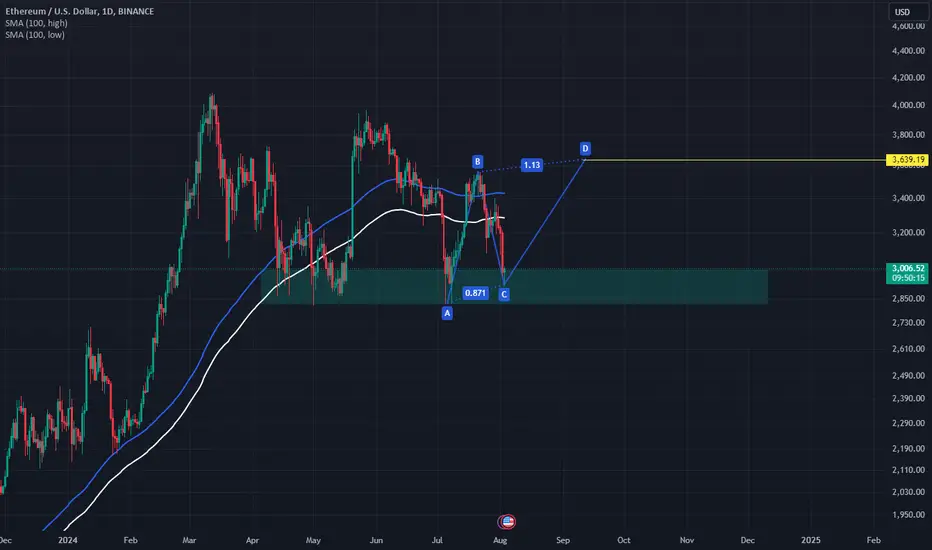
Eth enters the demand area very strongETH in a strong request area, the probability of reaching $ 3600, which represents a reflection of the ABCD Model.
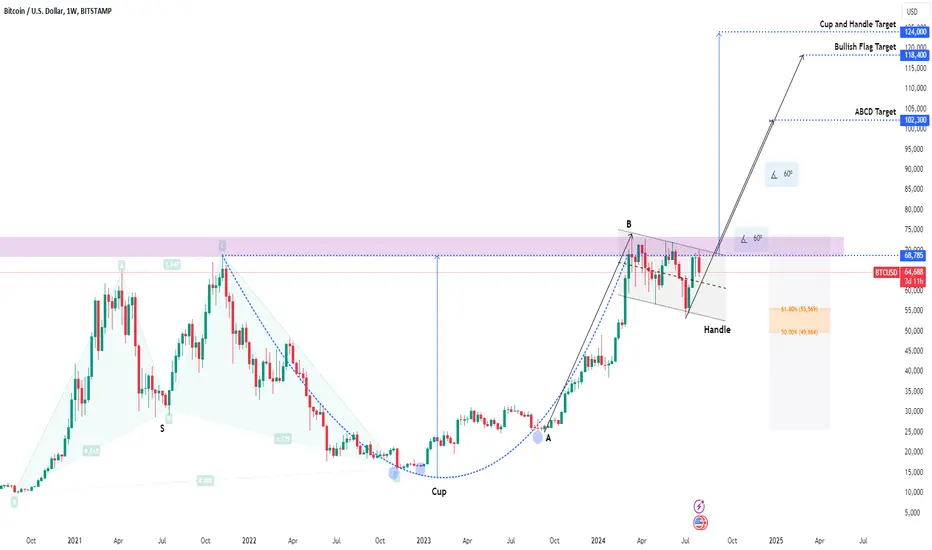
BTC_[Weekly]_Chart Patterns (C&H, Flag, ABCD)BTC Weekly Analysis:
Price is moving beautifully in chart patterns.
Cup and Handle formation is evident, Breakout of Handle will take the price high.
Bullish Flag Pattern
ABCD Pattern
Target Price for long-term are specified.
Watch Hourly, Daily and Monthly Charts for details.
XAUUSD: From our previous analysis, price did early mitigationIn our previous analysis we stated that price could reach 2330 region and reject from there as we though price is finally going to fill the gap. However, it did not work out as we expected and price mitigated from early key level where previously price reversed from. We anticipating price to grow from the current region, a safe entry can be at 2308 from where we can see price reversing strongly. Good luck.

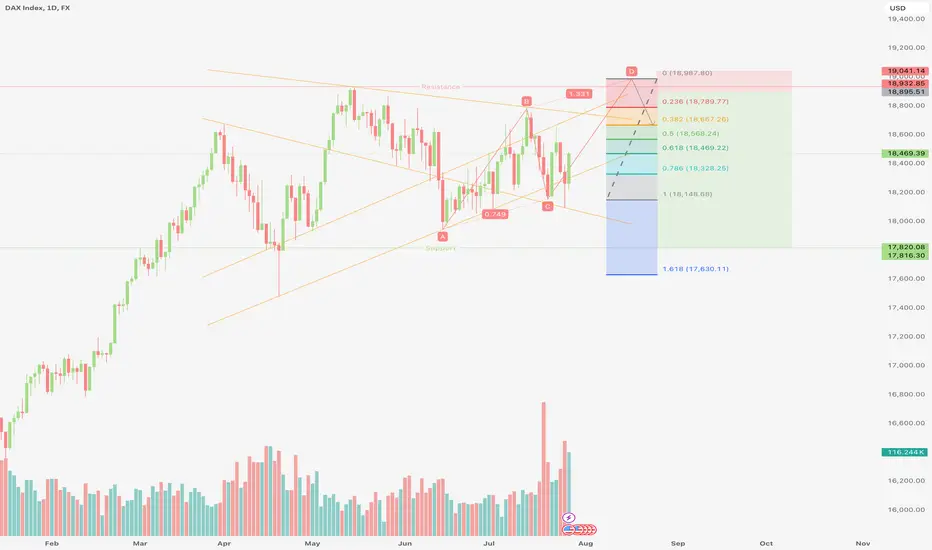
Ger30 - August Short SetupVarious Channels and ABCD short setup identified.
This pattern is still in the process of forming. Possible bearish price movement towards target levels ranging from 18,666.26 to 17,625.74 within the next 7 days.
Expiry Date/Time: 8/8 03:14
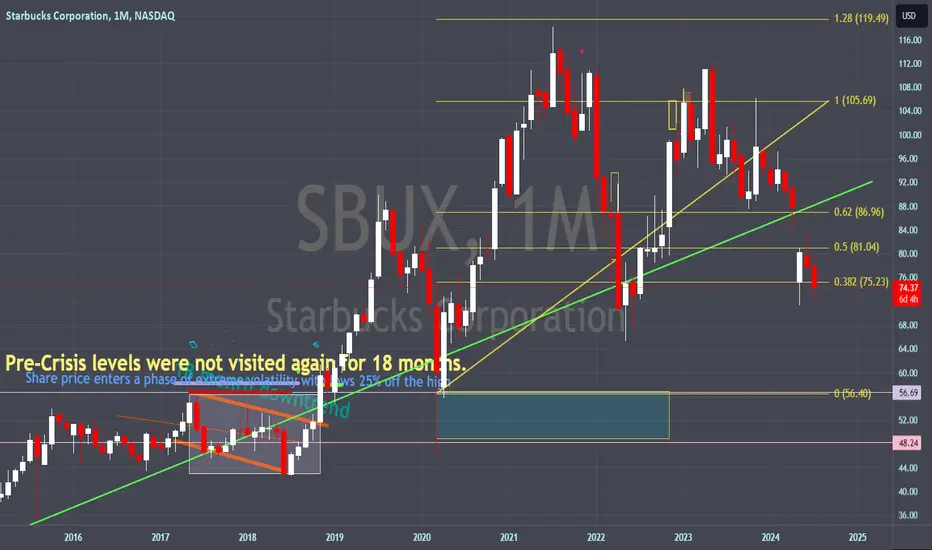
My Piece of the #BlackRockTell Larry I'm Telling
I first analyzed SBUX stock for one of my Analysis.
I was doing a Crisis Analysis on the company, and was very intrigued by my findings.
I have been informed that strategies have been developed off of my Investigations and Analysis, And now I want to be paid Mein.
Just of few pieces of a few generations of earnings.
-The Prince of Carthage.