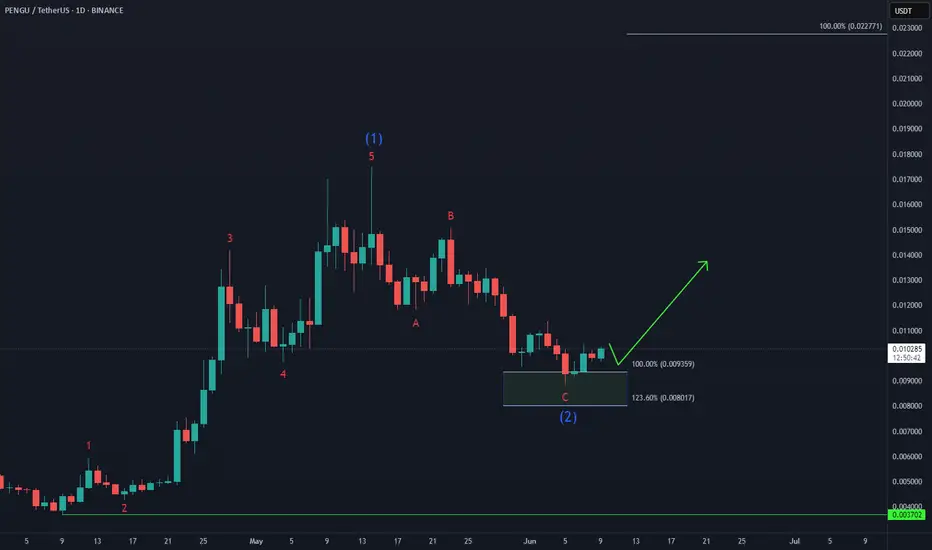
Pudgy Penguins PENGU Gearing Up for a +100% Move! 🐧 BINANCE:PENGUUSDT has completed its 5-wave advance from the April low (wave 1) and corrected with a 3-wave Zigzag structure in wave (2), reaching the buying area at equal legs $0.009 - $0.008.
🚀 Now, it's setting up for wave (3) higher, with an initial target at $0.022.
🌊 Are you positioned to catch the next wave higher?
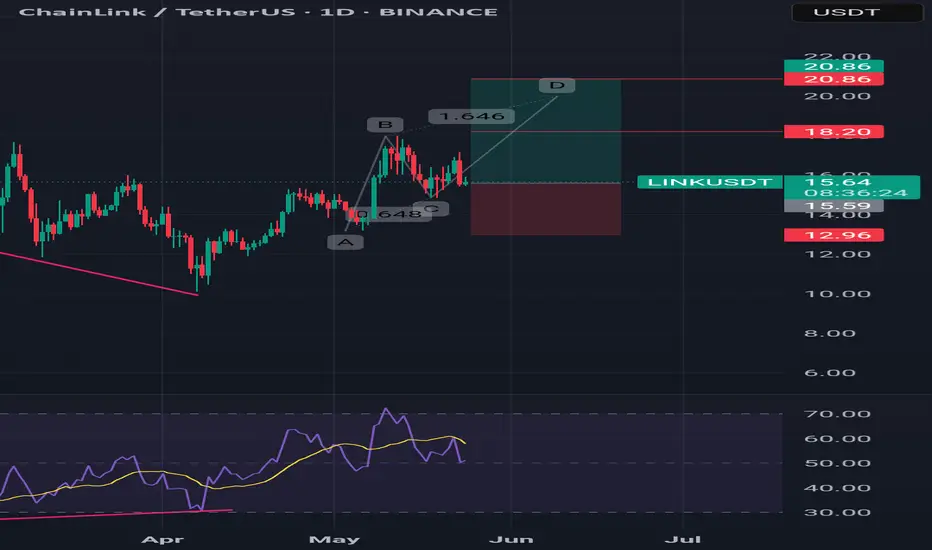
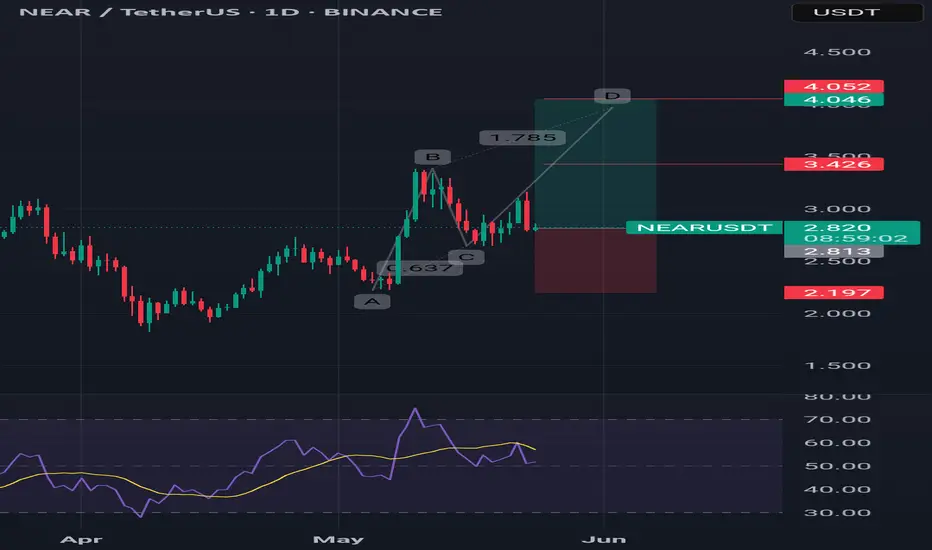
AB=CD
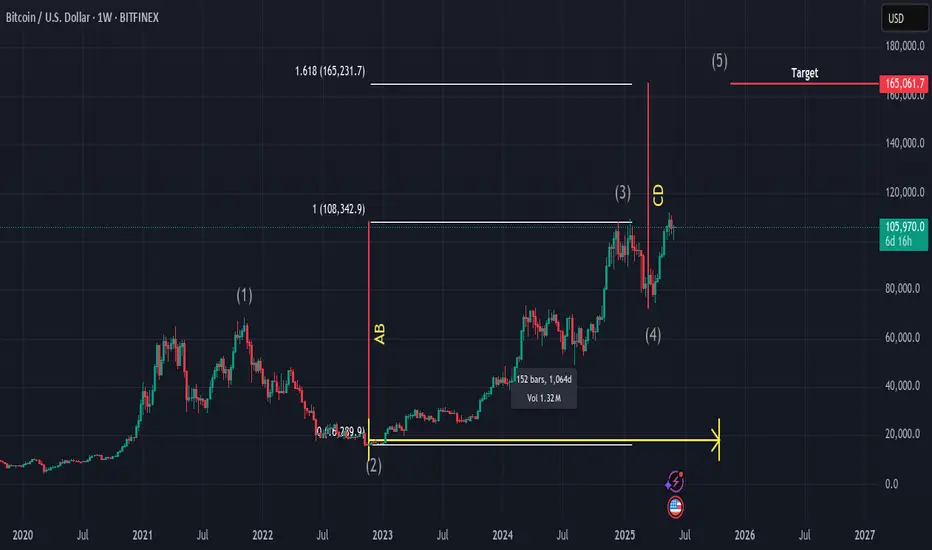
BTCUSD analysis for this cycle TopBTCUSD analysis for this cycle Top
1. According to the Elliot wave it is the 5th wave of elliot theory
2. As per the time cycles Btc should define the top in the last quarter of this year possibility in (oct or nov)
3. And for the projection as always the Btc favourite patthen AB=CB is also in play.
4. Fib extension tool level 1.618
So as we can see if btc will play according to this analysis. As its always follows this same things again & again in all cycle. So we can expect the top somewhere around (165,000).
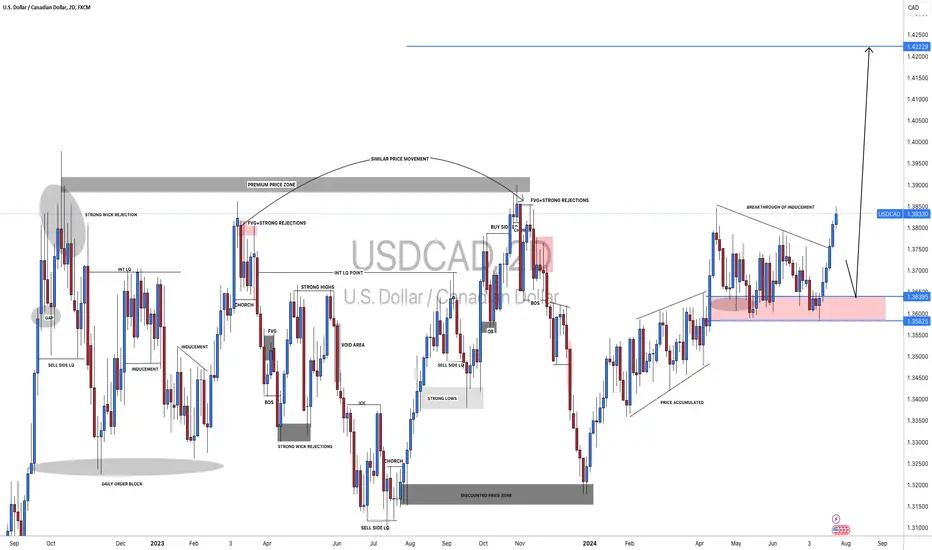
#USDCAD: 500+ Pips Big Buy Opportunity!Dear Traders
Hope you are doing great, we have a great buying opportunity on USDCAD, our first entry is in profit of 250+ pips, however, we expect price to grow steadily after reconfirming the same area. USDCAD tends to reconfirm the order block area many times before a big bull move. Good luck.
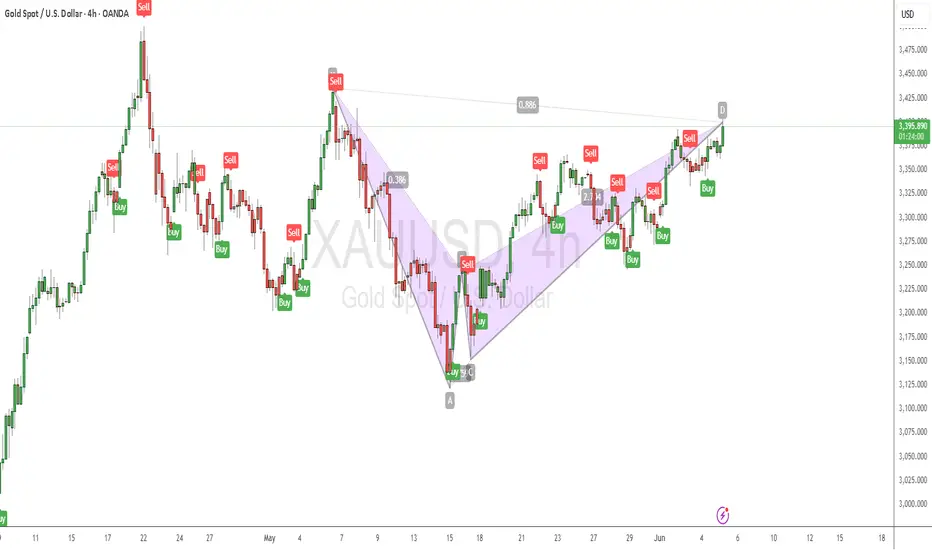
Gold Bearish BAT Pattern?As shown in the chart, Bearish BAT pattern formed
Also in the smaller timeframe, AB=CD formed
I would suggest that you wait for the closing of the H4 Candle first.
I am looking for a liquidity sweep here in the smaller time frames to enter
for more info, slide to my DM's
#GoodLuck

BTCUSDT is following flag PatternBTCUSDT is following a flag Pattern, it has also given a retracement of the 0.5 fib level.
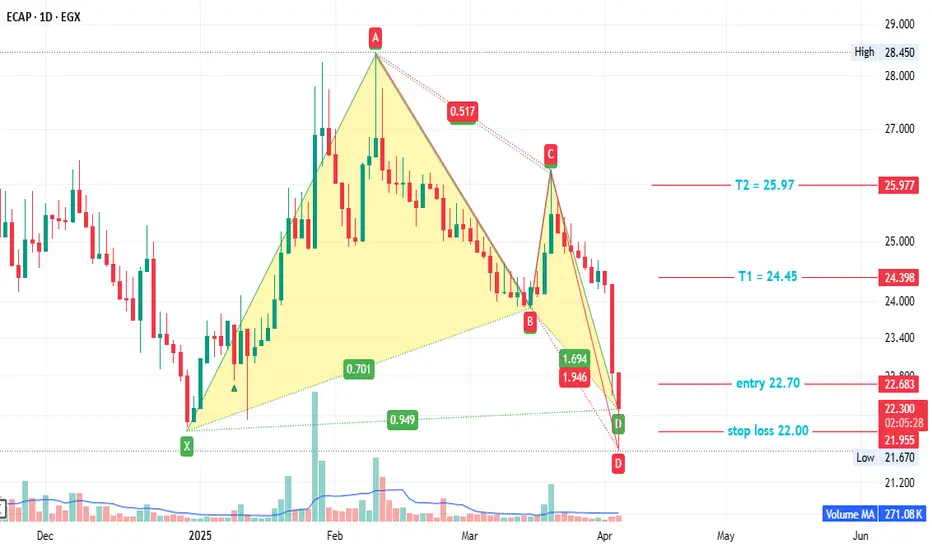
ECAP - Egyptian stock#ECAP timeframe 1 DAY
created 2 Bullish pattern ( Gartley and AB=CD ) , so we can see action price in this point .
Entry level at 22.70 ( price now 22.40 )
Stop loss 22.00( loss may go to up -3% )
First target at 24.45( with profit around 7.60% )
Second target 25.97( with profit around 14.70% )
NOTE : this data according to time frame I DAY ,
Its not an advice for investing only my vision according to the data on chart
Please consult your account manager before investing
Thanks and good luck
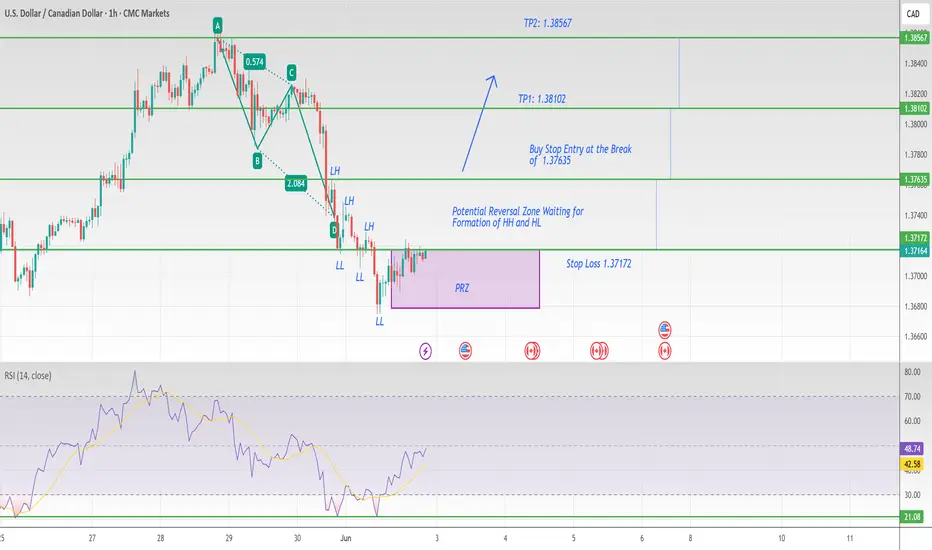
USDCAD 1H AB=CD pattern Bullish ReversalUSDCAD 1H AB=CD pattern Bullish Reversal
Stop Loss: 1.37172
Buy Stop: 1.37635
TP1: 1.38102
TP2: 1.38567
In Harmonics, There could be divergence and there might not be
Risk-Reward = Reward / Risk = 1% to 1%
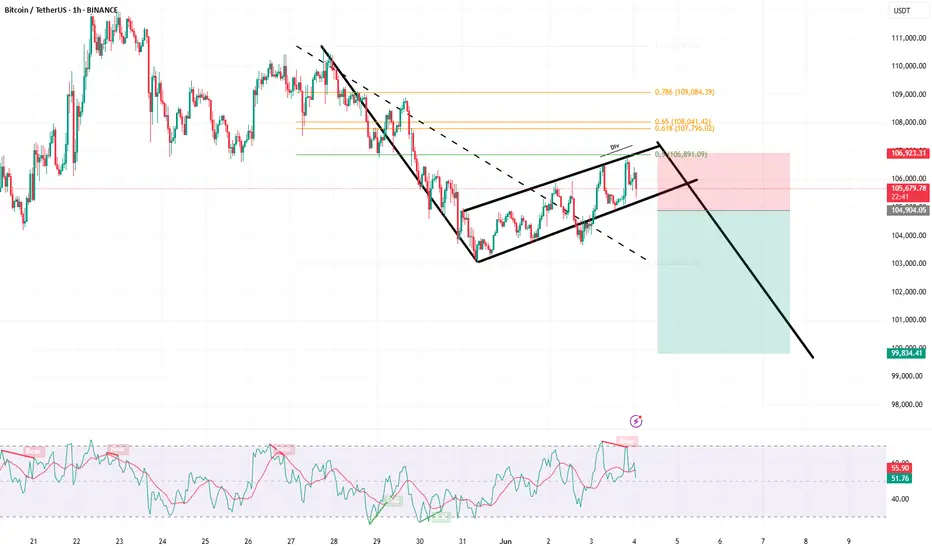
A Harmonic Pattern Entry Into A Potential Continuation TradeI don't look at Bitcoin often but when answering a question for another trader this weekend I stumbled across an interesting opportunity.
Higher timeframe we've recently broken and closed above a previous high, allowing me to project that price is likely to continue higher.
We've already started to retracement in the form of a complex pullback and if you look carefully on the lower timeframe this complex pullback as also created a bullish bat pattern which could be used as an entry.
Please leave any questions or comments below
Akil

#DOGEUSDT: Upcoming Big Bullish Move| Crypto| Setupsfx_| BINANCE:DOGEUSDT price is still bearish, however, after some point we can see strong bullish volume kicking in the market. After NFP today, we might see price dropping a little more until it reaches our area of entry. From which we can see strong price rebound towards our target area which would be 0.23.
We wish you all the best and always maintain a great risk to reward ratio.

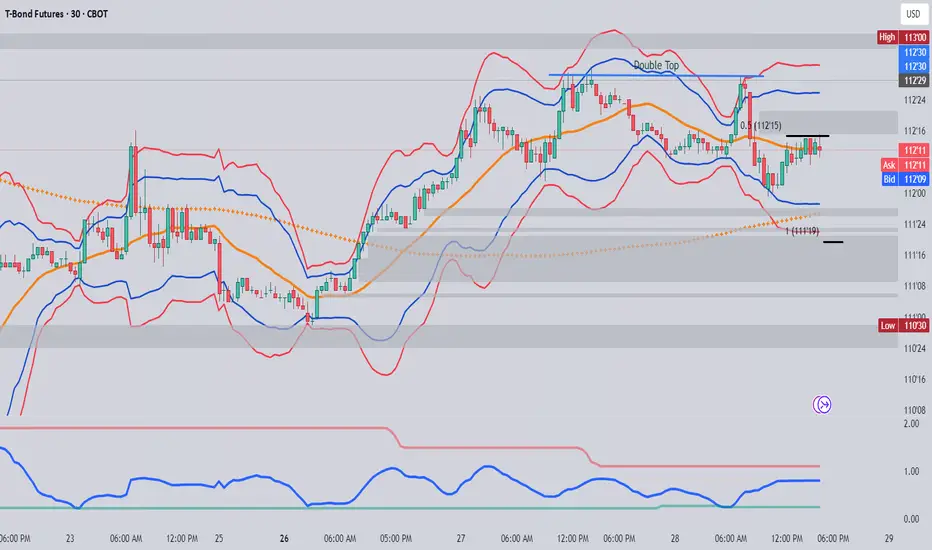
$ZB - 30y Treasury Futures Sell off in Equity Risk OnThe 30-Year Treasury Bond Futures (ZB) sold off notably, driven by a combination of macro headlines and technical positioning. A key catalyst was the European Union’s decision to postpone the implementation of retaliatory auto tariffs until July 9th, which temporarily eased geopolitical tensions and triggered a risk-on rotation into equities — at the expense of duration-heavy fixed income assets.
From a technical standpoint, ZB fell sharply from the upper 3 standard deviation Bollinger Band and found support near the 2 standard deviation band, where it stabilized. It then retraced roughly 50% of the move, tagging the 20-period simple moving average. Market participants are now closely watching whether the contract completes a full measured move lower to 111'19, a level that represents:
The 100% Fibonacci extension of the prior decline
A test of the lower 3 standard deviation band
A notable inefficiency zone on the hourly chart
While the MOVE Index has declined and is now tracking sideways — signaling reduced bond market volatility — traders remain focused on long-end supply, fiscal slippage, and global rate re-alignments. Until these themes settle, technical levels like 111'19 may continue to act as magnets for price discovery in long-dated Treasuries.
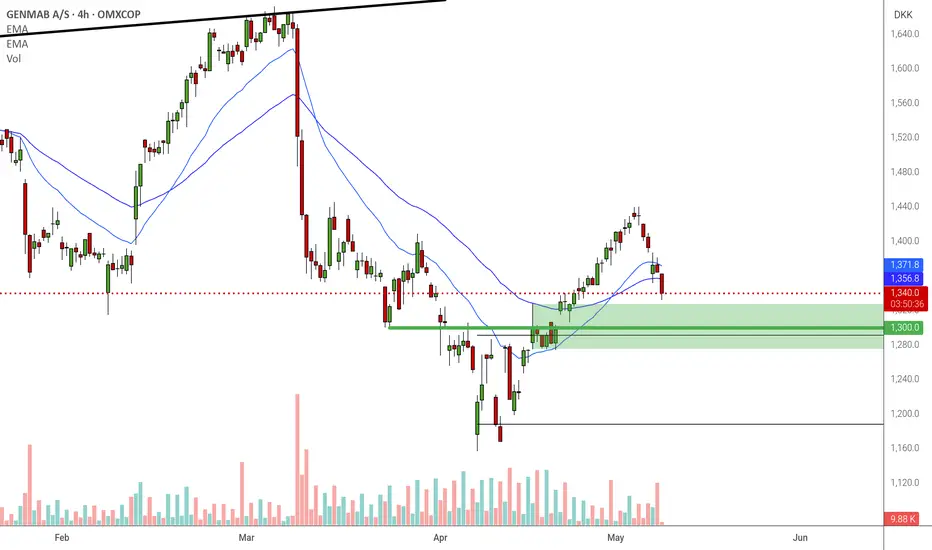
Genmab 4h longZone + 1st measured move PB.
Could potentially go all the way up to the expanding triangle top?
AUS200 - Bullish Continuation Using 3 Bar Reversals, Fibs, AB=CDAfter a recent violation of a previous structure high, the AUS200 shown signs of relief with a pullback into the previous level of structure resistance which we would now look to act as present structure support.
At this level price has also given us a 3-Bar Reversal which can be used as a reason for entry.
Targets are protected at a previous level of structure highs on the daily, also being supported by a Fibonacci extension level and an AB=CD pattern projection.
If you have any questions, comments, or just want to share your ideas, please do so below. A please show your support by hitting that LIKE button before you go.
Akil

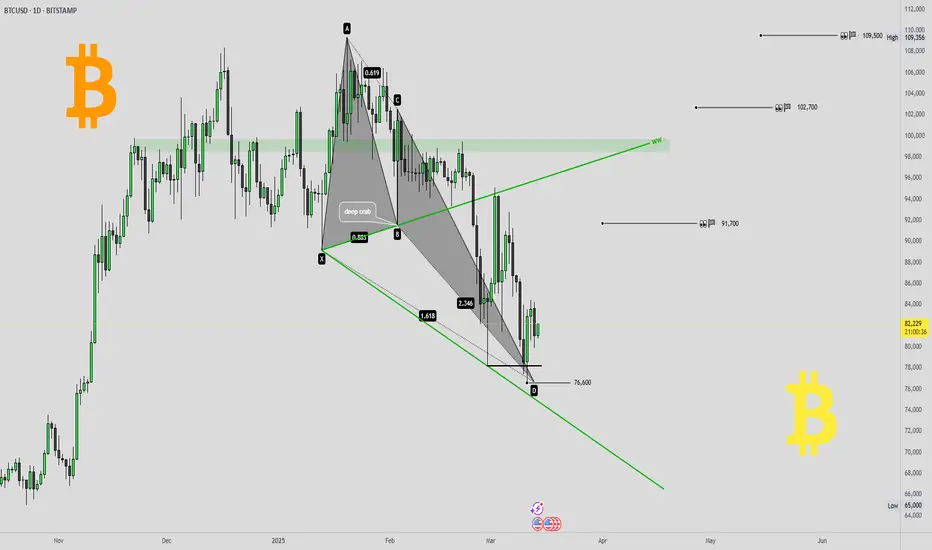
Bitcoin reversal confirmed ?!Bitcoin reversal confirmed ?! 👀
I would like to present you some charts with important levels and relevant patterns.
🖥daily-chart (BITSTAMP) and 💡everything important in the chart 👀
💥Here in the daily chart (BITSTAMP)
- a Deep-Crab harmonic with
- a WolveWave
and the daily-chart of the
🔥Daily MA200 re-test 👀
- gap fill
- support-line 2022 and 2024 TOPs
👉 BITCOIN roadmap/outlook (from 27th february 2024) 💡
🎯 If you like this idea, please leave me a 🚀 and follow for updates 🔥⏰
Furthermore, any criticism is welcome as well as any suggestions etc. - You're also very welcome to share this idea.
Have a nice evening & successful trading decisions 💪
M_a_d_d_e_n ✌
NOTE: The above information represents my idea and is not an investment/trading recommendation! Without any guarantee & exclusion of liability!
recap - " Bitcoin reversal confirmed ?! "BITCOIN reversal confirmed?! 👀
BITSTAMP:BTCUSD
How did this idea develop? 🤔
🥇Recap of the idea(s) from March 14, 2025 (see right 👀 under “Related Publications”)🎯
Hello ❤TradingView Community 👋
After the sell-off/correction ended on April 7, 2025' - Bitcoin reached an absolute low of $74434. This was followed by a nice rally and the complete fulfillment of the price targets from the idea of March 14, 2025 (push the play-button 😍).
Everything important is in the chart!
💡 This idea is closed at this point ✔
👉 All targets have been achieved 🎯💪
💥Follow me to stay up to date and be the first to receive these important updates/news & not miss anything! ⏰🔔
Furthermore, any criticism and suggestions etc. are welcome. - Feel free to share this idea.
Have a nice day & happy trading folks 🔥💪
M_a_d_d_e_n ✌
NOTE: The above information represents my idea and is not an investment/trading recommendation! No guarantee & exclusion of liability!
👉 BITCOIN roadmap/outlook (from 27th february 2024) 💡

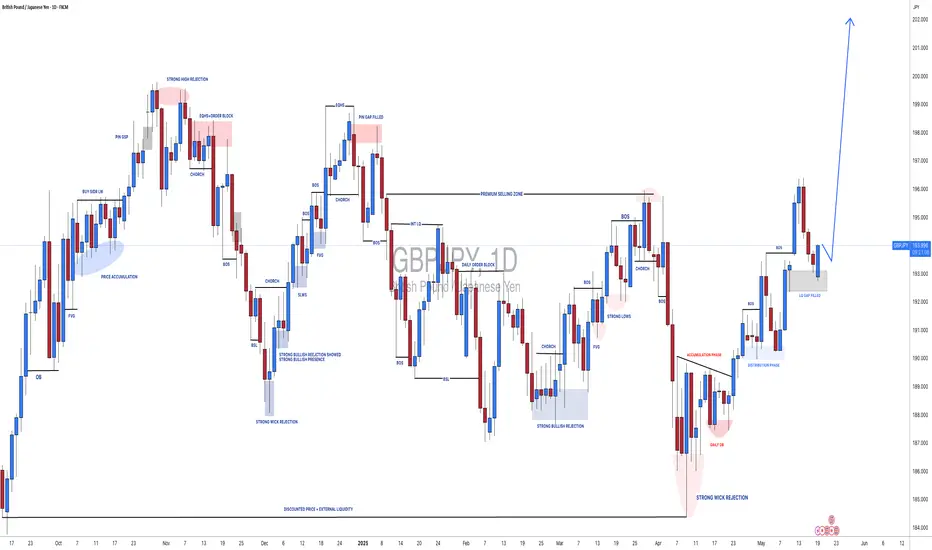
GBPJPY: Will Price Touch a Major Psychological Point Of 200? The GBPJPY currency pair is currently struggling to break through the 194 region as the Japanese yen (JPY) consolidates, making the future price trajectory uncertain. This situation has significantly complicated trading JPY pairs.
Analysing historical price behaviour in similar circumstances can provide insights into potential future movements, but it’s crucial to conduct thorough research before engaging in trading. Past performance doesn’t guarantee adherence to chart trends.
The Japanese yen (JPY) also exhibits a negative correlation with the US dollar (USD). Given our bullish stance on the DXY index in the coming days, we anticipate substantial pressure on the JPY, potentially leading to a significant decline. It’s also worth considering the GBP, which has surged to prominence as one of the most sought-after currencies since the market opened earlier today.
In the meantime, we recommend setting two take-profit targets: one at 197 and another at 199. These levels are likely to witness substantial bearish volume entering the market.
We wish you successful trading and emphasise the importance of adhering to safety protocols.
We appreciate your unwavering support and encourage you to contribute by liking, commenting, or sharing our ideas.
Team Setupsfx_
❤️🚀
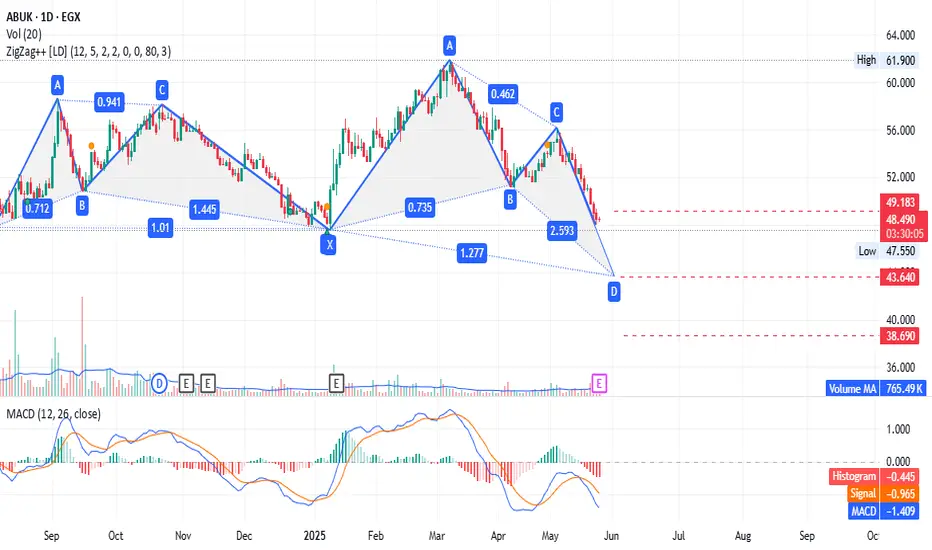
#ABUK - very confusing / where is the bottom ??!!!!3 levels prices may respect it :
first : 49.18
secund : 43.64 ( may be )
third : 38.69 ( really, no one bigger than market )
i am waiting for any positive sign at any level, now MACD is negative on daily basis .
any way consider stop loss to save your capital
good luck
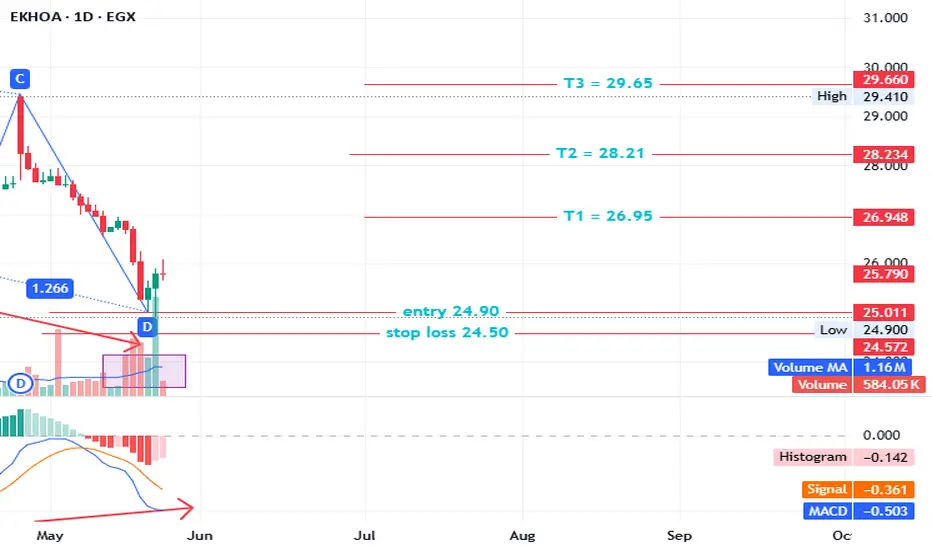
#EKHOA - only for share holders / not for new entry .EKHOA - 1 day timeframe
Bullish AB=CD pattern formed / For shareholders only
Stop loss: 24.50
T1: 26.95
T2: 28.21
T3: 29.65
Entry: around 25.00
MACD shows positive divergence daily, with increased volume over the past week, supporting our view.
Note: The stock has been in a downtrend and remains under negativity.
This is not financial advice, just our analysis based on chart data. Please consult your account manager before investing.
Thanks and good luck!
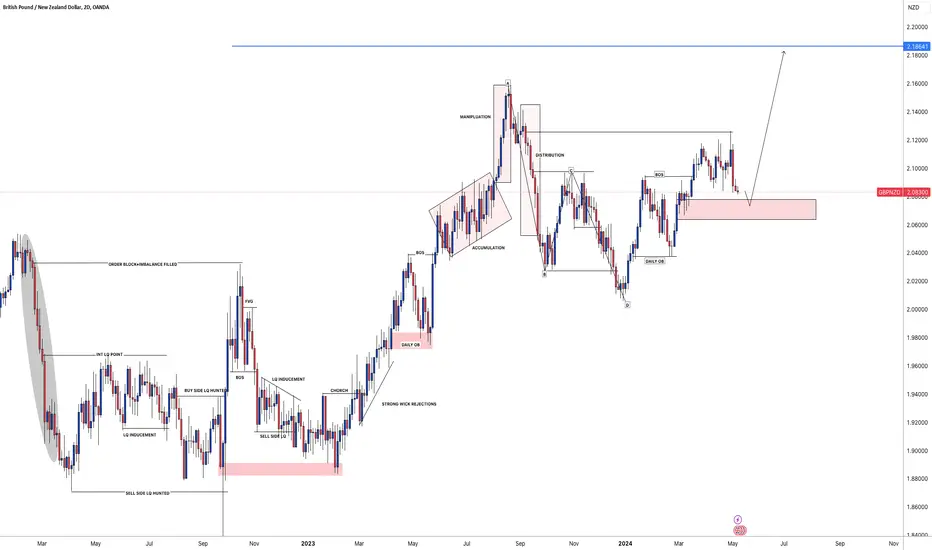
GBPNZD: 800+ Pips Possible Buying Opportunity!OANDA:GBPNZD
Price currently at the possible rebound area where we can expect price to reverse from, upcoming weeks expecting GBP to be bullish against NZD. However, first we will have to wait for price to reject and rebound strongly. Based on that you may take entry using accurate risk management. At least eying at 700-800 pips. Good Luck and Trade Safe.
show us some love by liking and commenting the idea. ❤️
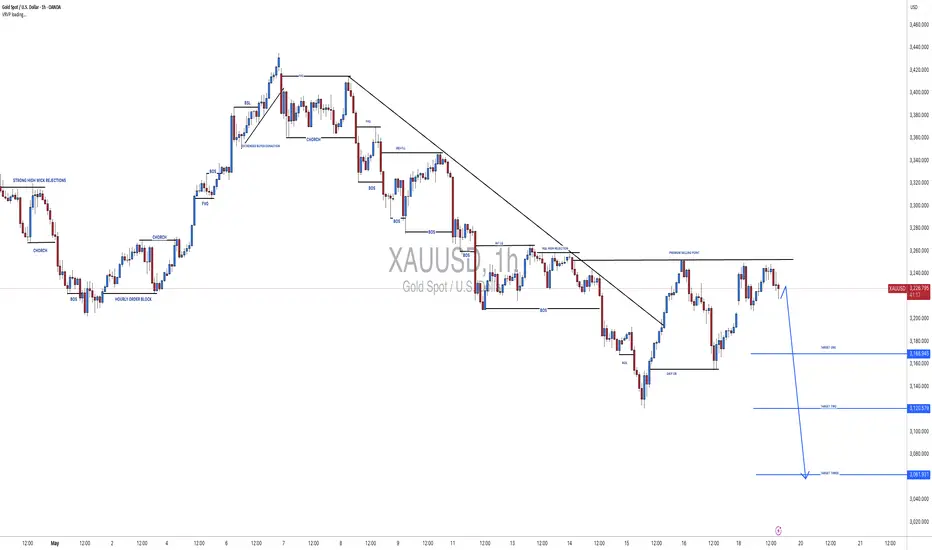
XAUUSD[GOLD]: 1 Hour View Show Extreme Seller Volume Gold in a shorter time frame shows extreme bearish volume kicking in the market, where bulls are failing to push prices higher. Additionally, if you’re someone who analyses patterns, a HEAD AND SHOULDERS pattern has also formed. There are three targets you can aim for.
We extend our best wishes and good luck in your trading endeavours. Your unwavering support is greatly appreciated.
If you’d like to contribute, here are a few ways you can assist us:
- Like our ideas
- Comment on our ideas
- Share our ideas
Team Setupsfx_🚀❤️
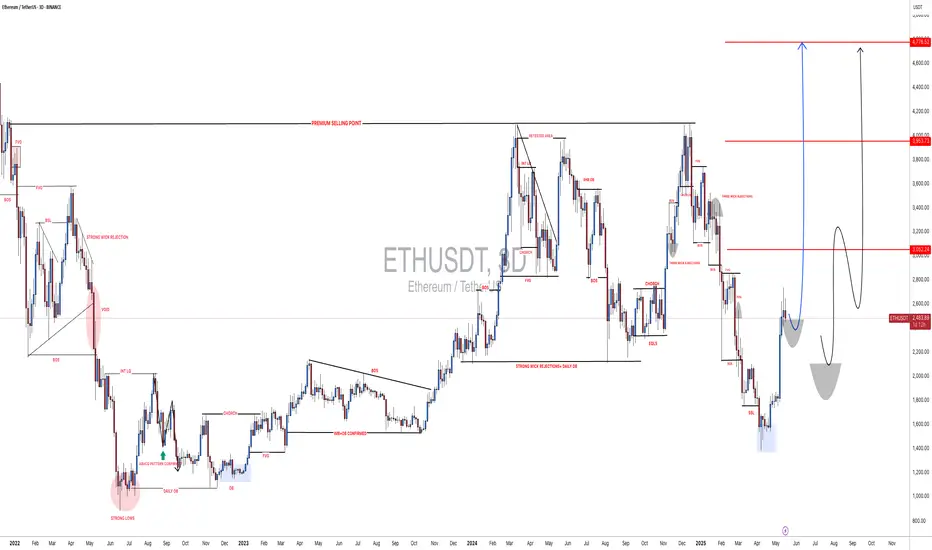
ETHUSDT: Possible Minor to Major Corrections May HappenETHUSDT has a higher chance of experiencing a minor or major correction in the coming days, although we haven’t confirmed this yet. We need more confirmation before we can be certain about the future of ETH. However, if the price decides to undergo a major correction, it’s likely to drop to our second area, where it’s expected to fill the liquidity gap and then reverse, continuing towards our three targets.
Please use this analysis as secondary bias only or even only for educational purposes. Always conduct your own analysis and risk management before trading or investing in cryptocurrencies, as they carry significant financial risk. Good luck and trade safely.
If you want to support us, you can do so by liking the idea, commenting with your views, or sharing it.
Much love ❤️
Have a great weekend
Team Setupsfx_