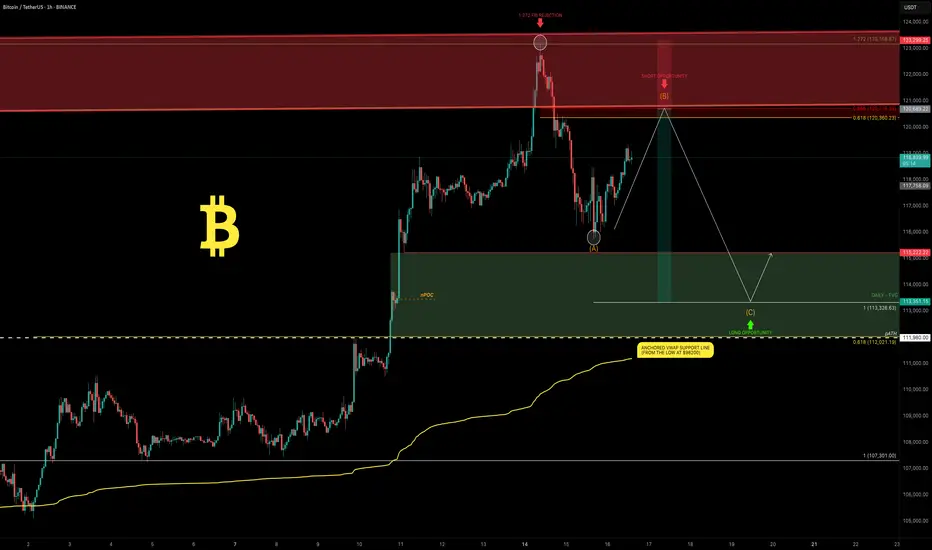
Bitcoin: New All-Time High — What’s Next?Bitcoin had an incredible run, breaking the old all-time high ($111,980) with strong bullish momentum and setting a fresh ATH at $123,218 (Binance). We just witnessed the first major corrective move of ~6% and a decent bounce so far — but the big question is:
What’s next? Will Bitcoin break higher over the summer or form a trading range here?
Let’s dive into the technicals.
🧩 Higher Timeframe Structure
May–June Range:
BTC was stuck between $110K–$100K, forming an ABC corrective pattern. Using trend-based Fib extension (TBFE) from A–B–C:
✅ C wave completed at $98,922 (1.0 TBFE)
✅ Upside target hit at $122,137 (-1 TBFE)
Full Bull Market TBFE:
➡️ 1.0 → $107,301 → previously rejected
➡️ 1.272 → $123,158 → recent rejection zone
Pitchfork (log scale):
➡️ Tapped the upper resistance edge before rejecting.
Previous Bear Market Fib Extension:
➡️ 2.0 extension at $122,524 hit.
2018–2022 Cycle TBFE:
➡️ 1.618 at $122,011 tapped.
Macro Fibonacci Channel:
➡️ Connecting 2018 low ($3,782), 2021 ATH ($69K), 2022 low ($15,476) →
1.618–1.666 resistance band: $121K–$123.5K.
✅ Conclusion: Multiple fib confluences mark the $122K–$123K zone as critical resistance.
Daily Timeframe
➡️ FVG / Imbalance:
Big daily Fair Value Gap between the prior ATH and $115,222 swing low.
BTC broke the prior ATH (pATH) without retest → a pullback to this zone is likely.
Lower Timeframe / Short-Term Outlook
We likely saw a completed 5-wave impulse up → now correcting.
The -6% move was probably wave A, current bounce = wave B, next leg = wave C.
➡ Wave B short zone: $120K–$121K
➡ Wave C target (1.0 TBFE projection): ~$113,326
➡ Confluence at mid-FVG + nPOC
Trade Setups
🔴 Short Setup:
Entry: $120,300–$121,000
Stop: Above current ATH (~$123,300)
Target: $113,500
R:R ≈ 1:2.3
🟢 Long Setup:
Entry: Between Prior ATH and $113,000
Stop: Below anchored VWAP (~$110,500)
Target: Higher, depending on bounce confirmation.
🧠 Educational Insight: Why Fibs Matter at Market Extremes
When markets push into new all-time highs, most classic support/resistance levels disappear — there’s simply no historical price action to lean on. That’s where Fibonacci extensions, channels, and projections become powerful tools.
Here’s why:
➡ Fibonacci extensions (like the 1.272, 1.618, 2.0) help estimate where trend exhaustion or profit-taking zones may appear. They are based on the psychology of crowd behavior, as traders anchor expectations to proportional moves from previous swings.
➡ Trend-Based Fib Extensions (TBFE) project potential reversal or continuation zones using not just price levels, but also the symmetry of prior wave moves.
➡ Fibonacci channels align trend angles across multiple market cycles, giving macro context — like how the 2018 low, 2021 ATH, and 2022 low project the current 1.618–1.666 resistance zone.
In short:
When you don’t have left-hand price history, you lean on right-hand geometry.
That’s why the $122K–123K zone wasn’t just random — it’s a convergence of multiple fib levels, cycle projections, and technical structures across timeframes.
⚡ Final Thoughts
Bitcoin faces major resistance around $122K–$123K backed by multiple fib and structural levels. A retest of the prior ATH zone (~$112K–$113K) looks probable before the next big directional move. Watch lower timeframe structure for signs of completion in this corrective phase.
_________________________________
💬 If you found this helpful, drop a like and comment!
Want breakdowns of other charts? Leave your requests below.
Abcpattern
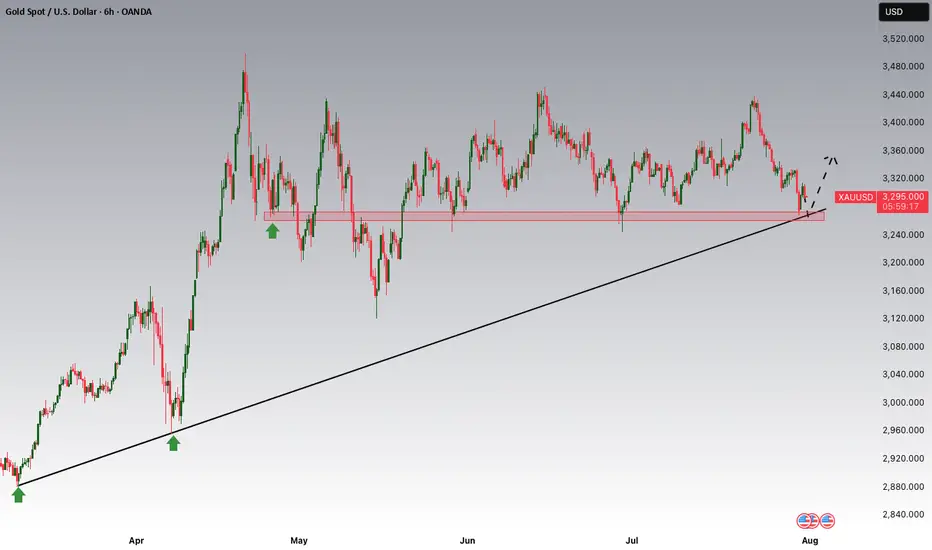
Gold Potential UpsidesHey Traders, in today's trading session we are monitoring XAUUSD for a buying opportunity around 3,270 zone, Gold is trading in an uptrend and currently is in a correction phase in which it is approaching the trend at 3,270 support and resistance area.
Trade safe, Joe.
NASDAQ Potential UpsidesHey Traders, in today's trading session we are monitoring NAS100 for a buying opportunity around 23,140 zone, NASDAQ is trading in an uptrend and currently is in a correction phase in which it is approaching the trend 23,140 support and resistance area.
Trade safe, Joe.
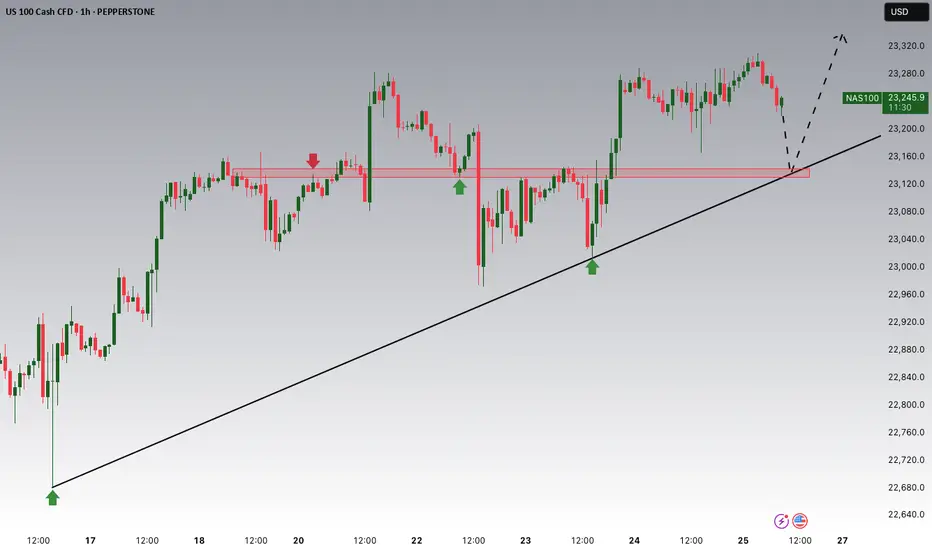
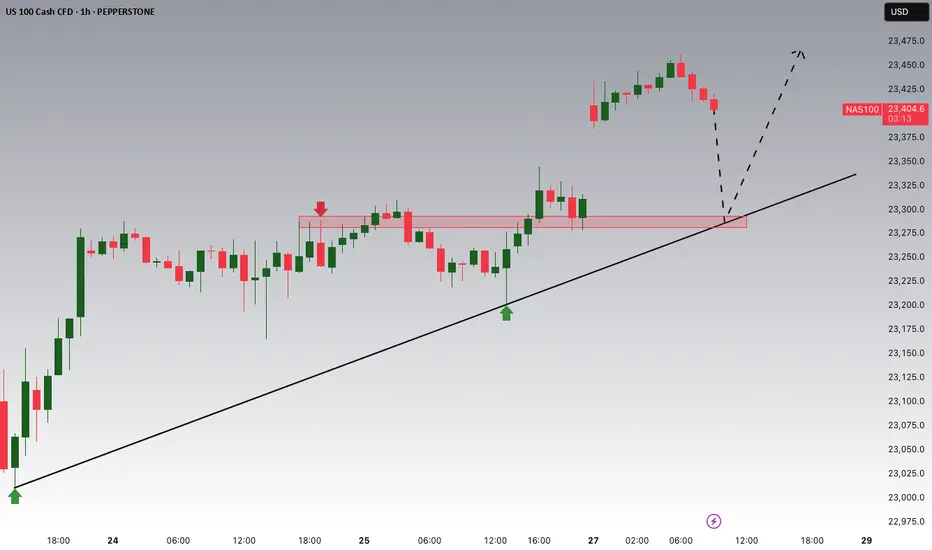
NASDAQ Potential UpsidesHey Traders, in today's trading session we are monitoring NAS100 for a buying opportunity around 23,300 zone, NASDAQ is trading in an uptrend and currently is in a correction phase in which it is approaching the trend at 23,300 support and resistance area.
Trade safe, Joe.
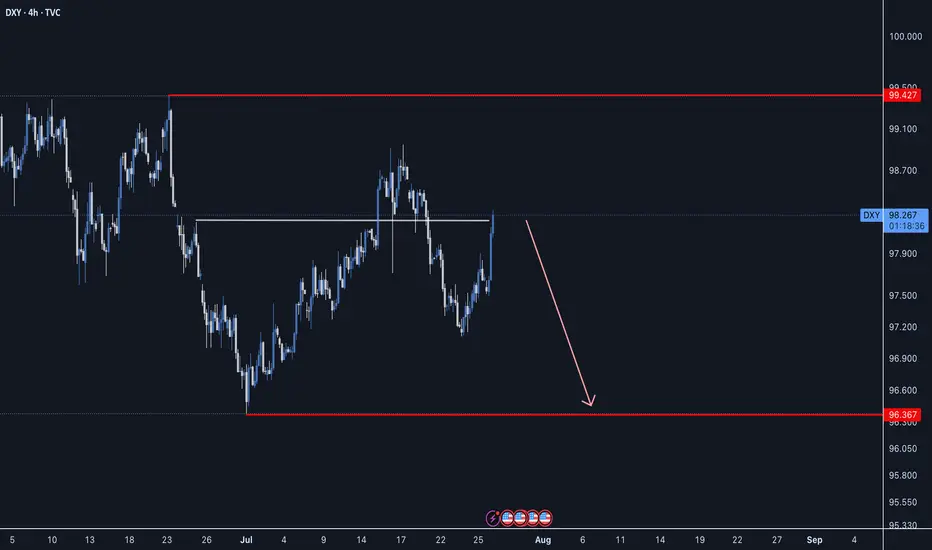
DXY - ABC Move still in playDXY has been moving not so much on technical factors lately but more so with what Mr. Trump says, we still could see a move lower with an ABC pattern.
Good Luck
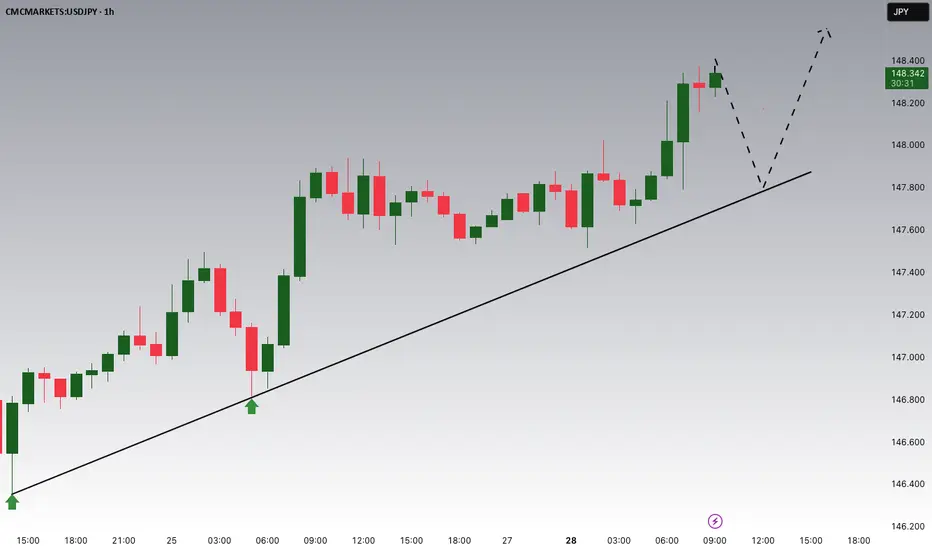
USDJPY Potential UpsidesHey Traders, in today's trading session we are monitoring USDJPY for a buying opportunity around 147.800 zone, USDJPY is trading in an uptrend and currently is in a correction phase in which it is approaching the trend at 147.800 support and resistance area.
Trade safe, Joe.
USDJPY Breakout and Potential RetraceHey Traders, in today's trading session we are monitoring USDJPY for a buying opportunity around 146.300 zone, USDJPY was trading in a downtrend and successfully managed to break it out. Currently is in a correction phase in which it is approaching the retrace area at 146.300 support and resistance area.
Trade safe, Joe.

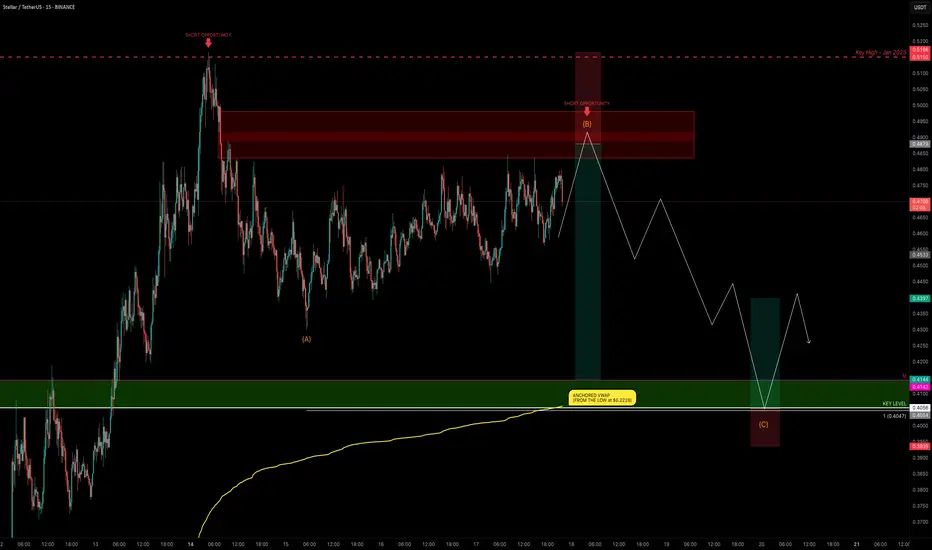
XLM Explodes +132% — Is the Party Over or Just Starting?XLM has been one of the top movers, sweeping the January 2025 swing high at $0.515 before stalling and moving sideways for the past 4 days.
Is XLM gearing up for another push toward the highs, or is a correction imminent?
Let’s dive into the details.
🧩 Market Structure & Fractal Pattern
XLM skyrocketed +132% in just 13 days, mirroring the explosive move seen back in November 2024.
If we apply the November fractal, the current price action suggests we could be setting up for an ABC corrective move.
📉 Key Levels & Confluences
FVG Zone: ~$0.49–$0.50 — likely to be swept before any major move down.
Monthly Support: $0.4142
Key Level / Liquidity Pool: $0.4056 — likely cluster of stop-losses.
Anchored VWAP (from $0.2228 start of trend): currently near $0.4056, adding strong confluence.
1.0 Trend-Based Fib Extension (ABC projection): If price pushes to ~$0.49 to complete wave B, the projected 1.0 TBFE for wave C lands right on the $0.4056 key level + VWAP, creating a perfect confluence zone.
➡️ Conclusion: The $0.4142–$0.4056 zone is a critical support and liquidity area with multiple confluences lining up.
Trade Setups
🔴 Short Setup:
Entry zone: $0.48–$0.50 (ladder in)
Stop-loss: Above $0.5166 (prior high)
Take-profit: $0.4142–$0.4056 zone
R:R ≈ 1:3
🟢 Long Setup:
Entry zone: $0.4142–$0.4056 (preferably near VWAP)
Stop-loss: Below $0.395
Take-profit: $0.44
⚡ Final Thoughts
Watch for a potential final push toward $0.49–$0.50 before a corrective wave unfolds.
The confluence at the $0.4142–$0.4056 zone — including monthly/weekly levels, VWAP, liquidity pool, and the 1.0 TBFE target — makes it a key area for decision-making.
Stay patient and wait for confirmation at these levels. Will post an update as things unfold!
_________________________________
💬 If you found this helpful, drop a like and comment!
Want breakdowns of other charts? Leave your requests below.
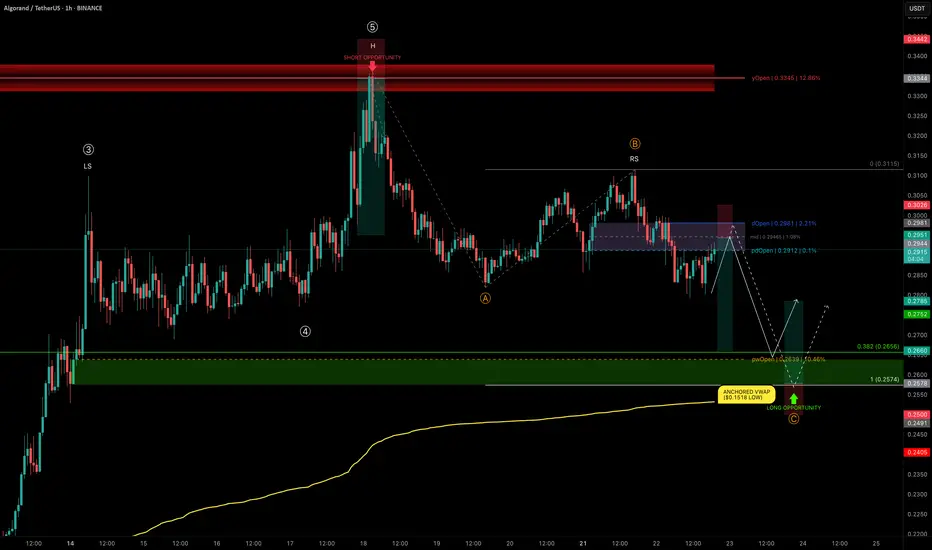
ALGO rejects at yOpen — Mapping High-Conviction Trade ZonesALGO has delivered an impressive +124% rally from $0.1518 to $0.336 in just 25 days, completing a 5-wave Elliott impulse right into the yearly open resistance.
We are now in a correction phase, and the current structure is showing a head and shoulders pattern, with the right shoulder currently forming.
Let’s break down the key levels and setups.
🧩 Technical Breakdown
➡️ ABC Corrective Structure:
Targeting wave C near the trend-based fib extension (TBFE) at $0.2574
➡️ Fib Retracement Confluence:
0.382 retracement of the entire 5-wave move → $0.2656
Previous weekly open (pwOpen) → $0.2639
Liquidity pocket likely to be swept
Anchored VWAP from the $0.1518 low (start of the bullish trend) → currently at $0.2532, acting as a major support layer
Conclusion: Long opportunity zone between $0.2656–$0.2574
Trade Setups
🔴 Short Setup:
Why? ALGO has lost dOpen and pdOpen — a bearish sign for downward continuation.
Entry Zone: Between dOpen and pdOpen
Stop-loss: Above dOpen
Target (TP): 0.382 fib retracement (~$0.2656)
R:R: ≈ 1:3.5
🟢 Long Setup:
Entry Zone: Laddered Entries between $0.2656–$0.2574
Stop-loss: Below anchored VWAP (~$0.2532)
Target (TP): ~$0.2785+
R:R: ≈ 1:2.65
🛠 Indicator Note
I’m using my own indicator called "DriftLine - Pivot Open Zones " for this analysis, which I recently published.
✅ Feel free to use it in your own analysis!
Just head over to my profile → “Scripts” tab → apply it directly to your charts.
💡 Educational Insight: Why Confluence Matters
High-probability trades aren’t based on just one tool or level — they come from confluence, where multiple signals align: fib levels, VWAP, liquidity pools, price structures , and key levels.
For example, in this ALGO setup, it’s not just the fib retracement or just the VWAP — it’s the stacking of all these elements together that creates a precise zone with a better statistical edge.
✍️ Lesson: Don’t chase trades off single signals; stack tools for confirmation.
Patience, confirmation, and confluence — as always, the keys to high-probability setups. 🚀
_________________________________
💬 If you found this helpful, drop a like and comment!
Want breakdowns of other charts? Leave your requests below.
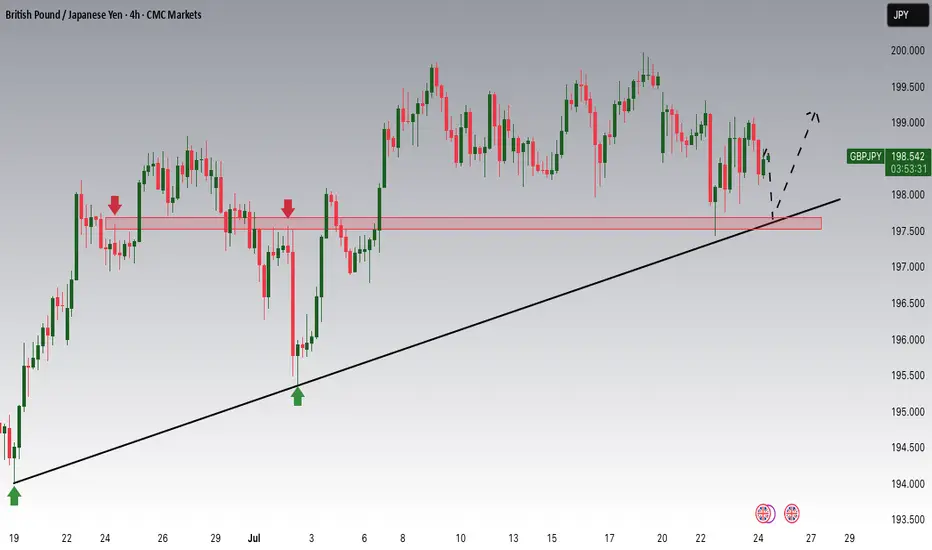
GBPJPY Potential UpsidesHey Traders, in today's trading session we are monitoring GBPJPY for a buying opportunity around 197.700 zone, GBPJPY is trading in an uptrend and currently is in a correction phase in which it is approaching the trend at 197.700 support and resistance area.
Trade safe, Joe.
USDCHF is Attempting to Break the Trend!!Hey Traders, in today's trading session we are monitoring USDCHF for a selling opportunity around 0.79720 zone, USDCHF was trading in an uptrend and currently seems to be attempting to break it out. If we get dips below the trend i will be looking for a retrace towards more lows.
Trade safe, Joe.

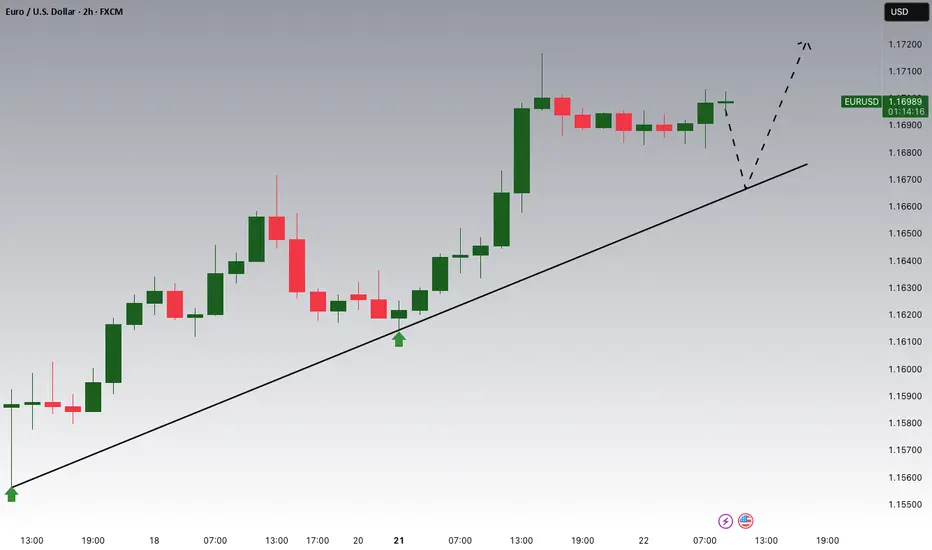
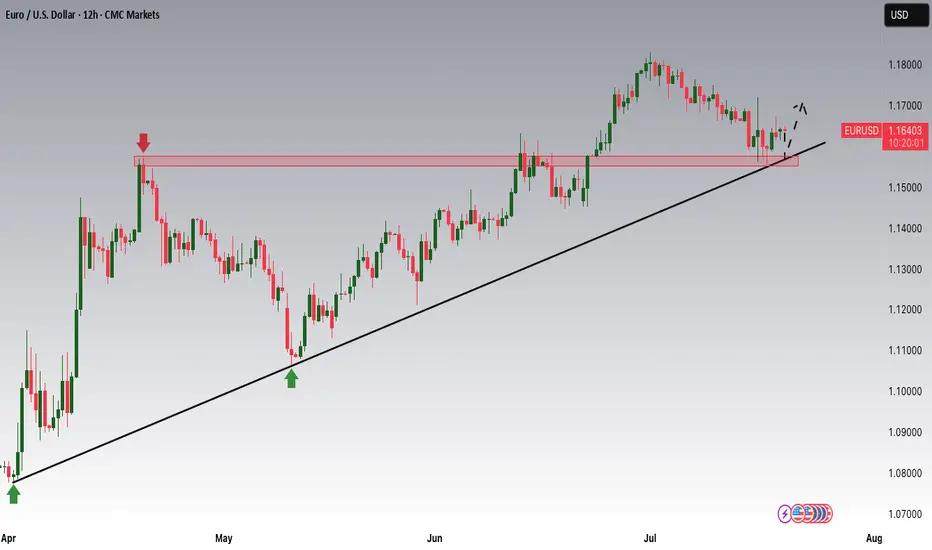
EURUSD Potential UpsidesHey Traders, in today's trading session we are monitoring EURUSD for a buying opportunity around 1.16650 zone, EURUSD is trading in an uptrend and currently is in a correction phase in which it is approaching the trend at 1.16650 support and resistance area.
Trade safe, Joe.
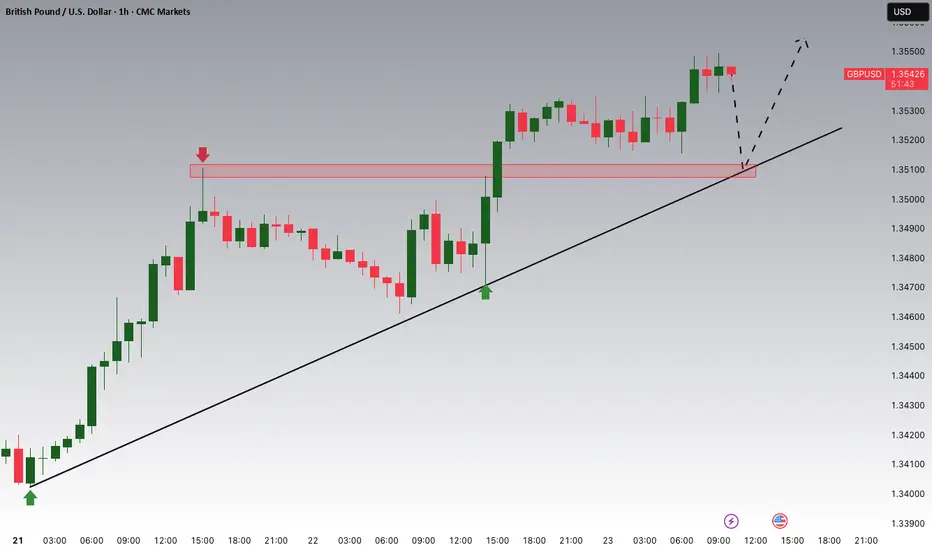
GBPUSD Potential UpsidesHey traders, in today's trading session we are monitoring GBPUSD for a buying opportunity around 1.35100 zone, GBPUSD is trading in an uptrend and currently is in a correction phase in which it is approaching the trend at 1.35100 support and resistance area.
Trade safe, Joe.
Dow Jones is Nearing an Important Support!!Hey Traders, in today's trading session we are monitoring US30 for a buying opportunity around 43,950 zone, Dow Jones is trading in an uptrend and currently is in a correction phase in which it is approaching the trend at 43,950 support and resistance area.
Trade safe, Joe.

EURUSD is Nearing the Daily Uptrend! Hey Traders, in today's trading session we are monitoring EURUSD for a buying opportunity around 1.15800 zone, EURUSD is trading in an uptrend and currently is in a correction phase in which it is approaching the trend at 1.15800 support and resistance area.
Trade safe, Joe.
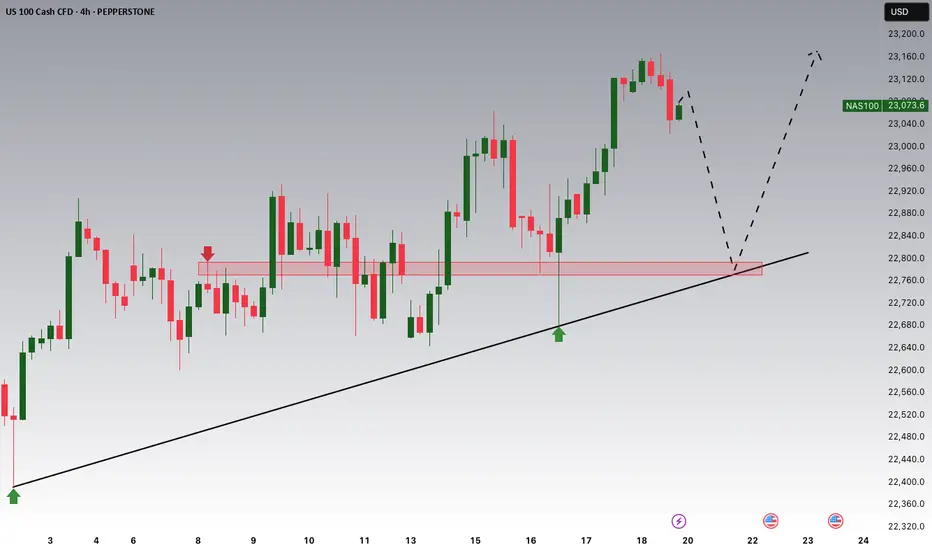
NASDAQ Potential UpsidesHey Traders, in tomorrow's trading session we are monitoring NAS100 for a buying opportunity around 22,780 zone, NASDAQ is trading in an uptrend and currently is in a correction phase in which it is approaching the trend at 22,780 support and resistance area.
Trade safe, Joe.
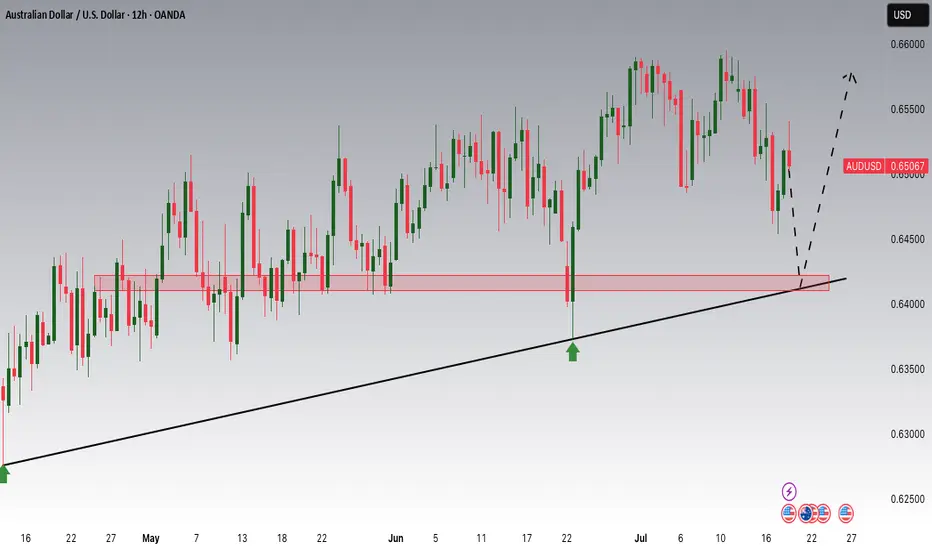
AUDUSD Potential UpsidesHey Traders, in tomorrow's trading session we are monitoring AUDUSD for a buying opportunity around 0.64200 zone, AUDUSD is trading in an uptrend and currently is in a correction phase in which it is approaching the trend at 0.64200 support and resistance area.
Trade safe, Joe.
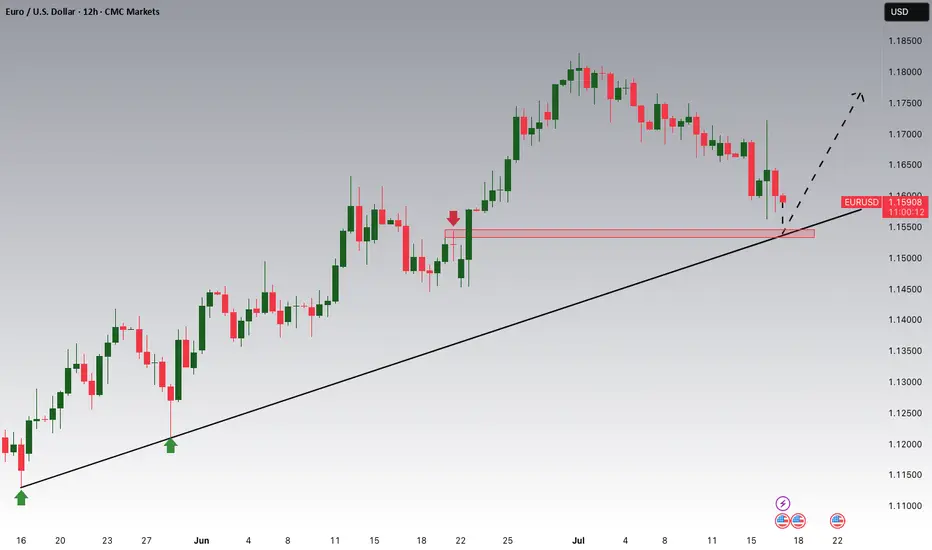
EURUSD is Nearing an Important Support!!Hey Traders, in today's trading session we are monitoring EURUSD for a buying opportunity around 1.15400 zone, EURUSD is trading in an uptrend and currently is in a correction phase is in a correction phase in which it is approaching the trend at 1.15400 support and resistance area.
Trade safe, Joe.
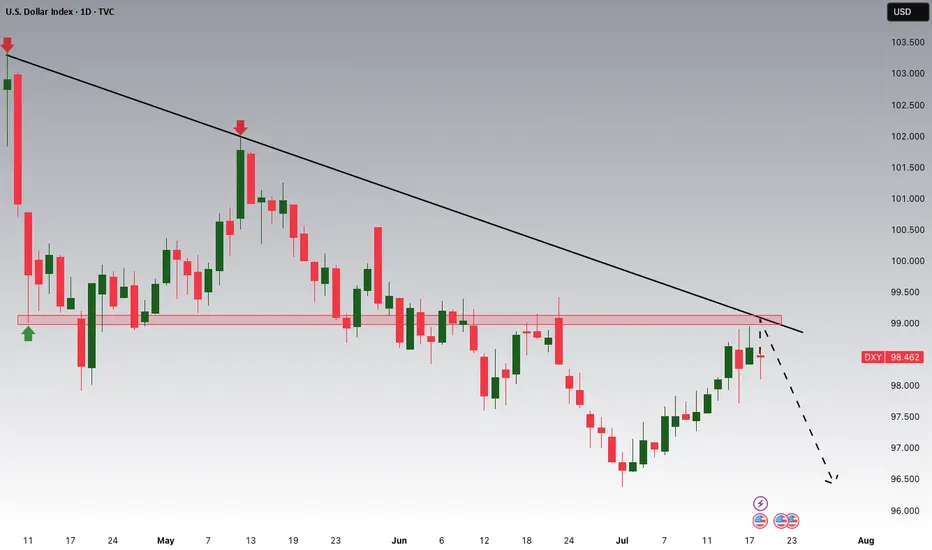
DXY Potential DownsidesHey Traders, in the coming week we are monitoring DXY for a selling opportunity around 99.000 zone, DXY is trading in a downtrend and currently is in a correction phase in which it is approaching the trend at 99.000 support and resistance area.
Trade safe, Joe.
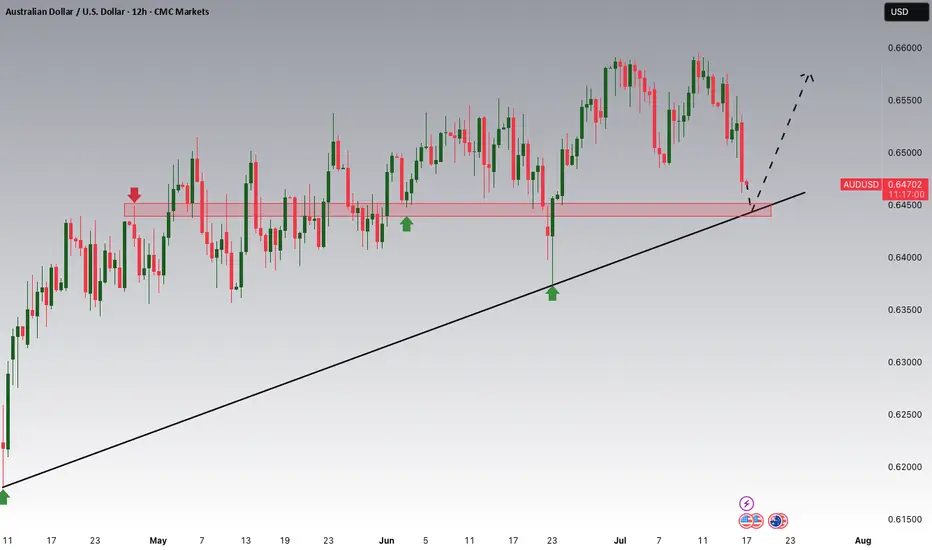
AUDUSD Potential UpsidesHey Traders, in today's trading session we are monitoring AUDUSD for a buying opportunity around 0.64500 zone, AUDUSD is trading in an uptrend and currently is in a correction phase in which it is approaching the trend at 0.64500 support and resistance area.
Trade safe, Joe.
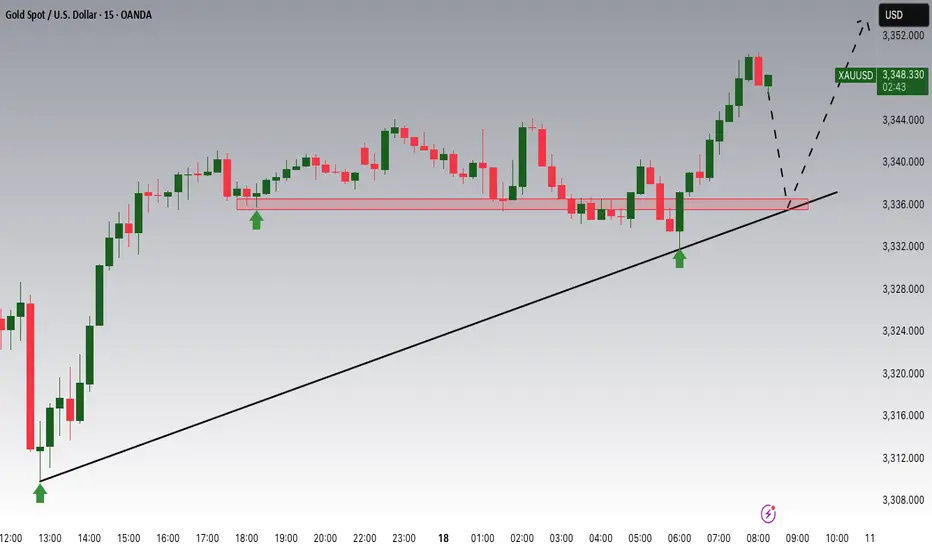
Gold Potential UpsidesHey Traders, in today's trading session we are monitoring XAUUSD for a buying opportunity around 3,336 zone, Gold is trading in an uptrend and currently is in a correction phase in which it is approaching the trend at 3,336 support and resistance area.
Trade safe, Joe.
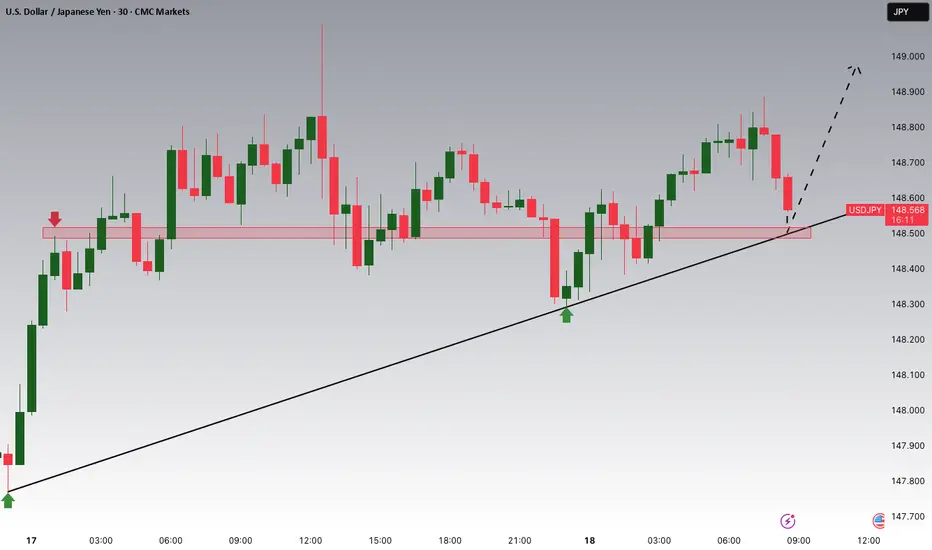
USDJPY Potential UpsidesHey Traders, in today's trading session we are monitoring USDJPY for a buying opportunity around 148.500 zone, USDJPY for a buying opportunity around 148.500 zone, USDJPY is trading in an uptrend and currently is in a correction phase in which it is approaching the trend at 148.500 support and resistance area.
Trade safe, Joe.
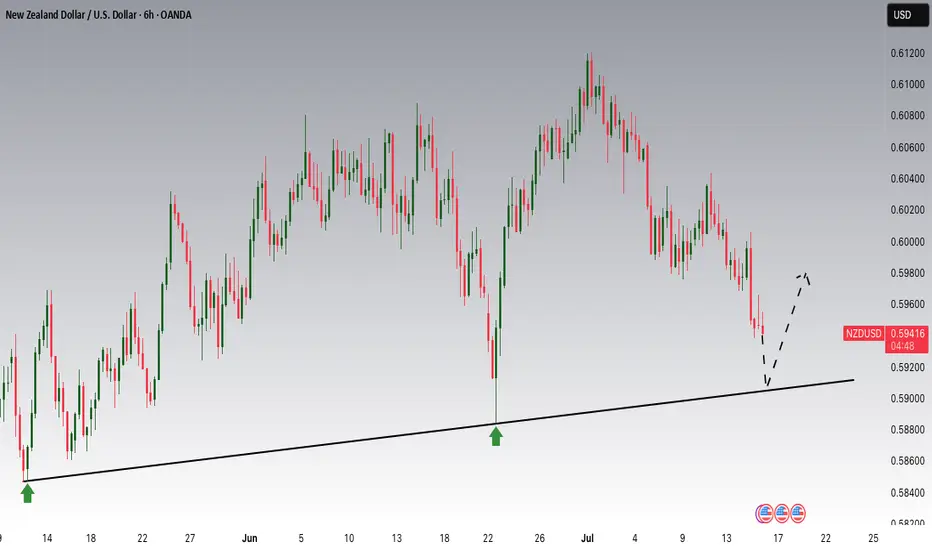
NZDUSD is Nearing an Important SupportHey Traders, in today's trading session we are monitoring NZDUSD for a buying opportunity around 0.59100 zone, NZDUSD is trading in an uptrend and currently is in a correction phase in which it is approaching the trend at 0.59100 support and resistance area.
Trade safe, Joe.