The 50/50 Account Management Scam- How it WorksFrom Cold Calling to Telegram
I’ve been in the markets for so long I feel like a dinosaur, and I’ve probably seen every scam out there.
The truth is, none of them are really new — they’re just adapted to the new social paradigm.
What was done in the 2000s through cold calling is now done through Telegram, Instagram, X, and other social platforms.
I didn’t really want to write this article, in case it gave someone ideas.
But since anyone who wants to be a scammer already knows how it works, maybe this article can warn those who still have no idea how the so-called account management scam operates — especially its most common form: the coin flip scam (50/50 scam, Opposite trades scam, Split-direction scam, Two-group margin call trick, as is also known)
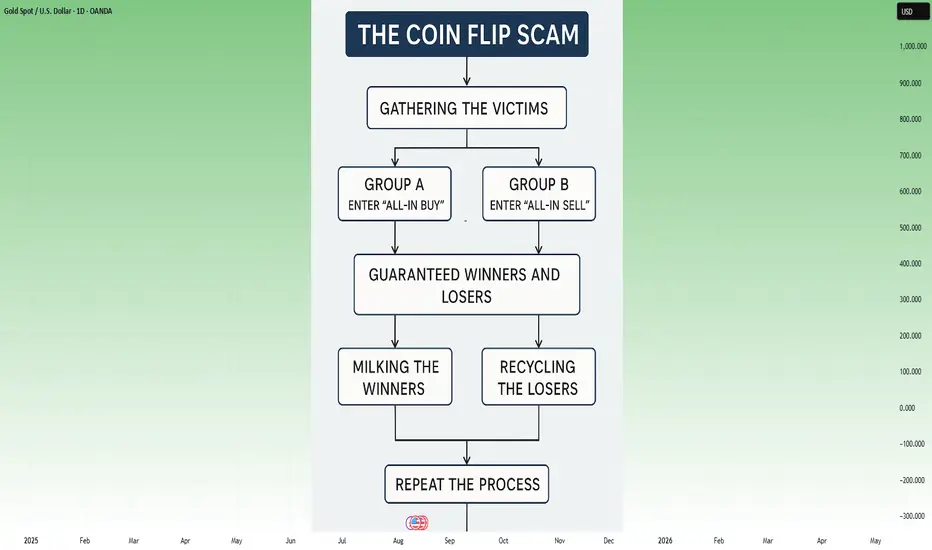
Step-by-Step: How the Coin Flip Scam Works
1. Gathering the victims
The scammer starts by fishing for victims through Telegram channels/groups, Instagram profiles, Facebook groups, or even X posts.
They present fabulous profits, post ads with guaranteed return offers, and flood the feed with so-called “proofs” — screenshots of winning trades, client testimonials, and account statements. Most of these are either fabricated or selectively chosen to show only the winning side.
Once someone shows interest, the scammer’s first move is to earn their trust.
They’ll tell you the broker doesn’t matter, that you can choose it, and that they have no access to your money — which is, technically, true.
Then comes the closer:
“You don’t have to pay me upfront. I only get paid if I make you money, so it’s in my best interest not to lose. You see? We’re on the same side.”
This combination of flashy results and “risk-free” terms makes you feel safe enough to hand them trading access.
________________________________________
2. Splitting into two groups
The accounts are divided into two equal batches:
• Group A → All-in BUY
• Group B → All-in SELL
With high leverage (e.g., 1:200), a 50-pip move means either doubling the account or wiping it out completely.
Note: I won’t go too deep into the details here, because the exact margin call level depends on the broker. But trust me, it’s easy for a scammer to plan the money split based on the different brokers’ rules. What we’re talking about here is just the general principle.
________________________________________
3. Guaranteed winners and losers
The market moves.
One group hits margin call and loses, while the other doubles or triples its capital (depending on broker's leverage, even more on 1:500).
The scammer now has perfect marketing material: “Look how I doubled my client’s account!”
________________________________________
4. Milking the winners
Clients who made a profit are celebrated and told something like:
“I only worked with low capital this time just to show you I can do it. I have big clients and serious strategies — now that you’ve seen the proof, deposit more so we can make real money.”
The scammer frames the initial gain as a “demo run” to gain the client’s confidence, pushing them to commit much larger sums next.
________________________________________
5. Recycling the losers
The wiped-out clients are told:
“It was an unusual market move. Deposit another $1,000 and we’ll recover it tomorrow.”
Some quit, but others fall for it again.
________________________________________
6. Repeat the process
The cycle continues. There’s always a “happy” group and real account statements to attract fresh victims, while the losers are quietly discarded or convinced to reinvest.
________________________________________
Why the scam works
• The proof are authentic – Screenshots and MT4/MT5 statements for the winners are real.
• Survivorship bias – Prospects only see the successes, never the failures.
• Hope psychology – Losers believe “next time” will be different (and it can be if they end up in the "winner group" next time
________________________________________
Final word
If someone promises to double your account quickly and safely — walk away.
Real trading is about risk management and long-term consistency, not betting your capital on a 50/50 gamble.
Don’t be the next screenshot in a scammer’s sales pitch. 🚀
P.S.
Stop believing they “made you money on purpose” at the beginning and then “lost it on purpose” after you deposited more.
If they truly had the skill to do that, they wouldn’t need to be scammers in the first place.
The reality is simple — once you put in more money, you just happened to land on the losing side of their scam.
Accountmanager
Retest of New Highs and Pullback Zone✨ By MJTrading:
Chart Overview:
AUDUSD reached a 2025 new high around 0.65600 before pulling back sharply. Price broke out of a consolidation wedge and is now retesting the prior breakout and dynamic support area.
🔹 Key Points:
Structure: Clear impulse move to new highs, followed by corrective pullback.
Support Zone: Blue box ~0.6480–0.6500 could act as a demand area if price extends lower.
EMAs: Price testing the 60 EMA (~0.6523) after losing short-term momentum.
Trade Setup:
Entry: 0.65250
SL: 0.65510
TP1: 0.65000
(Please Manage your Risk)( Ideal: 1% Per Trade)
Possible Scenarios:
Bullish reaction from current EMA support or the blue demand zone.
Deeper retracement if price fails to hold above 0.6500.
💡 Note:
This chart highlights how prior consolidation and breakout zones can offer potential retest entries in trending markets.
Thanks for your time an attention...
Follow for more setups.
#MJTrading
#AUDUSD #Forex #TechnicalAnalysis #PriceAction #BreakoutTrading #SupportResistance #TradingView #FX

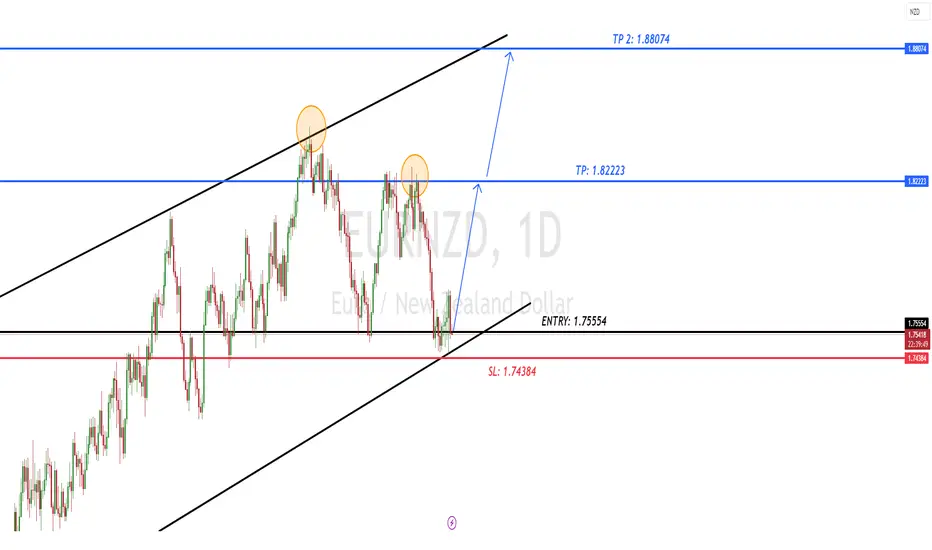
EURNZD Buy/Long SignalEURNZD looks like a clear indicator on the daily for a nice day trade/swing trade set up. It has bullish momentum potential since the supporting trendline indicates a set up for a swing upward for the next few weeks. Please look below for a full breakdown analysis of EURNZD and any pairs you may request for us to analyze. Thank you!
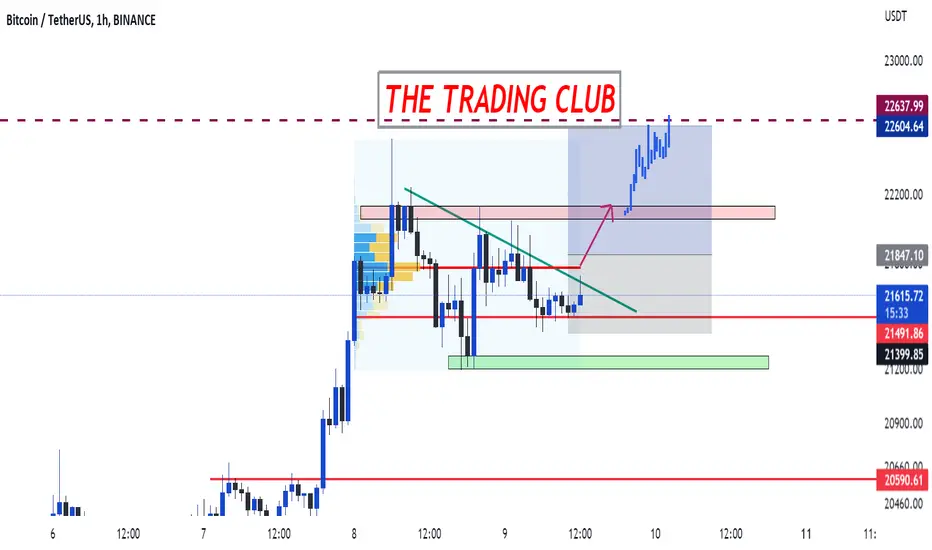
BTCUSD (BITCOIN)“Easy money” is having hard times as there still is no sign of reversal in favor of Bitcoin, but 20k seems to be acting as a psychological barrier in selling.
Market Structure:
After collapse in #btc price 3JULY price hits low of 18763$ now we see some buyer strength and they push price towards 15june high 22662$. here we see bullish pannet structure in the market which shows bulls profit booking here at 21681$.
NEXT MOVE
Here you can see green trendline resistance after breakout of resistance and and also POC volume profile. Volume is also high at current price. Breakout helps bulls to push price towards the TARGETS OF 22114$, 22604 & 25K Psycological level.
STOPLOSS :21200$
FUNDAMENTALS
Taking advantage of low prices, investors are increasing their Bitcoin holdings. According to data by crypto intelligence firm Glassnode, both Bitcoin shrimps (those who own less than one BTC) and Bitcoin whales (those who own more than 1,000 BTC) are stacking more BTC.
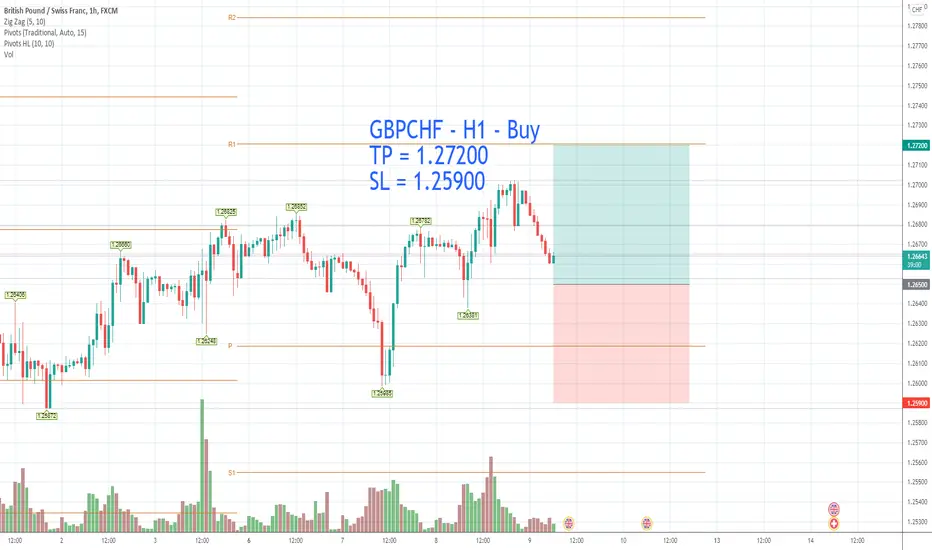
GBPCHF - H1 - Buy TP = 1.27200 SL = 1.25900GBPCHF - H1 - Buy
TP = 1.27200
SL = 1.25900
Daily is...
The RSI is above 50.
The MACD is negative and above its signal line.
The MACD must break above its zero level to trigger further gains.
Moreover, the price is trading above both its 20 and 50 period moving average (respectively at 1.2608 and 1.2642).
Please like and follow
GBPCAD - H1 - Buy TP = 1.75400 SL = 1.73600GBPCAD - H1 - Buy
TP = 1.75400
SL = 1.73600
The RSI is above 50.
The MACD is above its signal line and positive.
The configuration is positive.
Moreover, the price is above its 20 and 50 period moving average (respectively at 1.7425 and 1.7409).
Please Like and Follow

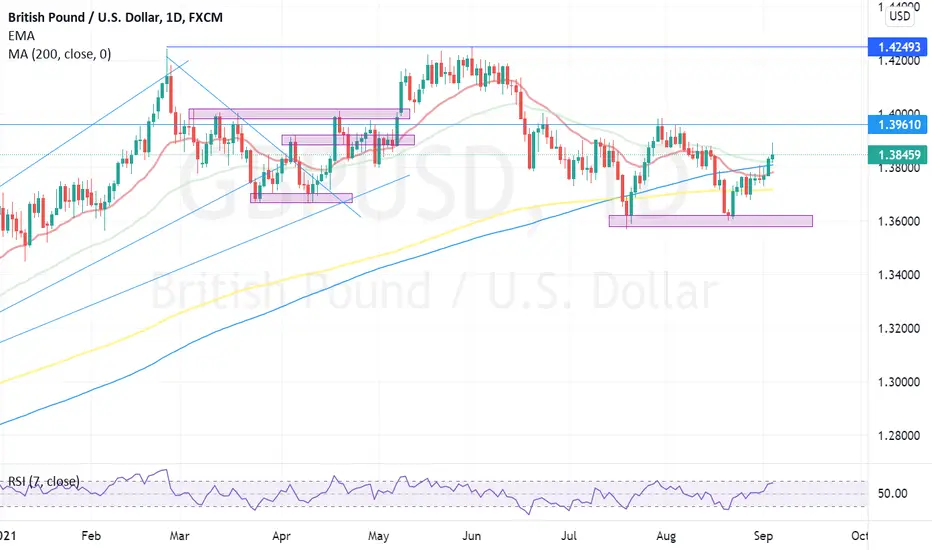
GBPUSDAs week NFP report, double bottom recently in D1.moving above 200EMA.recamnded to go long for this pair after little bit retest
Good Luck
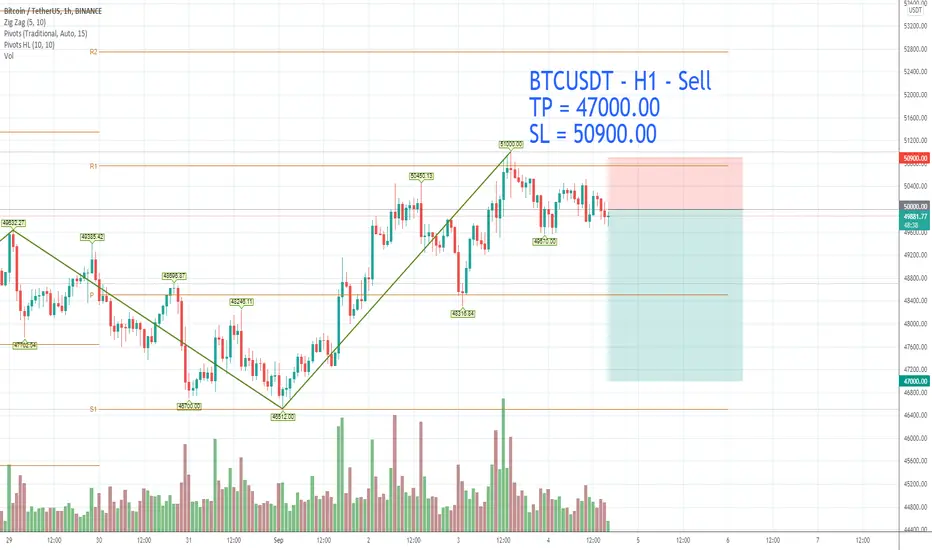
BTCUSDT - H1 - Sell TP = 47000.00 SL = 50900.00BTCUSDT - H1 - Sell
TP = 47000.00
SL = 50900.00
Bitcoin (BTC) capitalized on fresh strength of its own on September 3rd, rallying to highs of $51,064.
Bulls ran a rampage across the cryptocurrency market as most Altcoins sustained their earlier rally.
For instance, the second-largest cryptocurrency, Ethereum (ETH) returned past $4,000 on Sept. 3 for the first time since May.
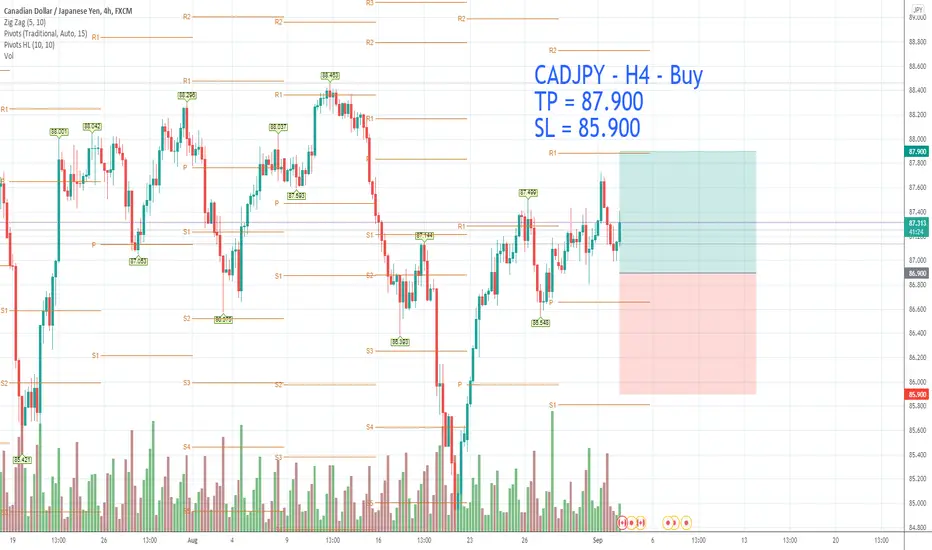
CADJPY - H4 - Buy TP = 87.900 SL = 85.900CADJPY - H4 - Buy
TP = 87.900
SL = 85.900
The RSI is below 50.
The MACD is negative and above its signal line.
The configuration is mixed.
Moreover, the price is trading above its 20 period moving average (87.18) but under its 50 period moving average (87.87).
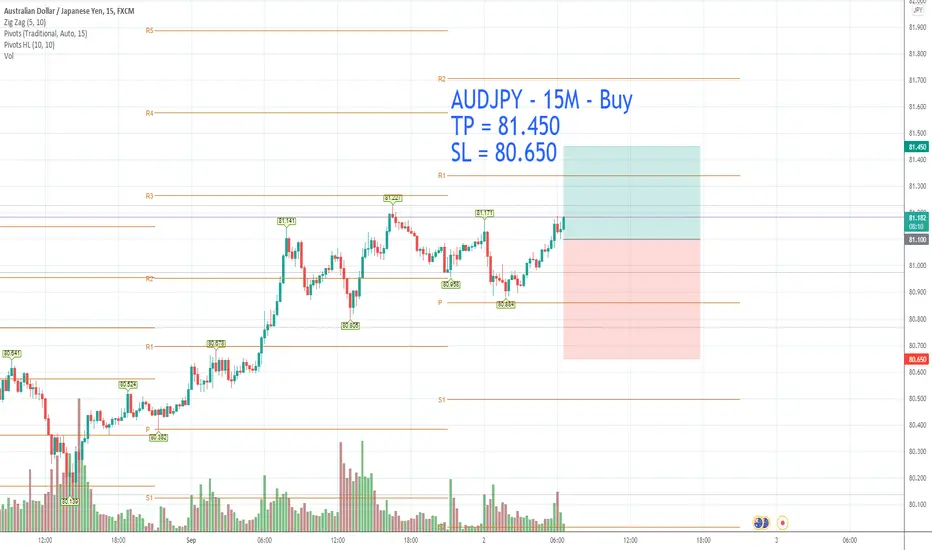
AUDJPY - 15M - Buy TP = 81.450 SL = 80.650AUDJPY - 15M - Buy
TP = 81.450
SL = 80.650
The RSI is above 50.
The MACD is below its signal line and negative.
The penetration of 50 on the RSI should trigger further losses.
Moreover, the price is above its 20 and 50 period moving average (respectively at 81.01 and 80.97).
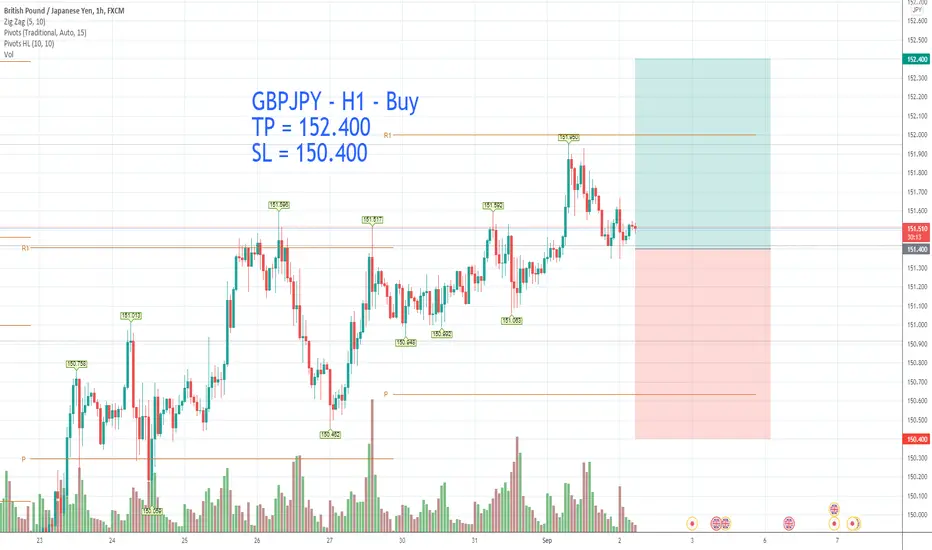
GBPJPY - H1 - Buy TP = 152.400 SL = 150.400GBPJPY - H1 - Buy
TP = 152.400
SL = 150.400
The RSI is below its neutrality area at 50.
The MACD is negative and above its signal line.
The configuration is mixed.
Moreover, the price stands above its 20 period moving average (151.49) but below its 50 period moving average (151.58).
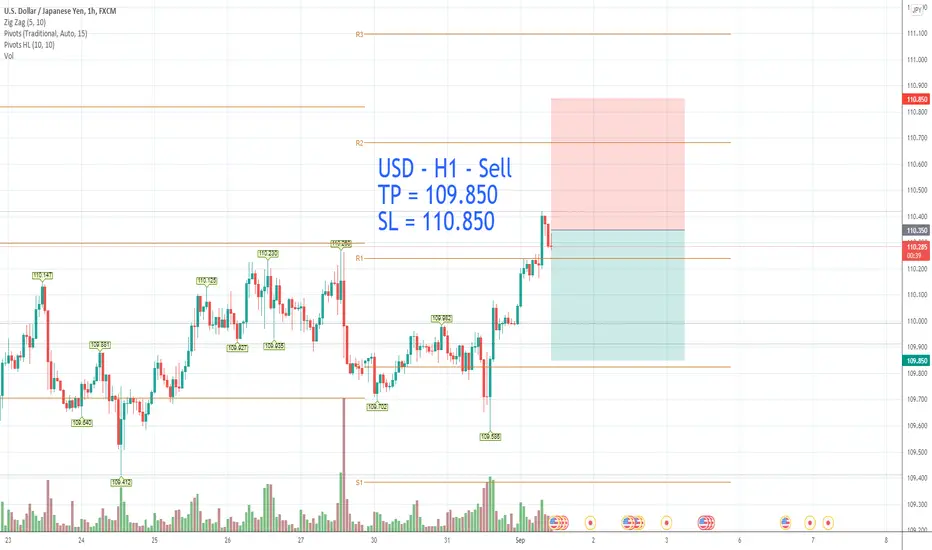
USDJPY - H1 - Sell TP = 109.850 SL = 110.850USDJPY - H1 - Sell
TP = 109.850
SL = 110.850
Below 110.10 look for further downside with 109.95 & 109.85 as targets.
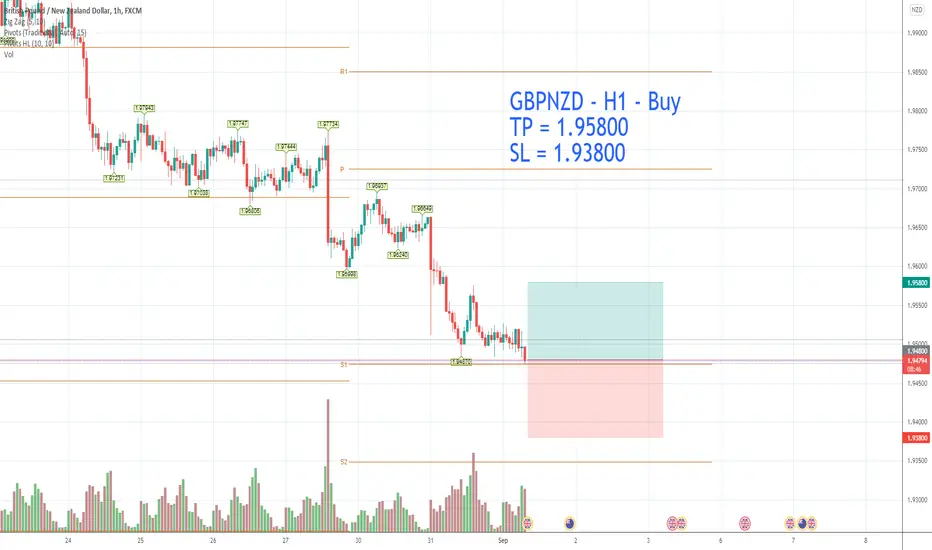
GBPNZD - H1 - Buy TP = 1.95800 SL = 1.93800GBPNZD - H1 - Buy
TP = 1.95800
SL = 1.93800
The RSI is below 50.
The MACD is above its signal line and negative.
The configuration is mixed.
Moreover, the price is trading under both its 20 and 50 period moving average (respectively at 1.9524 and 1.9558).