CPOOLUSDT Daily Chart Analysis | Momentum Surge & Key TargetsCPOOLUSDT Daily Chart Analysis | Momentum Surge & Key Targets
🔍 Let’s dive into the CPOOL/USDT 1D chart and break down the latest price action that’s catching attention, with an eye on bullish setups and critical zones.
⏳ Daily Overview
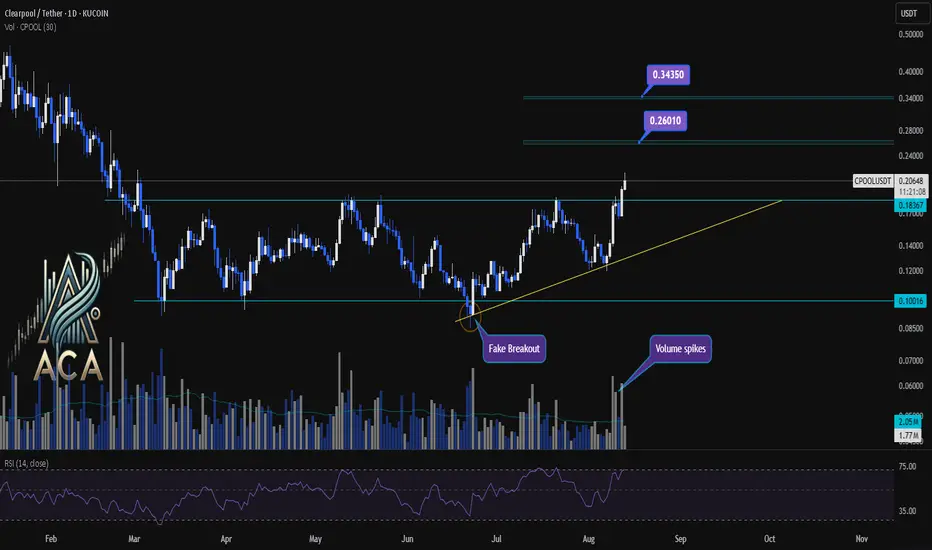
The chart shows a dynamic breakout above the accumulation box (range), with price riding a clear yellow trendline and volume spiking hard — classic momentum signals. RSI is entering the overbought zone, which confirms surging buying interest and the possibility for rapid moves.
🔺 Long Setup:
- The breakout from the range box suggests accumulation and fresh interest. Immediate upside looks at the mid-range target of $0.26010.
- Next, if momentum holds, price could rally towards $0.34350, which lines up with the risk-reward (RR1) from the box.
- Sustained momentum and continued volume spikes could unlock even higher targets beyond these levels.
📊 Key Highlights:
- Yellow trendline supports the move, tracking bullish sentiment.
- Volume spikes show real participation — this isn’t a low-liquidity fakeout.
- RSI entering the overbought zone is a momentum engine, but keep an eye out for possible pullbacks or cooling periods as price tests higher levels.
- Fake breakout earlier in the range now confirmed by the strong candle and volume surge.
🚨 Conclusion:
Momentum is accelerating. If buyers stay in control above current support, price could climb to the mid-box target of $0.26010, with $0.34350 as the next bullish destination. This setup favors longs as long as volume and trendline support remain intact. Aggressive momentum could push price even further — time to watch those critical resistance levels.
Accumalation
ROSE in Key Accumulation Zone: Reversal on the HorizonLSE:ROSE is trading within a key Accumulation Zone around $0.04, overlapping with a strong demand area that has historically triggered price recoveries.
> $0.035–$0.045 remains a critical demand zone, attracting buyers.
> A bounce from this zone could target resistance levels of $0.07–$0.08.
> RSI is near oversold conditions, hinting at weakening selling pressure.
If ROSE holds above this support, a bullish reversal is likely. A breakdown below could lead to further downside.
DYOR, NFA

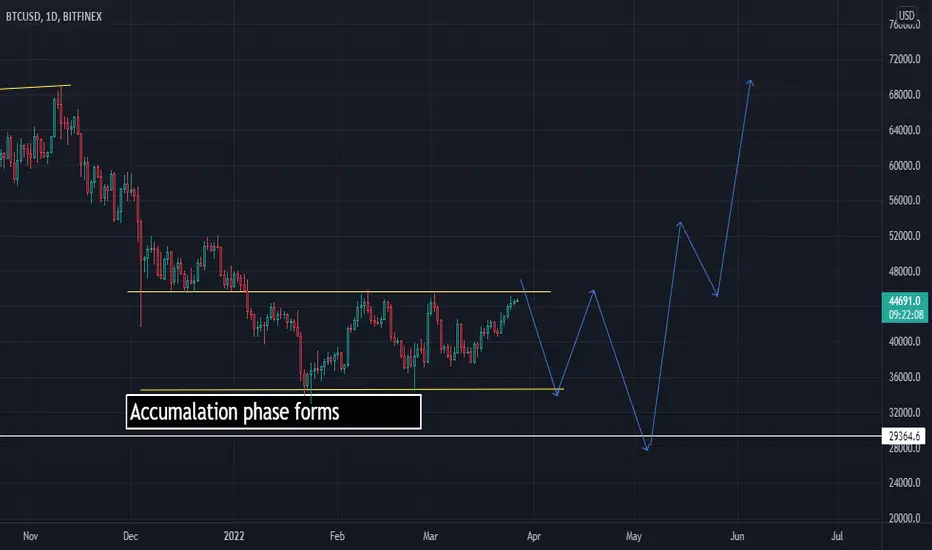
Will BTCUSD strenghen in the future?
Good day guys and girls. This is my analysis for BTCUSD. As we can see the consolidation of price is happening and still forming. There is a possibility this not going to happen, depends on any bad or good news about Bitcoin coming out. If breaks the last support line(white line), then we can wait for confirmation that the sellers power are lessening by the minute, for a strong buy signal.
Enjoy and good look guys