ACE/USDT Testing Long-Term Downtrend – Will It Break Out?Chart Overview:
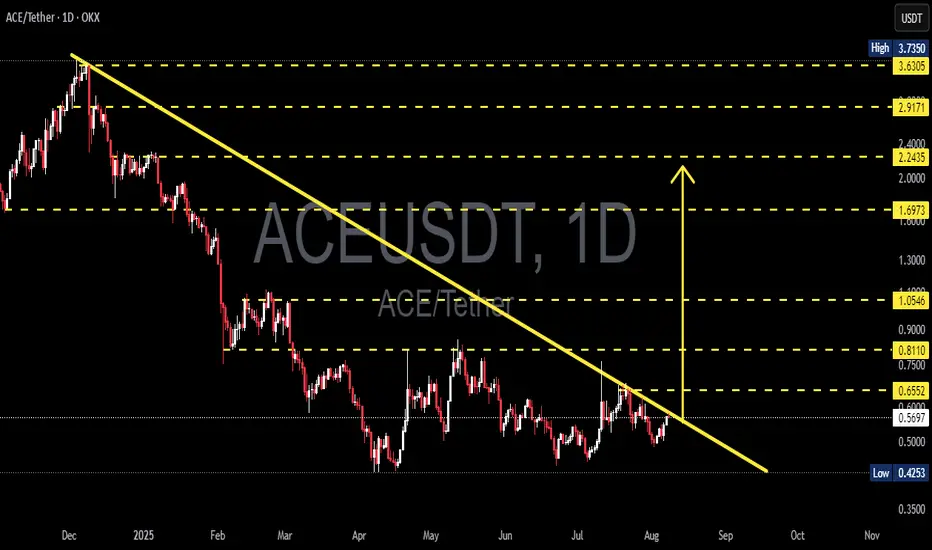
The ACE/USDT pair on the 1D (Daily) timeframe is currently in a prolonged downtrend that has persisted since early 2025. The price has consistently formed lower highs, and it's been contained under a well-respected descending trendline (yellow line).
Currently, ACE is approaching a key decision point near the trendline resistance zone ($0.57–$0.60). What happens at this level will likely determine the next major move.
---
🟢 Bullish Scenario: Breakout Ahead?
If the price successfully breaks above the descending trendline and confirms with a daily close above $0.6552, we could see a trend reversal from bearish to bullish. Key resistance levels to watch for potential upside targets are:
1. $0.8110 – psychological and structural resistance
2. $1.0546 – strong previous resistance
3. $1.6973 – mid-term bullish target
4. $2.2435 and $2.9171 – extended bullish targets if momentum continues
Confirmation should be supported by increasing volume and RSI breaking above 50.
---
🔴 Bearish Scenario: Another Rejection?
If the price fails to break the trendline and gets rejected, ACE/USDT may resume its downward trajectory and test the following support levels:
1. $0.5691 – immediate support
2. $0.5000 – psychological support
3. $0.4253 – historical low and potential demand zone
This scenario would reaffirm continued bearish dominance and prolong the current downtrend.
---
📊 Pattern Analysis: Descending Trendline
The dominant pattern here is a descending resistance trendline, showing clear selling pressure and bearish market structure.
A breakout would signal the first major higher high in months – a potential trend reversal signal.
---
🎯 Conclusion & Strategy:
ACE is at a crucial inflection point.
Traders should wait for confirmation before entering a breakout trade.
If a breakout occurs, consider a buy-the-breakout strategy with a stop-loss below the trendline.
If rejected, a short/rejection play toward lower support zones could be viable.
#ACEUSDT #CryptoAnalysis #Altcoins #TechnicalAnalysis #BreakoutTrade #BearishScenario #BullishScenario #DescendingTrendline
Aceanalysis
ACE/USDT – Breaking Out of the Falling Wedge? Potential Reversal📝 Technical Analysis Overview:
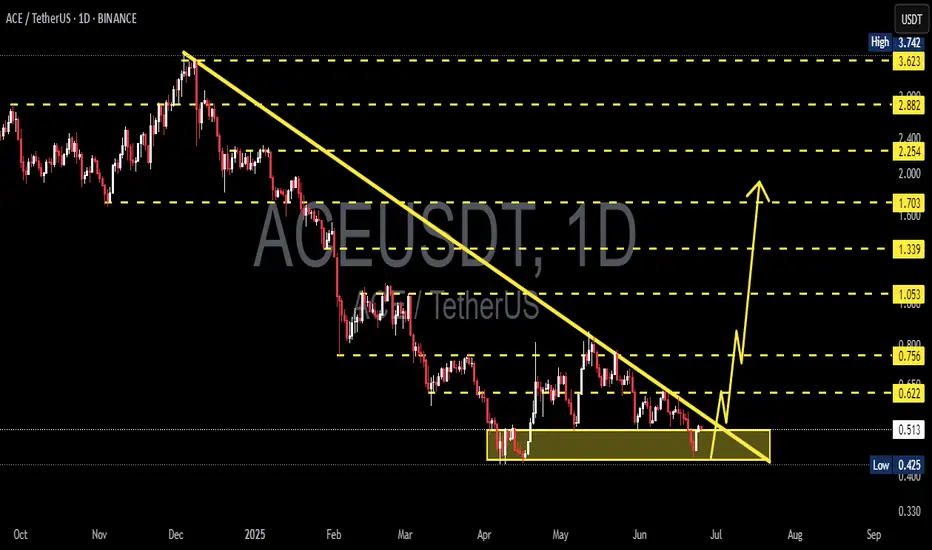
The ACE/USDT pair on the daily timeframe (1D – Binance) is showing signs of a potential breakout from a long-standing falling wedge pattern, suggesting a possible trend reversal to the upside.
🔍 Key Technical Highlights:
1. Falling Wedge Pattern:
A clearly defined falling wedge has formed from the December 2024 peak near $3.742, down to the current consolidation zone between $0.425–$0.514.
This yellow support box represents a strong demand zone, with repeated price reactions since April 2025.
2. Major Support and Resistance Levels:
Strong Support: $0.425 – $0.514 (accumulation zone)
Potential Resistance / Upside Targets:
$0.622
$0.756
$1.053
$1.339
$1.703
$2.254
$2.882
$3.623 (just below the previous high at $3.742)
3. Bullish Breakout Scenario:
A confirmed breakout above the descending trendline and resistance at $0.622 could trigger a bullish move toward higher targets.
The first key breakout confirmation would be a daily close above $0.756 with increasing volume.
4. Early Signals & Validation:
A breakout with strong momentum followed by a successful retest of the trendline would validate the bullish setup.
Watch for high volume and candle structure during the breakout phase to avoid fakeouts.
📌 Summary:
ACE is currently testing the final stage of a bullish falling wedge. A successful breakout could lead to a strong trend reversal with targets beyond $1.0 and higher. This setup offers a good risk/reward opportunity for bullish traders—confirmation is key.
ACEUSDT 1D AnalysisACE ~ 1D Analysis
#ACE is attempting to break through this resistance line. A full-body candle close above this resistance line will confirm a continued bullish trend with a minimum target of 10%+.

ACE (SPOT - INVEST )BINANCE:ACEUSDT
ACE / USDT
(4H + 1D) time frames
analysis tools
____________
SMC
FVG
Trend lines
Fibonacci
Support & resistance
MACD Cross
EMA Cross
______________________________________________________________
Golden Advices.
********************
* Please calculate your losses before any entry.
* Do not enter any trade you find it not suitable for you.
* No FOMO - No Rush , it is a long journey.
Useful Tags.
****************
My total posts
tradingview.sweetlogin.com

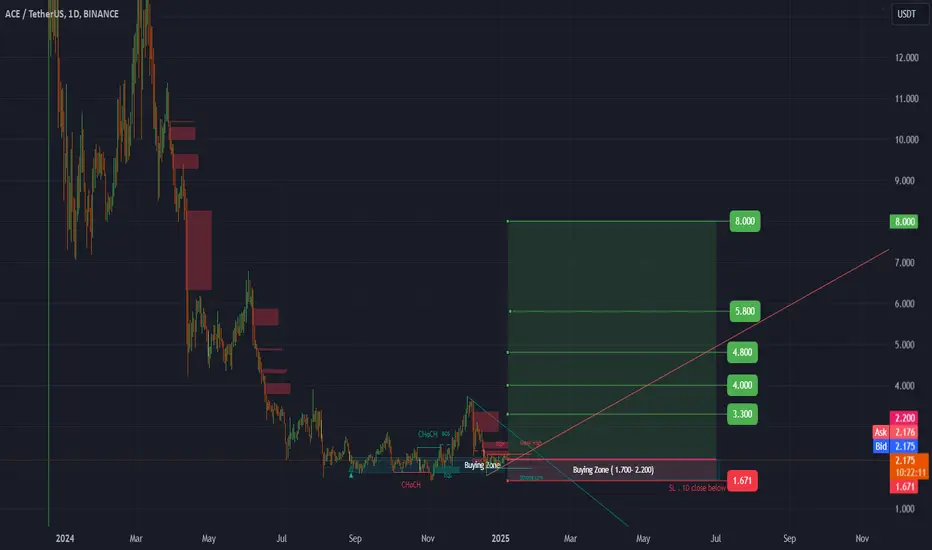
#ACE (SPOT) IN ( 1.700- 2.200) T.(8.000) SL(1.671)BINANCE:ACEUSDT
#ACE / USDT
Entry( 1.700- 2.200)
SL 1D close below 1.671
T1 3.300
T2 4.000
T3 4.800
T4 5.800
T5 8.000
______________________________________________________________
Golden Advices.
********************
* collect the coin slowly in the entry range.
* Please calculate your losses before the entry.
* Do not enter any trade you find it not suitable for you.
* No FOMO - No Rush , it is a long journey.
Useful Tags.
****************
My total posts
tradingview.sweetlogin.com
**********************************************************************************************
#Manta #OMNI #DYM #AI #IO #XAI #ACE #NFP #RAD #WLD #ORDI #BLUR #SUI #VOXEL #AEVO #VITE #APE #RDNT #FLUX #NMR #VANRY #TRB #HBAR #DGB #XEC #ERN #ALT #IO #ACA #HIVE #ASTR #ARDR #PIXEL #LTO #AERGO #SCRT #ATA #HOOK #FLOW #KSM #HFT #MINA #DATA #SC #JOE #RDNT #IQ #CFX #BICO #CTSI #KMD #FXS #DEGO #FORTH #AST #PORTAL #CYBER #RIF #ENJ #ZIL #APT #GALA #STEEM #ONE #LINK #NTRN #COTI #RENDER #ICX #IMX #ALICE #PYR #PORTAL #GRT #GMT #IDEX #NEAR #ICP #ETH #QTUM #VET #QNT #API3 #BURGER #MOVR #SKL #BAND #ETHFI #SAND #IOTX #T #GTC #PDA #GMX #REZ #DUSK #BNX #SPELL #POWR #JOE #TIA #TFUEL #HOT #AVAX #WAXP #OGN #AXS #GALA #ONE #SYS #SCRT #DGB #LIT #QI #FIL