ACE/USDT Testing Long-Term Downtrend – Will It Break Out?Chart Overview:
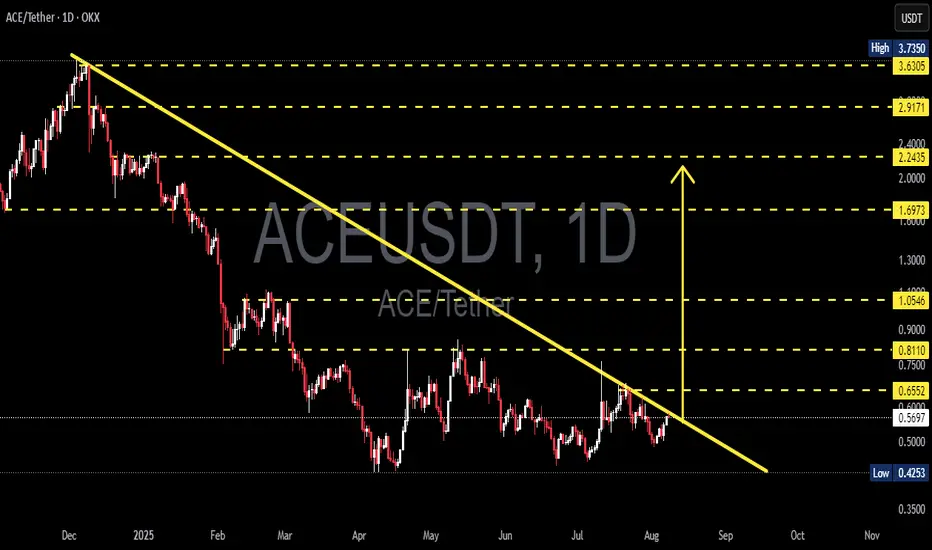
The ACE/USDT pair on the 1D (Daily) timeframe is currently in a prolonged downtrend that has persisted since early 2025. The price has consistently formed lower highs, and it's been contained under a well-respected descending trendline (yellow line).
Currently, ACE is approaching a key decision point near the trendline resistance zone ($0.57–$0.60). What happens at this level will likely determine the next major move.
---
🟢 Bullish Scenario: Breakout Ahead?
If the price successfully breaks above the descending trendline and confirms with a daily close above $0.6552, we could see a trend reversal from bearish to bullish. Key resistance levels to watch for potential upside targets are:
1. $0.8110 – psychological and structural resistance
2. $1.0546 – strong previous resistance
3. $1.6973 – mid-term bullish target
4. $2.2435 and $2.9171 – extended bullish targets if momentum continues
Confirmation should be supported by increasing volume and RSI breaking above 50.
---
🔴 Bearish Scenario: Another Rejection?
If the price fails to break the trendline and gets rejected, ACE/USDT may resume its downward trajectory and test the following support levels:
1. $0.5691 – immediate support
2. $0.5000 – psychological support
3. $0.4253 – historical low and potential demand zone
This scenario would reaffirm continued bearish dominance and prolong the current downtrend.
---
📊 Pattern Analysis: Descending Trendline
The dominant pattern here is a descending resistance trendline, showing clear selling pressure and bearish market structure.
A breakout would signal the first major higher high in months – a potential trend reversal signal.
---
🎯 Conclusion & Strategy:
ACE is at a crucial inflection point.
Traders should wait for confirmation before entering a breakout trade.
If a breakout occurs, consider a buy-the-breakout strategy with a stop-loss below the trendline.
If rejected, a short/rejection play toward lower support zones could be viable.
#ACEUSDT #CryptoAnalysis #Altcoins #TechnicalAnalysis #BreakoutTrade #BearishScenario #BullishScenario #DescendingTrendline
Aceusdtbuy
ACE/USDT – Breaking Out of the Falling Wedge? Potential Reversal📝 Technical Analysis Overview:
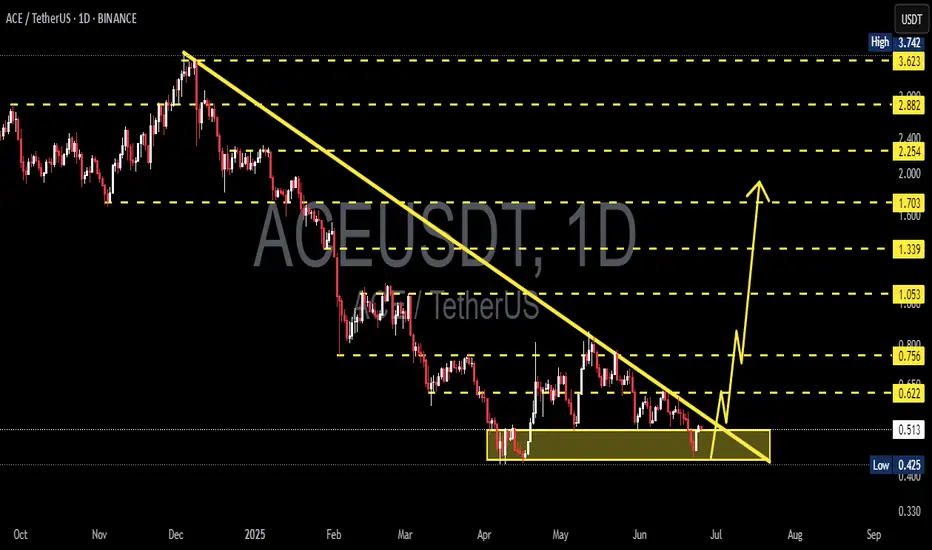
The ACE/USDT pair on the daily timeframe (1D – Binance) is showing signs of a potential breakout from a long-standing falling wedge pattern, suggesting a possible trend reversal to the upside.
🔍 Key Technical Highlights:
1. Falling Wedge Pattern:
A clearly defined falling wedge has formed from the December 2024 peak near $3.742, down to the current consolidation zone between $0.425–$0.514.
This yellow support box represents a strong demand zone, with repeated price reactions since April 2025.
2. Major Support and Resistance Levels:
Strong Support: $0.425 – $0.514 (accumulation zone)
Potential Resistance / Upside Targets:
$0.622
$0.756
$1.053
$1.339
$1.703
$2.254
$2.882
$3.623 (just below the previous high at $3.742)
3. Bullish Breakout Scenario:
A confirmed breakout above the descending trendline and resistance at $0.622 could trigger a bullish move toward higher targets.
The first key breakout confirmation would be a daily close above $0.756 with increasing volume.
4. Early Signals & Validation:
A breakout with strong momentum followed by a successful retest of the trendline would validate the bullish setup.
Watch for high volume and candle structure during the breakout phase to avoid fakeouts.
📌 Summary:
ACE is currently testing the final stage of a bullish falling wedge. A successful breakout could lead to a strong trend reversal with targets beyond $1.0 and higher. This setup offers a good risk/reward opportunity for bullish traders—confirmation is key.
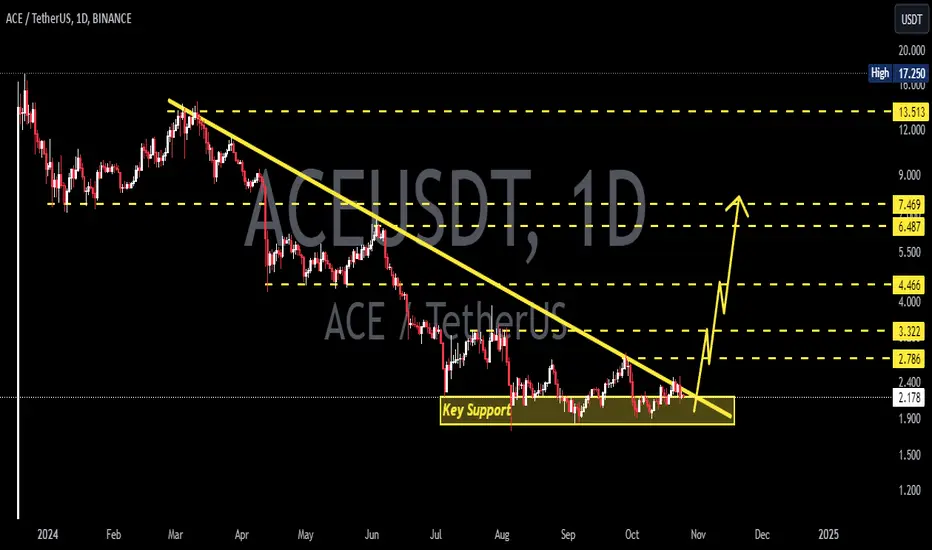
ACEUSDT 1D AnalysisACE ~ 1D Analysis
#ACE is attempting to break through this resistance line. A full-body candle close above this resistance line will confirm a continued bullish trend with a minimum target of 10%+.

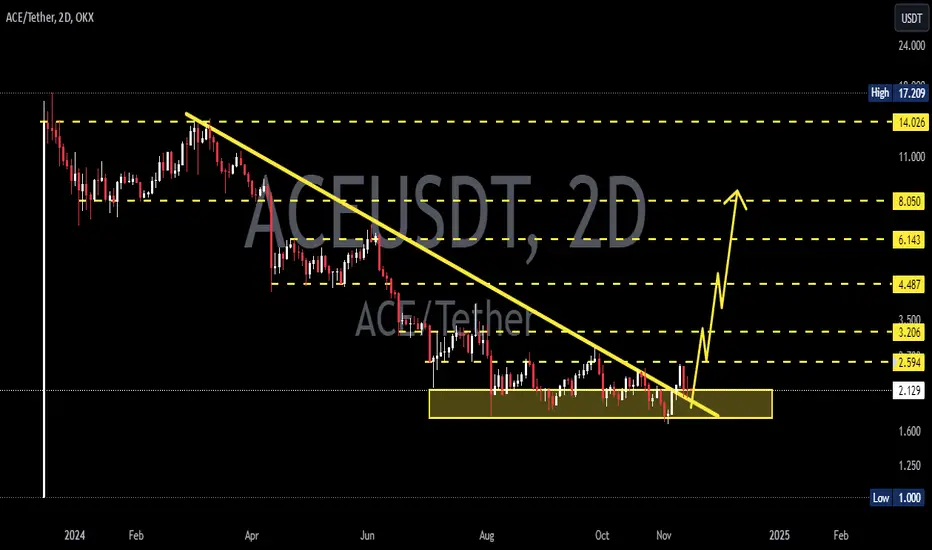
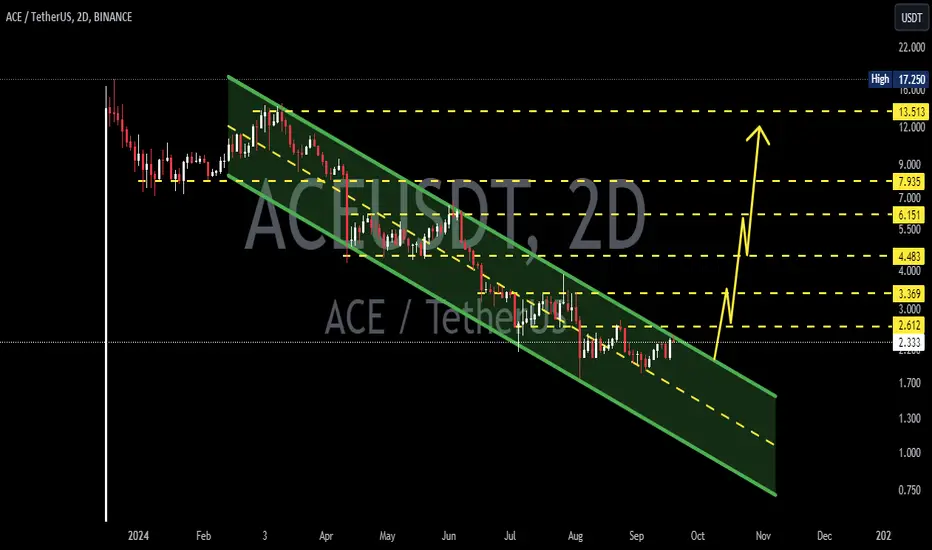
ACEUSDT 1WACE ~ 2D
#ACE Back to retesting this support block. So far this support block continues to keep the price from falling lower. If you still have Conviction on this coin,. This support block would be a very good buying place for now. with a target of 20%++
ACEUSDTACE ~ 1D
#ACE If you have Conviction on this coin,. This support block would be a very good buy for now.
ACEUSDTACE ~ 2D ✅
#ACE If you have Conviction on this coin,. You need to pay attention to this chart.
Make purchases gradually after breaking through the resistance line of this descending pattern.
ACEUSDT Ascending Triangle!ACEUSDt Technical analysis update
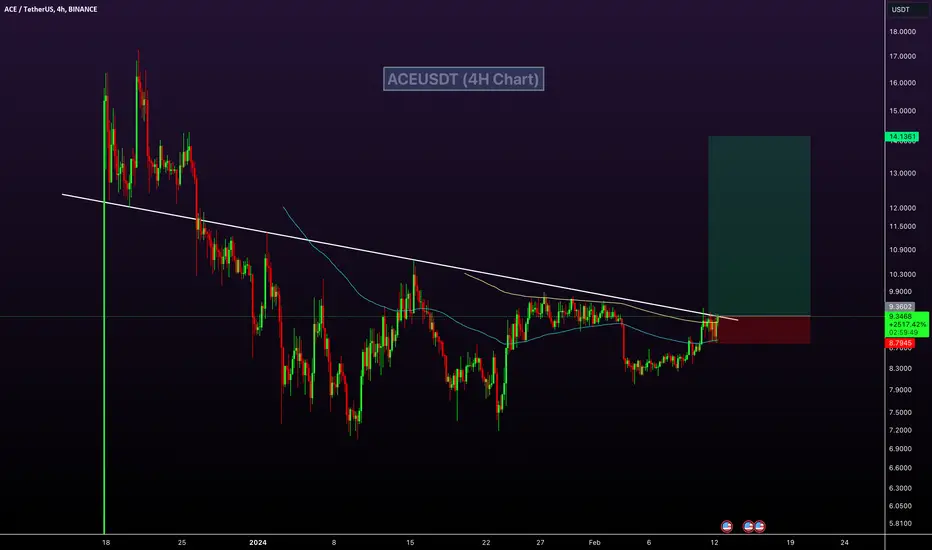
ACE formed an ascending triangle pattern on the 4-hour chart. The price recently exceeded the resistance zone of the triangle, which could indicate a potential bullish move.
Buy zone : Below $11.70
Stop loss : $11.00

ACEUSDT Resistance Breakout!ACEUSDT Technical analysis update
ACE price has broken through its trend resistance line and is currently trading above its 100 and 200-day EMAs. This could indicate a potential uptrend
Buy zone : Below $9.34
Stop loss : $8.75
Regards
Hexa