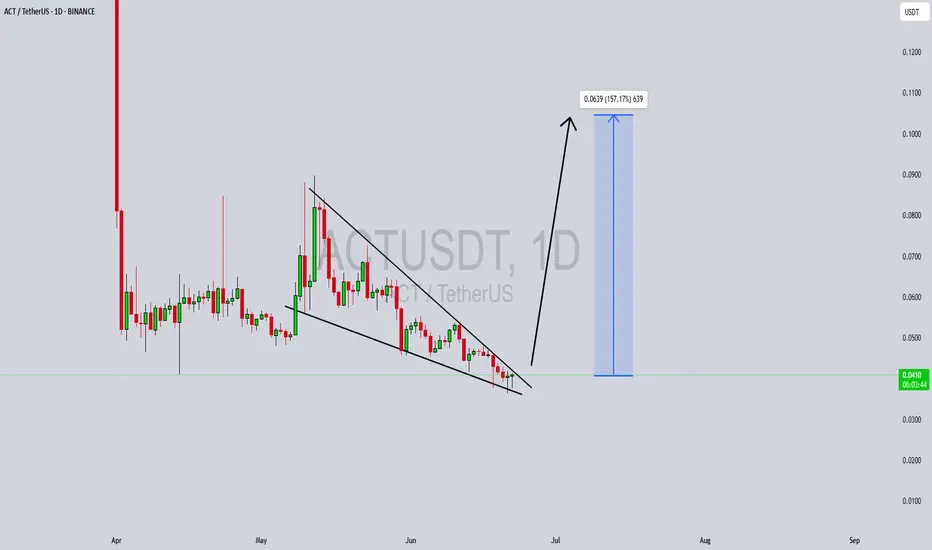
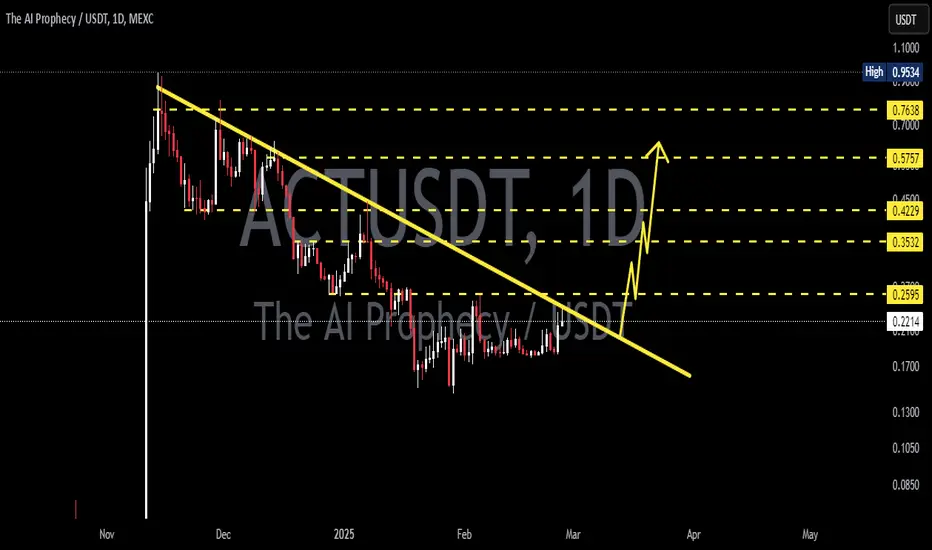
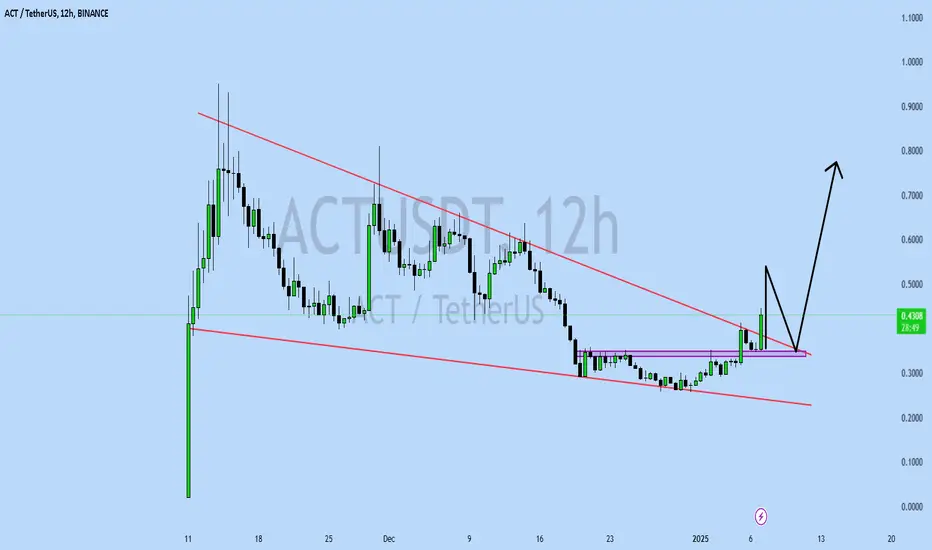
ACTUSDT Forming Classic Falling Wedge ACTUSDT is currently exhibiting a classic falling wedge pattern on the chart—a bullish reversal setup known for its high probability of a breakout to the upside. After a consistent downtrend, the price action has started to compress within converging trendlines, suggesting that selling pressure is diminishing. A breakout above the wedge's resistance line could trigger a sharp price surge. Technical traders often look to such formations for potential entries, especially when combined with growing volume and renewed market sentiment.
Volume analysis reveals a notable uptick in recent sessions, signaling that investors are beginning to accumulate ACTUSDT. This increased interest could be due to fundamental news or broader market momentum returning to altcoins. When volume expands near the apex of a falling wedge, it usually reinforces the validity of the pattern and strengthens the breakout potential. With this setup, the projected move points to a possible gain of 140% to 150%, aligning with previous key resistance levels that the price could retest post-breakout.
On a momentum front, indicators like RSI and MACD are starting to turn bullish, offering early signs of a reversal. The price is also holding above short-term support zones, suggesting the formation of a base. The combination of technical structure, volume dynamics, and improving sentiment makes ACTUSDT a strong contender for a breakout move in the near term. Such opportunities are especially attractive in trending markets where capital rotates quickly into coins showing strong chart setups.
Given this confluence of bullish signals, ACTUSDT could become a leading performer in the altcoin space over the coming weeks. Traders and investors are advised to keep a close watch for breakout confirmation and subsequent retest levels, which could offer optimal entry points for both short-term gains and medium-term swing setups.
✅ Show your support by hitting the like button and
✅ Leaving a comment below! (What is You opinion about this Coin)
Your feedback and engagement keep me inspired to share more insightful market analysis with you!
ACTUSDT
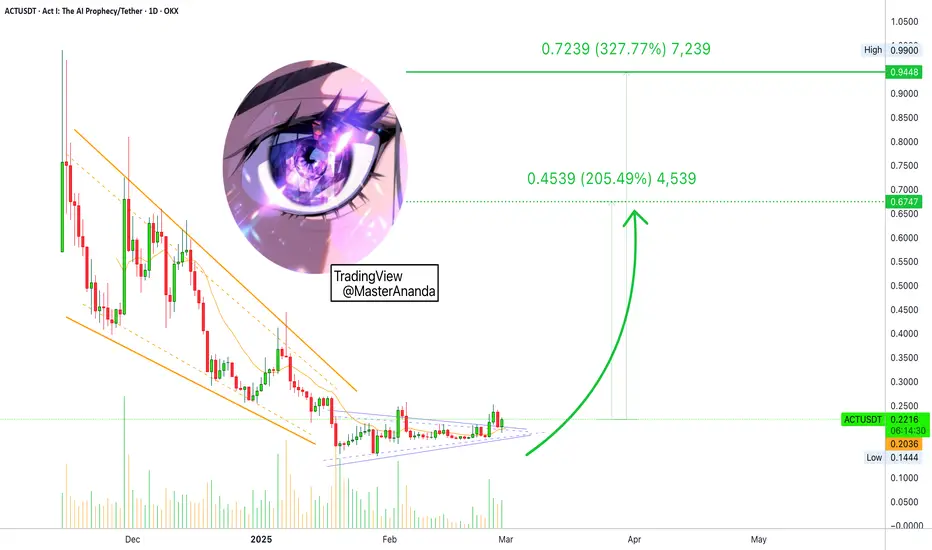
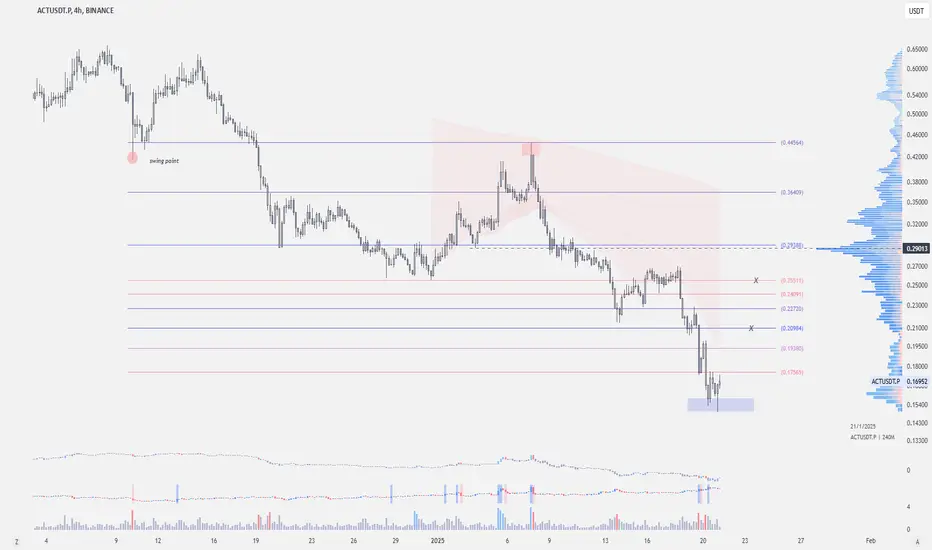
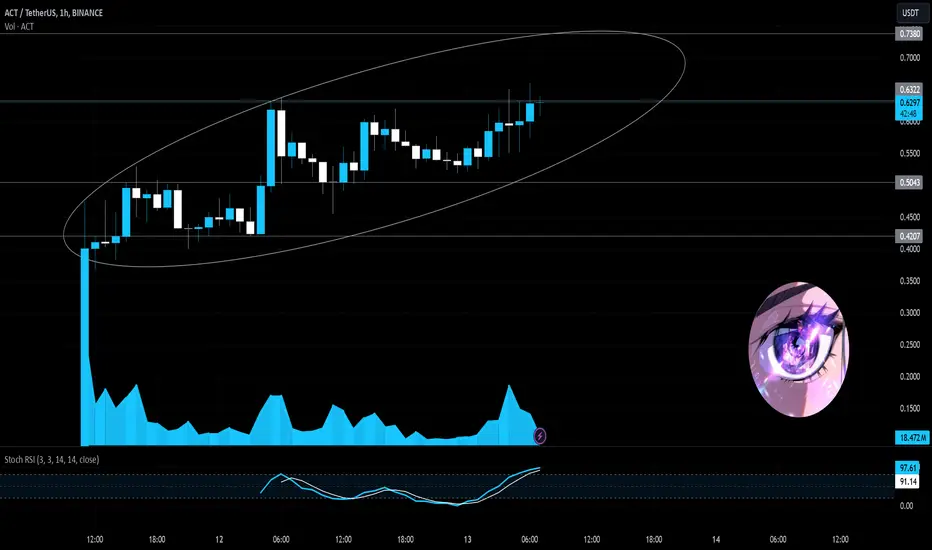
Public trade #5 - #ACT price analysis ( Act I: The AI Prophec )Nowadays, the #ACT coin is quite hype.
And most platforms display the OKX:ACTUSDT chart as circled above.
What do you think of this full price chart of #ACTUSDT presented by us?)
Scary, isn't it?)
👀 We are going to watch this asset for now #ActITheAIProphecy
And we would dare to buy not earlier than if the price falls into the Buy zone $0.024 - $0.036 - $0.048
_____________________
Did you like our analysis? Leave a comment, like, and follow to get more

The AI Prophecy: Marketwide Bullishness ProofThis is a chart and pair that I showed you recently. Why am I showing it to you again?
This is the proof.
The Altcoins market is bullish and the Altcoins market can only be bullish when Bitcoin is either growing or set to grow.
Notice the last five days, how did Bitcoin perform?
When Bitcoin crashes, everything crashes but, look at this divergence between Bitcoin and many Altcoins.
Look at the last five days for ACTUSDT, or many others, and what do you see?
➖ This pair remains strong and trading above EMA13.
➖ This pair is super-bullish, above a consolidation pattern and ready to grow.
➖ This pair broke out of a downtrend is now ready to move up.
This and other Altcoins cannot grow while Bitcoin goes down toward 40K, that's not how Bitcoin/Crypto works.
The market grows when Bitcoin grows.
What this chart reveals is a hidden bullish bias, the bottom is already in. We are going up now.
Hold patiently. Feel secure and feel safe because Cryptocurrency is set to grow like never before.
Thanks a lot for your continued support.
Namaste.
#ACT/USDT#ACT
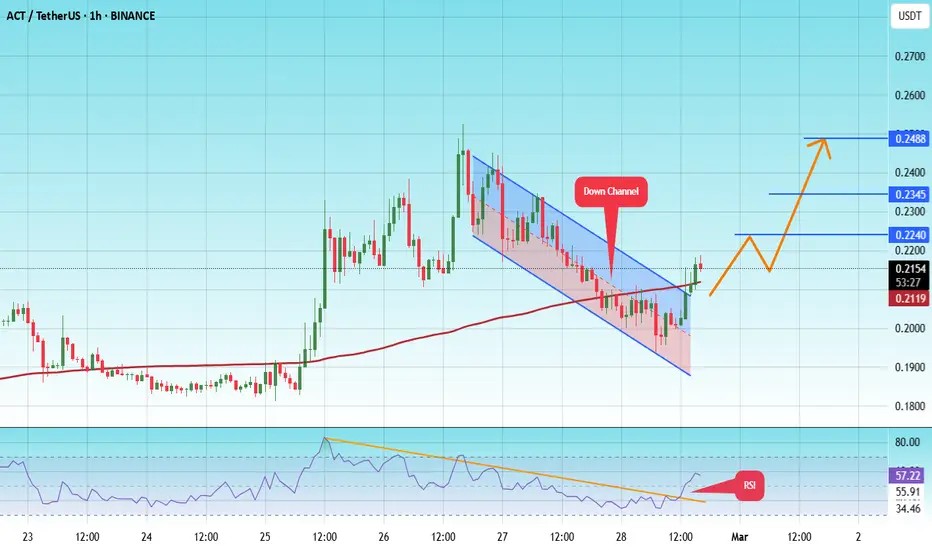
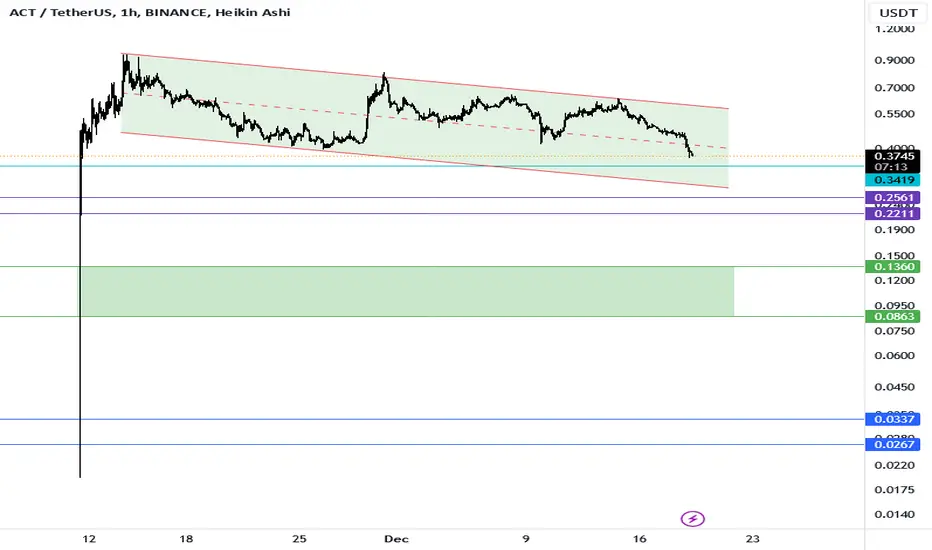
The price is moving in a descending channel on the 1-hour frame and is expected to continue upwards
We have a trend to stabilize above the moving average 100 again
We have a descending trend on the RSI indicator that supports the rise by breaking it upwards
We have a support area at the lower limit of the channel at a price of 0.1923
Entry price 0.2150
First target 0.2240
Second target 0.2345
Third target 0.2488
ACTUSDT 1WACT ~ 1W Analysis
#ACT Buy after successfully penetrating this resistance line, with a short -term target of at least 15%+.
Reason, The seller's pressure seems to have been completed.
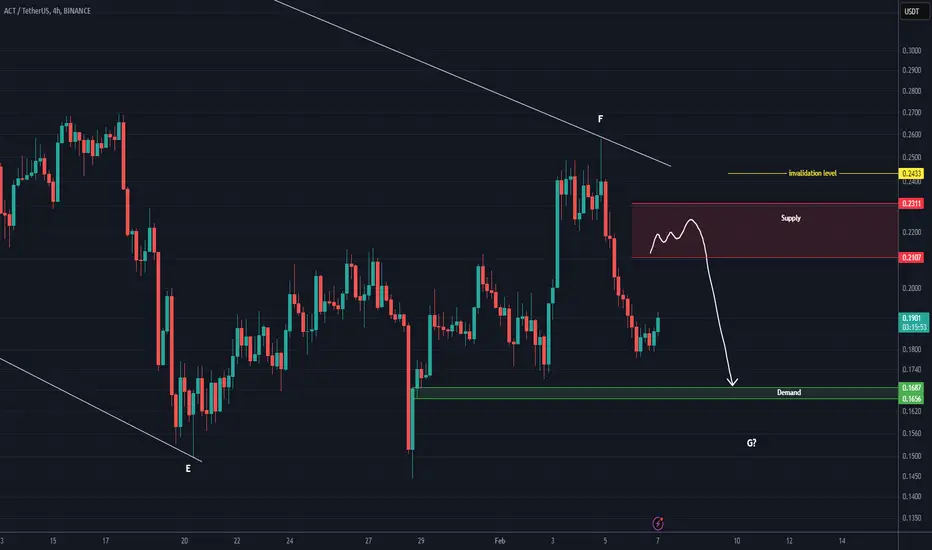
ACT ANALYSIS (4H)ACT is in a major correction. This correction is a large-degree diametric. It now appears to have entered the bearish G wave.
The price is pulling back into zones where sell orders exist to complete wave G.
A daily candle closing above the invalidation level will invalidate this analysis.
For risk management, please don't forget stop loss and capital management
Comment if you have any questions
Thank You
ACT ANALYSIS📊 #ACT Analysis
✅There is a formation of Descending Channel Pattern in daily chart. Currently #ACT is in bearish way.
After a breakout of the pattern and major resistance level we would see a bullish momentum otherwise the price will drop more 🧐
👀Current Price: $0.1968
⚡️What to do ?
👀Keep an eye on #ACT price action and volume. We can trade according to the chart and make some profits⚡️⚡️
#ACT #Cryptocurrency #Breakout #TechnicalAnalysis #DYOR

ACT Coin NEXT POSSIBLE MOVES AND TRADE SETUPS !!NASDAQ:ACT Coin Update & Next Possible Moves!!
• Right now NASDAQ:ACT Coin price trading in a falling wedge on 1D Tf & overall structure look bearish.
• but once its break its resistance trendline then minimum 30% bounce back expected.
• Let's see what happened.
Warning : That's just my analysis DYOR Before taking ant action🚨

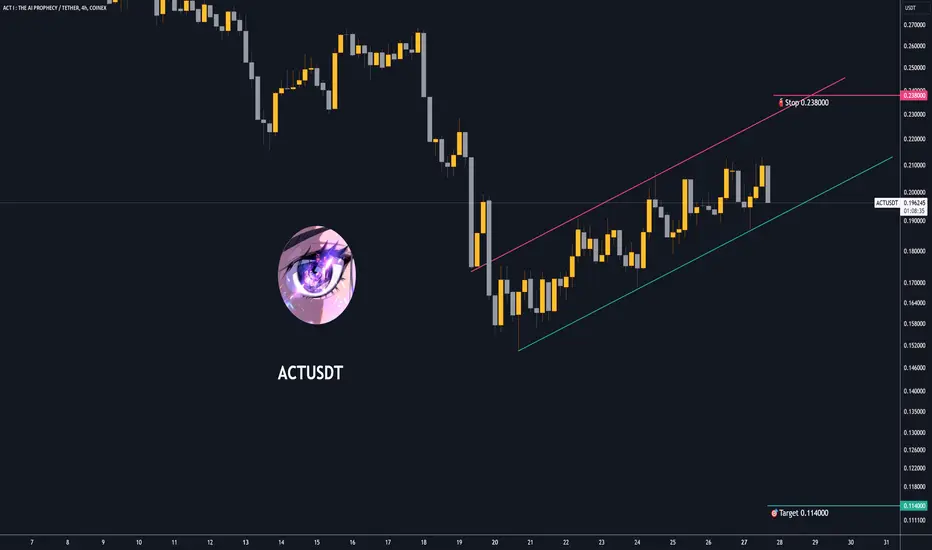
Trading opportunity for ACTUSDTBased on technical factors there is a Sell position in :
📊 ACTUSDT
🔴 Sell Now
🪫Stop loss 0.238000
🔋Target 0.114000
📏 R/R 2
💸RISK : 1%
We hope it is profitable for you ❤️
Please support our activity with your likes👍 and comments📝
$ACT - Long SetupAltcoins have been down so bad from their highs, but I'm still expecting high volatility this week.
Just taking this one with a tight stoploss just below 0.15 (low)
Long at current market price (cmp) , dca level at 0.165
Targets:
tp1 - 0.20
tp2 - 0.25
tp3 - 0.32
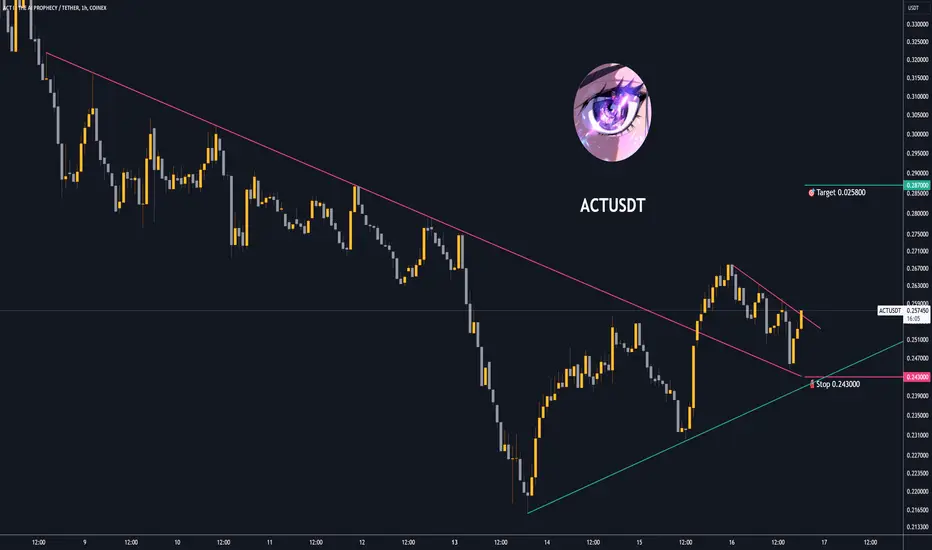
Trading opportunity for ACTUSDTBased on technical factors there is a Buy position in :
📊 ACTUSDT
🔵 Buy Now
🪫Stop loss 0.243000
🔋Target 0.287000
📏 R/R 2
💸RISK : 1%
We hope it is profitable for you ❤️
Please support our activity with your likes👍 and comments📝
ACTUSDT 12HACT ~ 12H
#ACT If you still have Conviction on the coin,. This support block would be a very good buying place for now.
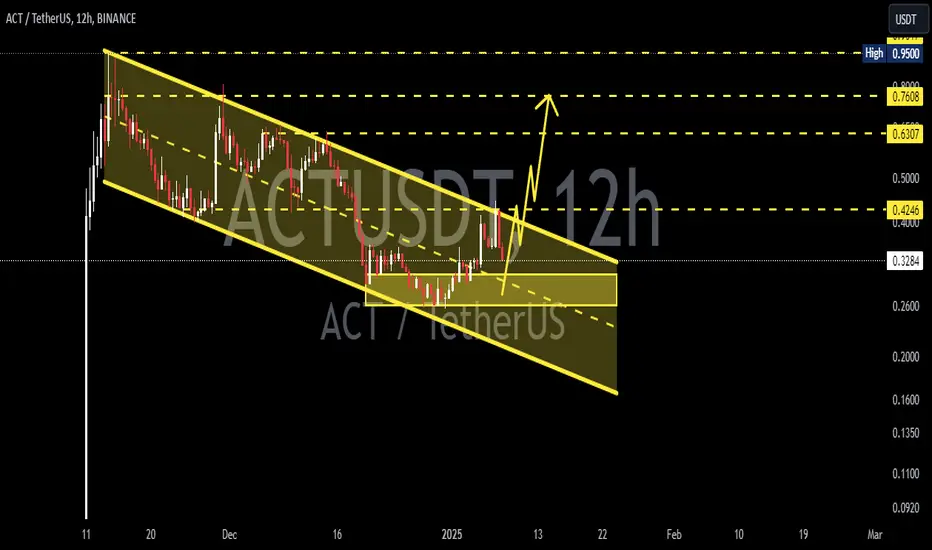
ACTUSDT UPDATEACTUSDT is a cryptocurrency trading at $0.4312. Its target price is $0.8000, indicating a potential 100%+ gain. The pattern is a Falling Wedge, which is a reversal pattern. This suggests that the downward trend may be coming to an end. A breakout from the Falling Wedge could lead to a strong upward move. The current price may be a buying opportunity. Investors are optimistic about ACTUSDT's future performance. Reaching the target price would result in significant returns. The Falling Wedge pattern is a bullish signal, indicating a potential trend reversal. This could be a lucrative investment opportunity.
ACT - LONG - Good opportunityACT is now ready to give us a chance. Despite being a little late it is still in a good place for daily timeframe. This is a moderate risk trade, as we have a small confirmation and good support. These currencies are also very volatile and high leverage should not be used.
TP 1: 0.42
TP 2: 0.58
TP 3: 0.63 (It's not very likely, but it could be).
SL 1: 0.2368
SL 2: 0.21
-
First trade of 2025, have a happy new year.

ACTUSDT (ACT I) Updated till 05-01-25ACTUSDT (ACT I) Daily timeframe range. PA is fairly new here if it can stay above 0.2530 it got huge chances of good trades. there is fundamental support too. for now if PA can break 0.4169 clean than it can push toward 0.6714 or above.

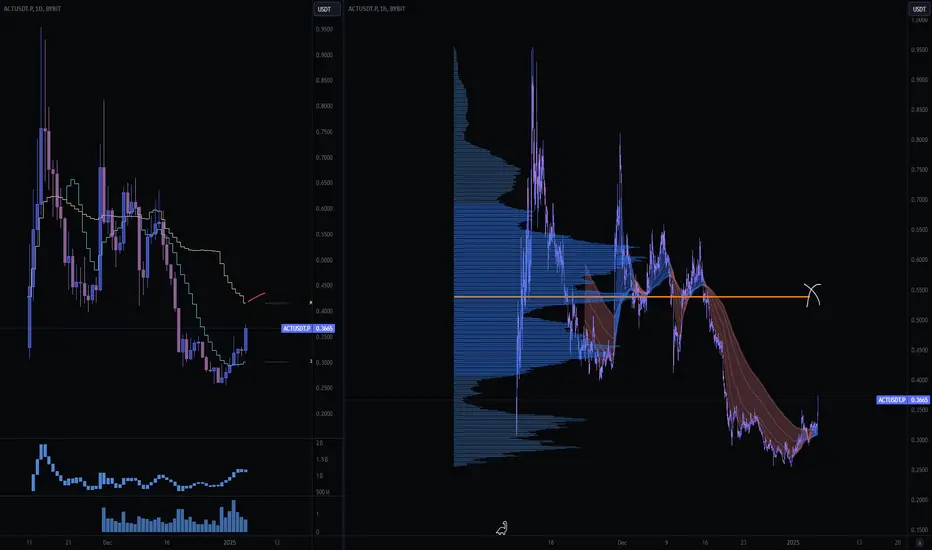
$ACT - Scalp Long SetupACT is showing signs of recovery and gaining traction, suggesting it might be ready for another upward move.
ACT has shown signs of potential growth, having deviated slightly on its previous low at .40
If we can hold .35 support, we can potentially retest this previous low.
Long Entry: at cmp .36 to .34
Stop below .30
Potential Long targets:
.40-.42 (m_evwap)
.50-.54 (npoc/hvn)
.60-.64 (w_vwap)
ACT COIN PRICE ANALYSIS AND NEXT POSSIBLE MOVES!!NASDAQ:ACT Coin!!
• 2 major areas where we can expect now potential bounce back in its price🥷
• On First Support Don't Build trade without SL🚨
Warning : That's just my analysis DYOR Before Taking any trade.
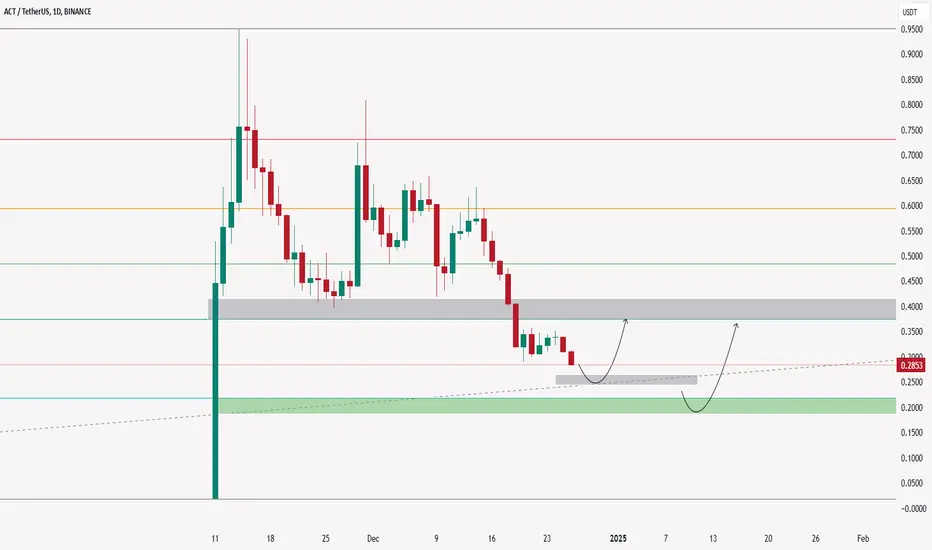
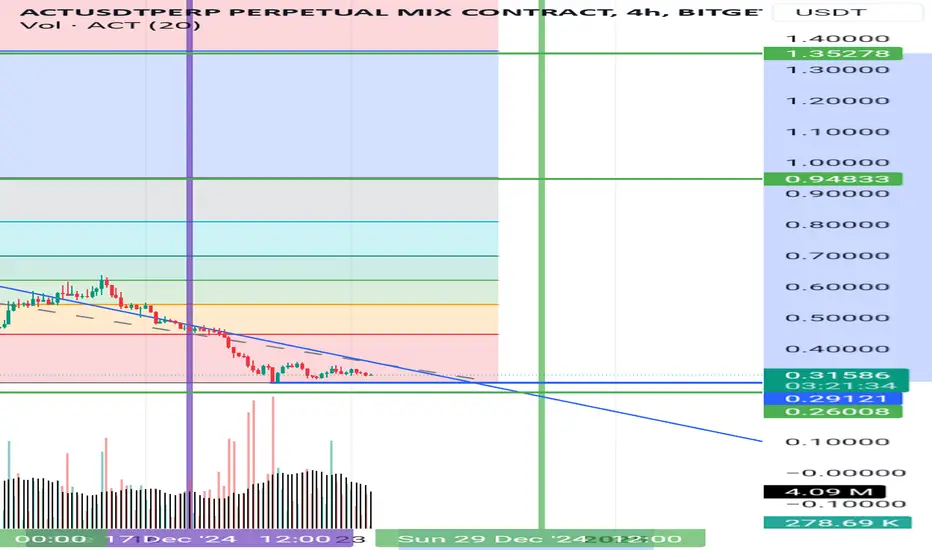
ActFirst support 0.29241
Second support 0.29121
First target 0.94833
Second target 1.35358
If you enter at 0.29121
You can get 360% profit in one month
Act ready for toch 1.35$
actMy general opinion is to buy in the green box and then the blue lines, but in the short term, the turquoise and purple lines can be checked for a short-term stop.
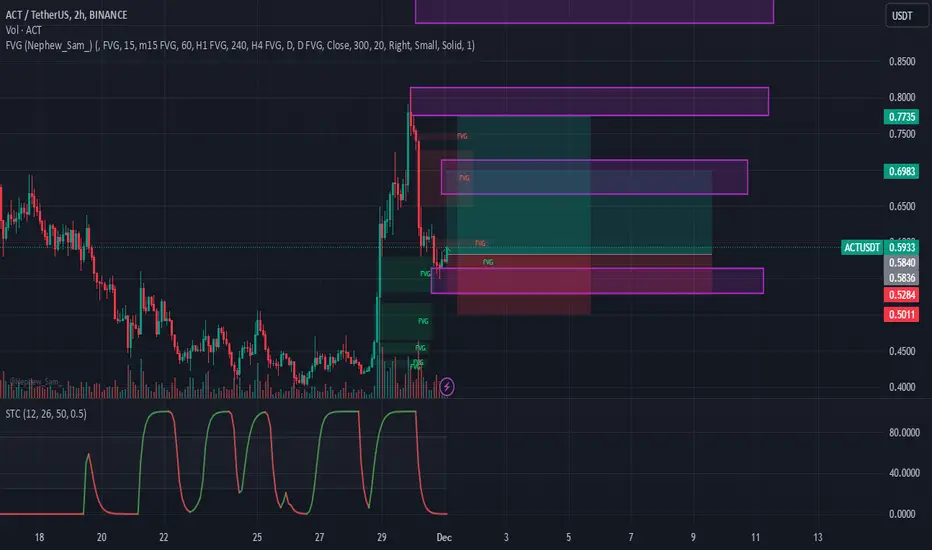
ACT - Bullish ContinuationRisky trade, small stop, high reward. 3 TP, can even up 20% - 30% soon. Booth trades have the stop at 0.52848. Protect the trade as soon as possible.
TP: 0.70, 0.80, 0.90.
ACT | These Pumps are Fun?PumpFun & Meme Mania
ACT is a meme token operating on the Solana blockchain, initially launched on Pumpfun and endorsed by AI. ACT stands out by reimagining user interactions with AI, moving beyond the traditional one on one assistant model to establish a collaborative peer network.
The current price of Act I: The AI Prophecy is $0.62, reflecting a 25% increase in the past 24 hours thanks to Binance listings. ACT has a circulating supply of 948.25 million tokens, with a maximum supply of 1 billion.The token was first issued on October 19 and has been hovering around a $20 million market cap over the weekend.
The token's 24 hour trading volume is $977 million, and it is actively traded across 28 markets and 20 exchanges, with Binance being the most prominent.Currently, Act I: The AI Prophecy holds a 0.02% share of the total cryptocurrency market, boasting a market capitalization of $616 million
In this cycle, meme tokens dominate and create extreme volatility, as their creators are often already planning the next meme project. Remember to set a stop-loss and avoid going all-in!
Which meme coins are you bullish on?
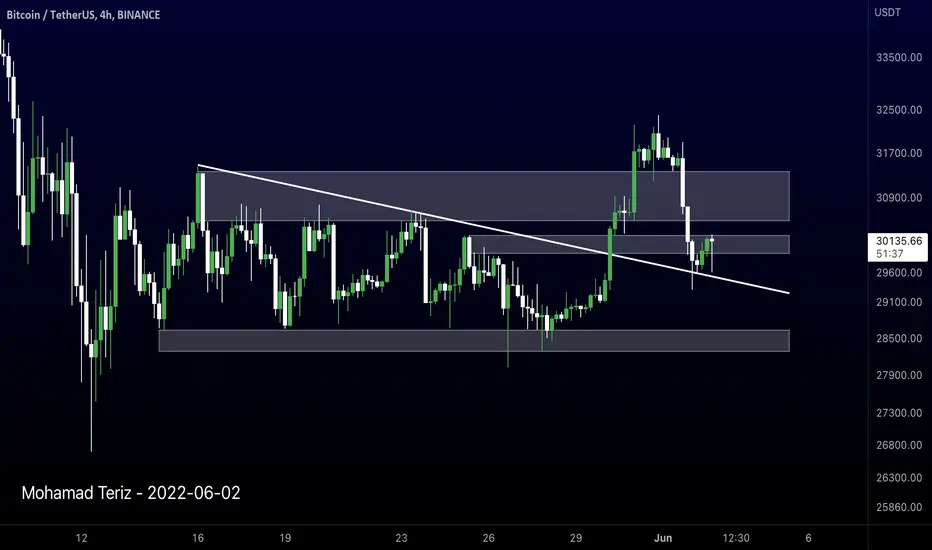
BTCUSDT 4H TA : 2022-06-02Bitcoin is continuing to move above this trend line in the 4 hour time frame after breaking its downtrend line. If the price can maintain above this range and advance to 31800, an uptrend will be formed, otherwise we will see a downward trend again with the loss of the line.
Its not Buy or Sell SIGNAL
DYOR
BY : Mohamad Teriz - @AtonicShark
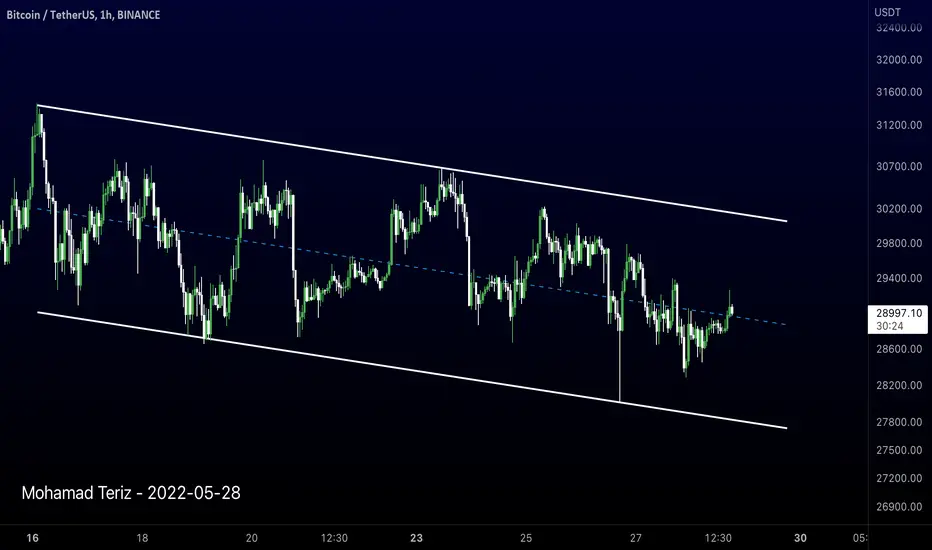
BTCUSDT 1H TA : BITCOIN on the channelBitcoin is a one-hour time frame in the midline of a bearish channel that can advance to the top of the channel by stabilizing the price above 29,400. Otherwise, with the resistance, the price will fall again to the bottom of the channel.
Its not Buy or Sell SIGNAL
DYOR
BY : Mohamad Teriz - @AtonicShark