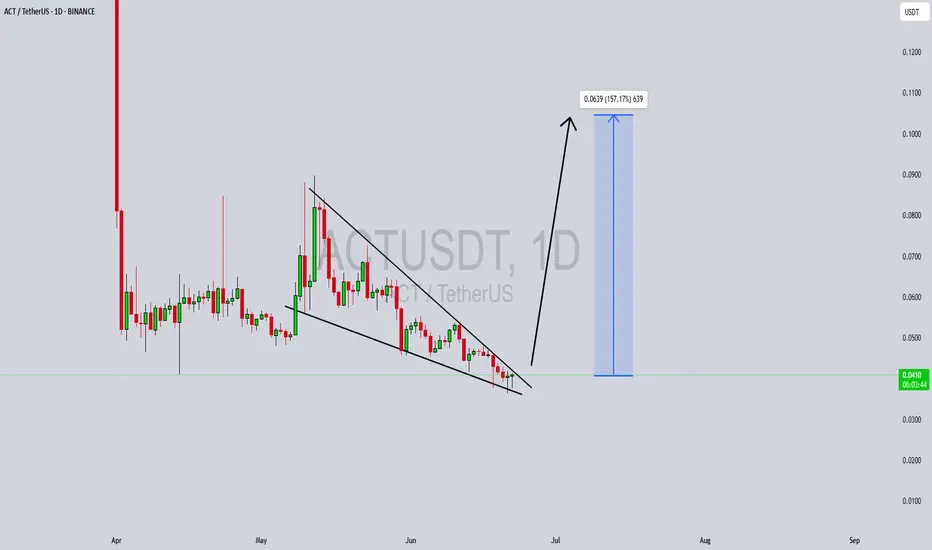
ACTUSDT Forming Classic Falling Wedge ACTUSDT is currently exhibiting a classic falling wedge pattern on the chart—a bullish reversal setup known for its high probability of a breakout to the upside. After a consistent downtrend, the price action has started to compress within converging trendlines, suggesting that selling pressure is diminishing. A breakout above the wedge's resistance line could trigger a sharp price surge. Technical traders often look to such formations for potential entries, especially when combined with growing volume and renewed market sentiment.
Volume analysis reveals a notable uptick in recent sessions, signaling that investors are beginning to accumulate ACTUSDT. This increased interest could be due to fundamental news or broader market momentum returning to altcoins. When volume expands near the apex of a falling wedge, it usually reinforces the validity of the pattern and strengthens the breakout potential. With this setup, the projected move points to a possible gain of 140% to 150%, aligning with previous key resistance levels that the price could retest post-breakout.
On a momentum front, indicators like RSI and MACD are starting to turn bullish, offering early signs of a reversal. The price is also holding above short-term support zones, suggesting the formation of a base. The combination of technical structure, volume dynamics, and improving sentiment makes ACTUSDT a strong contender for a breakout move in the near term. Such opportunities are especially attractive in trending markets where capital rotates quickly into coins showing strong chart setups.
Given this confluence of bullish signals, ACTUSDT could become a leading performer in the altcoin space over the coming weeks. Traders and investors are advised to keep a close watch for breakout confirmation and subsequent retest levels, which could offer optimal entry points for both short-term gains and medium-term swing setups.
✅ Show your support by hitting the like button and
✅ Leaving a comment below! (What is You opinion about this Coin)
Your feedback and engagement keep me inspired to share more insightful market analysis with you!
Actusdtlong
#ACT/USDT#ACT
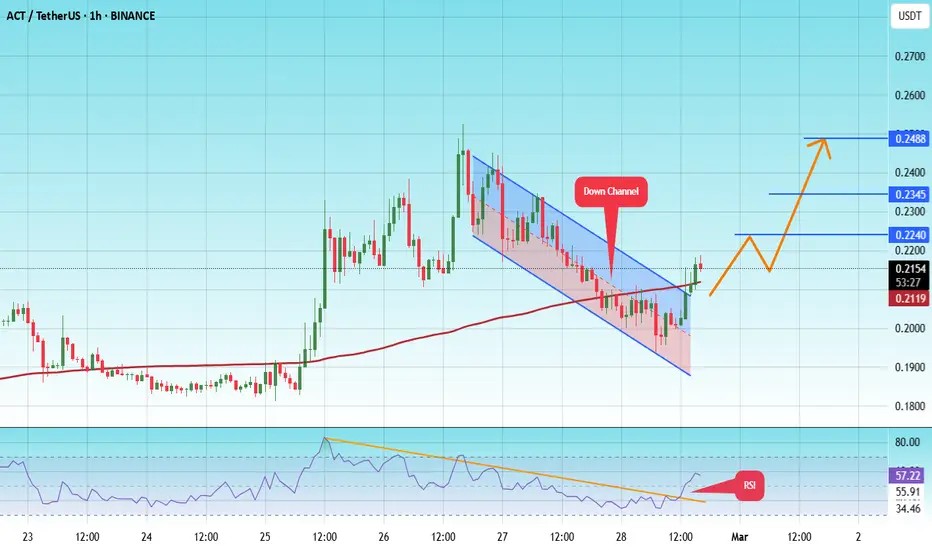
The price is moving in a descending channel on the 1-hour frame and is expected to continue upwards
We have a trend to stabilize above the moving average 100 again
We have a descending trend on the RSI indicator that supports the rise by breaking it upwards
We have a support area at the lower limit of the channel at a price of 0.1923
Entry price 0.2150
First target 0.2240
Second target 0.2345
Third target 0.2488
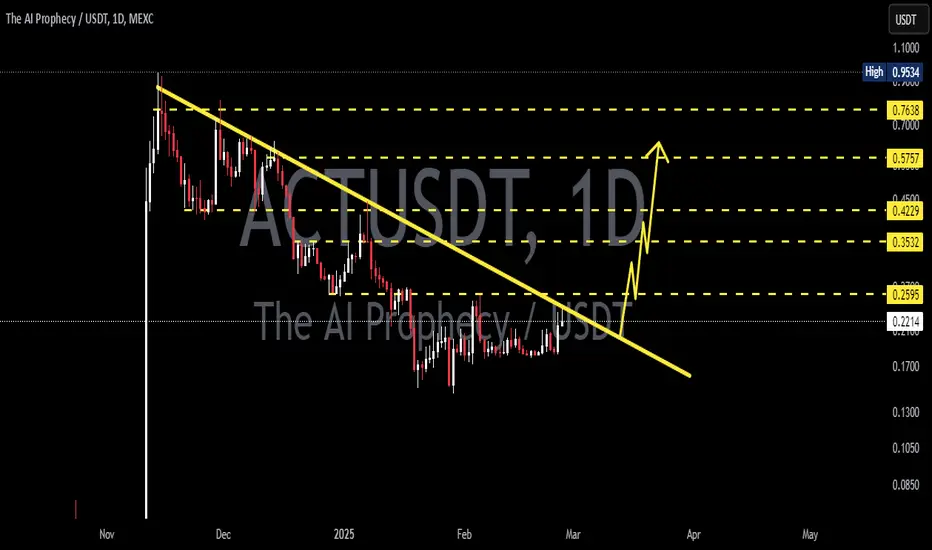
ACTUSDT 1WACT ~ 1W Analysis
#ACT Buy after successfully penetrating this resistance line, with a short -term target of at least 15%+.
Reason, The seller's pressure seems to have been completed.
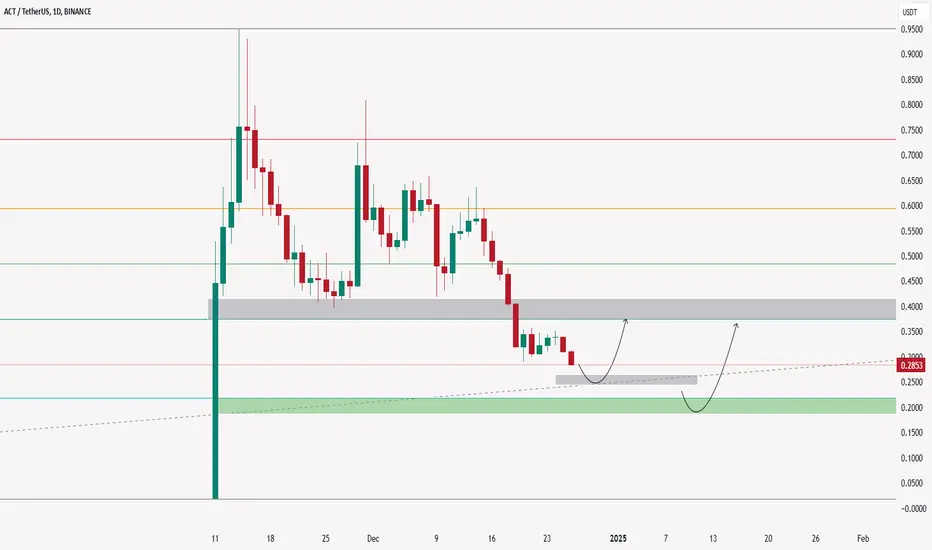
ACT Coin NEXT POSSIBLE MOVES AND TRADE SETUPS !!NASDAQ:ACT Coin Update & Next Possible Moves!!
• Right now NASDAQ:ACT Coin price trading in a falling wedge on 1D Tf & overall structure look bearish.
• but once its break its resistance trendline then minimum 30% bounce back expected.
• Let's see what happened.
Warning : That's just my analysis DYOR Before taking ant action🚨

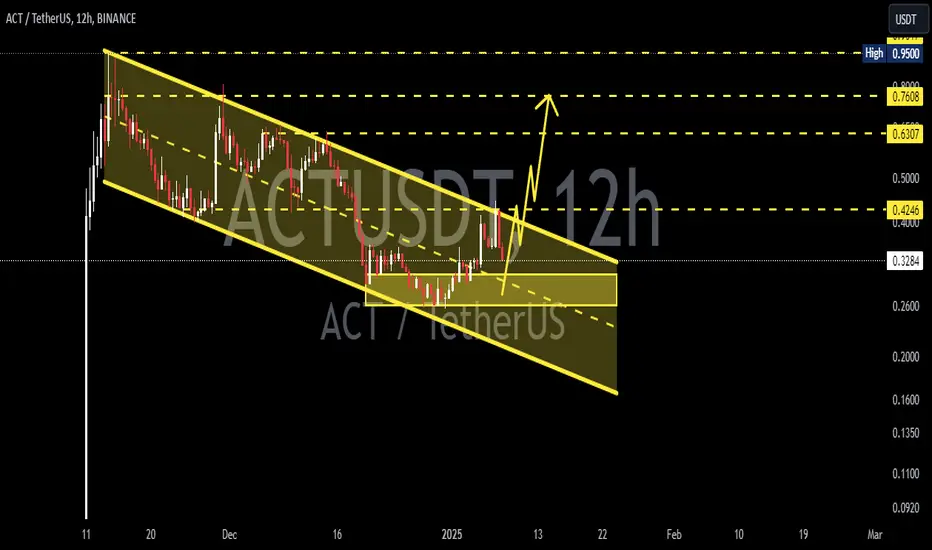
ACTUSDT 12HACT ~ 12H
#ACT If you still have Conviction on the coin,. This support block would be a very good buying place for now.
ACT COIN PRICE ANALYSIS AND NEXT POSSIBLE MOVES!!NASDAQ:ACT Coin!!
• 2 major areas where we can expect now potential bounce back in its price🥷
• On First Support Don't Build trade without SL🚨
Warning : That's just my analysis DYOR Before Taking any trade.