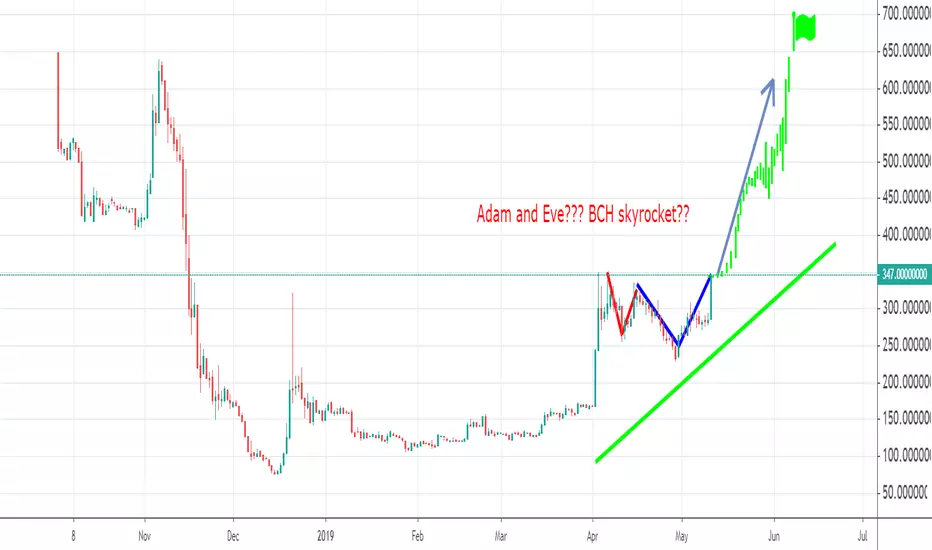
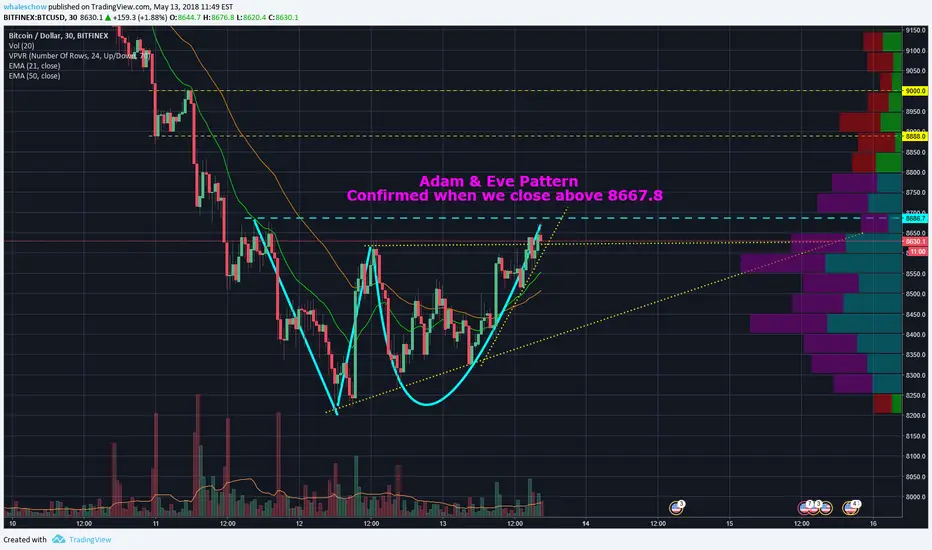
ADAM AND EVE SPOTTED?BCH(Bitcoin Cash) is currently $340 from $300 and is very...very bullish atm i was studying the charts and i spotted something that may be a bullish Adam And Eve
what is an Adam and Eve? it is a double bottom.. usually after a adam and eve is spotted an uptrend begins.. there are invert/bearish adam and eves but this is bullish
what do you think?
BCH is looking very bullish. id buy in it
but dont take my ADVICE SERIOUSLY research it!
RESISTANCES: $350 $380 $400 $450
SUPPORT: $320 $300 $280 $250 $220
Have a great day!
Adamandeve
goldencross/potential adam&eve dbl bttm brkout on ETH imminent?Keep a close eye on this one folks...we can see that we could have an official goldencross on ETHUSD as early as tomorrow and it just so happens to align with the price action currently peeking its head above the adam and eve patterns neckline....we can see stochrsi is perfectly positioned here for a bullish move as well...of course we need to see a big bullish volume surge here in the next 2 1 day candles to confirm this breakout and need to factor in the possibility of a fakeout until then but it does seem we have several bullish pieces aligning at once...also btc has already broken out of a similar pattern an reached the breakout target so it would make sense for eth to also do so in order to catch up with its big brother. As always I will wait for bullish volume for confirmation but I will also be laddering in conservatively here with smart stop losses until that volume confirmation...if we do confirm our target should take us above $240

ZRX - Multiple time frames show near bottomShowing in the 1Month charts
Jan 15th 2018 - Present the building of an
Adam and Eve pattern and we are at the bottom or near
before the back half of the pattern.
Showing on the 1W charts
May 7th 2018 - present the building of a large
descending triangle. We are nearing the apex of it.
Time for it to break out or break down.
Things which support a break up.
*Adam & Eve pattern on 1M
*1 Year descending wedge triangle
*decent volume Inverted hammer

ZRX - 1M Adam and EveShowing in the 1Month charts
Jan 15th 2018 - Present the building of an
Adam and Eve pattern and we are at the bottom or near
before the back half of the pattern.
Showing on the 1W charts
May 7th 2018 - present the building of a large
descending triangle. We are nearing the apex of it.
Time for it to break out or break down.
Things which support a break up.
*Adam & Eve pattern on 1M
*1 Year descending wedge triangle
*decent volume Inverted hammer

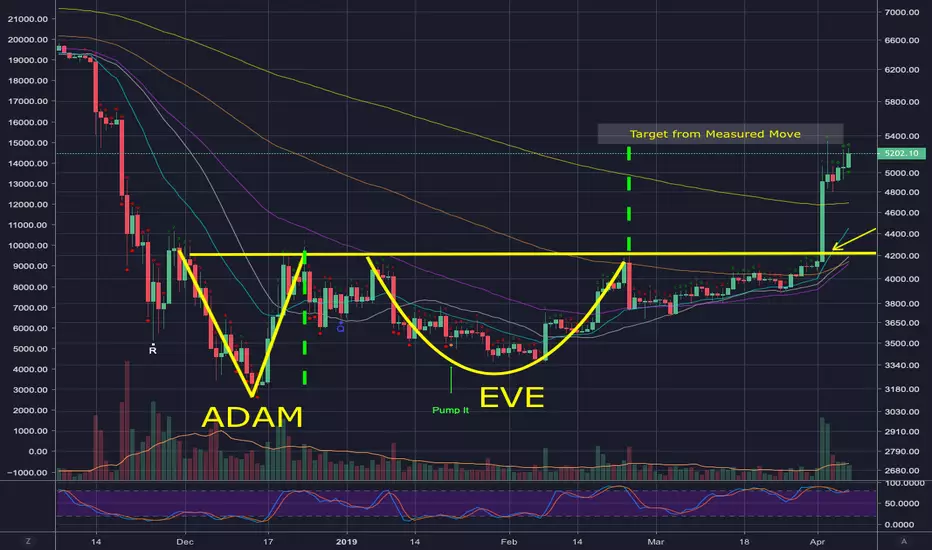
Measured move on BTC Adam and Eve hitForgot to include MM on earlier charts. MM looks to be hit though, potentially a nice short.
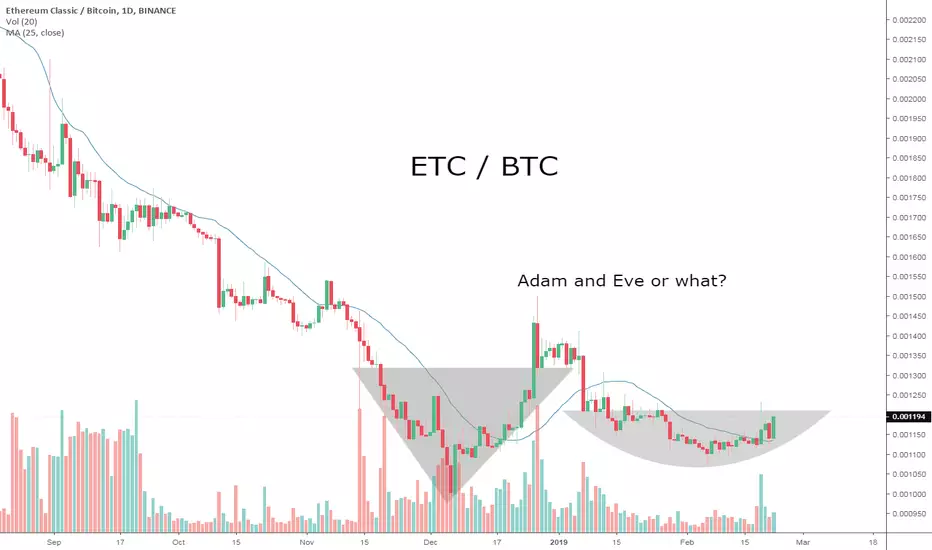
ETCUSD "Adam & Eve Double Bottom" pattern validated!Ethereum Classic #ETC. "Adam & Eve double bottom" pattern validated with breakout of the neckline happened just now.
In additional, breakout of the long term resistance since may 2018, and now positioned above the MA200.
Let's see if it will pump enough to get back to its past "normal price" over $12-15. ;-)


ETHUSD Prints TWO Bullish PatternsETHUSD is showing signs of an upcoming rally.
As shown, we have a textbook Adam & Eve Pattern that will break out at the neckline.
In addition, ETHUSD has printed a Cup & Handle pattern.
The RSI has held its bottom trend line for almost three months now, it seems we might get pushed to overbought areas which is when the price makes the biggest moves.
Fidelity launched their crypto trading platform for institutions 2 days ago. Its only time until the "select clients" start their buying.
I see green ahead.

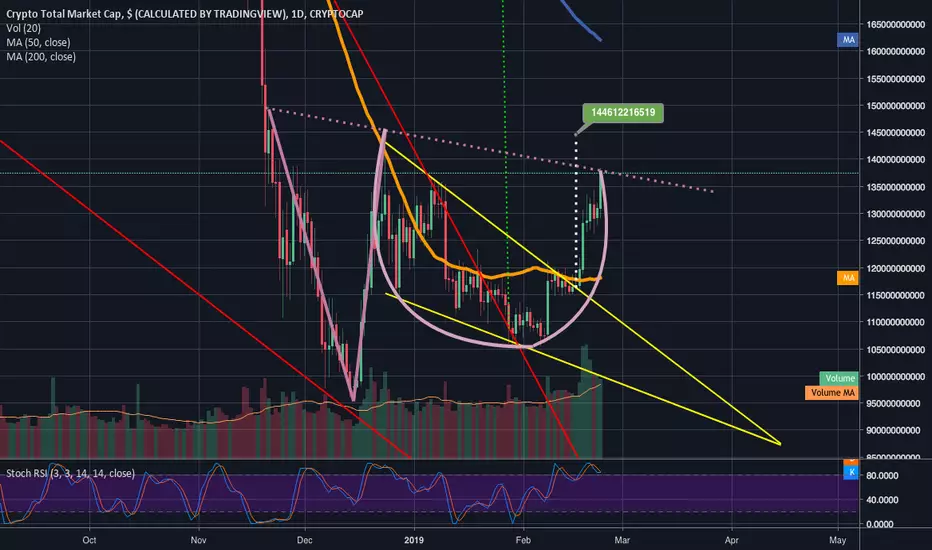
Potential bearmarket adam & eve double bottom on totalmarketcapwe can see here how we have almost reach the first bullish breakout target on the total crypto market cap chart of the yellow 1 day falling wedge. we are now finding resistance right at the neckline of a potential adam and eve double bottom which is either a 1 day, 3 day, or weekly pattern. Considering we haven't yet hit the yellow falling wedge target and we still have a very long way to go if we are indeed triggering the much larger weekly falling wedge pattern, which it certainly looks like we will be, then we are very likely to trigger the adam and eve double bottom here as well which would essentially in my mind signal that the bottom was in back in december around 3.1k or so. Interestingly enough it was around this time last year that I was watching a fractal of a potential adam and eve double bottom on bitcoin. that fractal was very very similar to another smaller adam and eve double bottom that happened right before the major bull run so I was anticipating it would be what flipped us back into a bull market but that adam and eve double bottom did a fakeout right at its neckline then plummeted eventually dipping low enough to invalidate the pattern. We need to be prepared for a neckline fakeout here too but this time we have so many other bullish patterns converging and triggering at once that I think a fakeout is far far less likely and probability indeed favors a breakout.

Viasat (VSAT) could rally following double bottom +18%Keep an eye on this stock as following confirmation of an Adam & Eve Double Bottom pattern we could be looking at a target around 85 with a stop loss around 52.

IOTA - Adam and Eve Double BottomWe can see a repeating pattern of a falling wedge followed by an adam and eve double bottom, looks to be completing the eve bottom now and looks to be a good buy.
IOTA
BUY: 0.000154 - 0.00016
SELL:
0.00017
0.00019
0.00020
0.00023
0.00026
0.000275
0.00033
STOP LOSS:
0.00013

Trx/BTC - Looks like Adam & Eve pattern is in playVolume is falling, Rsi is falling, trx/btc is falling, double top in Adam and Eve form visible on the chart -> thepatternsite.com
I know everyone is bullish about Tron but sometimes sh..t happens.

BTC possible trend for the next weeksNot investment advice intended.
We have many bullish signs here. The Bullish Divergence pointed on the chart and the Adam and Eve bottom pattern (see picture below) are the most impressive right now. But I have to admit, dass A&E is already looking like if it's going to fail. We'll see.

BTCUSD - ADAM&EVE DOUBLE BOTTOM PATTERNBTCUSD - Adam&Eve pattern continues.
MA200 resistance in the dailt charts.
7 Logical Reasons LTC May See New ATH'sTicker: COINBASE:LTCUSD
Timeframe: Daily/All History
1- When taking a Fibonacci retracement from the all time low to the all time high we see that a possible front run of the .786 may have happened twice. Denoted by the gray box. If we were to retrace to the 1, we would see $3 litecoin, which, while I would capitalize like crazy, I don't think will happen.
2- Looking at the gray front run region we can see only wicks have been successful so far. Possibly displaying the markets value of litecoin and confirm the green support line in that area.
3- We can see a possible triangle forming from the low lows to the high highs, right now we're working our way back to the top of the triangle, where I think we may see our last reversal.
4- I'm no expert in this formation, but it's possible we're seeing an Adam & Eve forming within the triangle further leaning market bias towards bullish.
5- There's also a nice ABCDE forming in the triangle, tracing the A&E. Further making me think we will see our last reversal before our next impulsive wave out of the triangle.
6- Idk if this is a thing, but we can see a trend in volume spikes, leading me to believe if we break this triangle and confirm all of these patterns everyone may fomo into the market at once turning our wave 2 into a wave 3 and leading us to the area of the .382 retrace/extend overlap.
7- Finally pertaining to the chart, if the wave 2 is confirmed and wave 3 begins of the new impulse wave 1 up, I am almost certain we will see new highs by the end of the year.
*bonus*
8- Looking at the MACD you can see an upward cross overtaking the signal and the histogram ticking from under to over.
9- Finally, finally, the RSI is trending in a triangle that's confirmed on lower timeframes, it should break from D to E in the ABCDE correction and cool off by E leaving it under bought for the next impulse wave.
Short Term: Slightly Bearish
Mid Term: Bullish
Long Term: Very Bullish
Market: Neutral/Impatiently Bearish
