ADAUSDT $36c Likely on PhoenixAscendingHi Traders, Investors and Speculators 📈📉
Ev here. Been trading crypto since 2017 and later got into stocks. I have 3 board exams on financial markets and studied economics from a top tier university for a year. Daytime job - Math Teacher. 👩🏫
Here's a short term overview on what we can expect for the price of Cardano for the immediate term. Technical indicator Phoenix Ascending together with Bollinger Bands point towards a potential $0.36c, as we see the RSI and EMA moving up with bullish buying momentum in the short term. IF the green EMA can cross over the 50 line, we can expect movement towards the basis of the bollinger bands, even if it is just a wick. The basis is the 20d moving average currently at $0.36.
However, currently with all the bankruptcy happening in the crypto environment, the markets do not look favorable for a new bull cycle, so I expect a resistance zone here. The next immanent support zone is around 0.22c, where there is a high demand zone and this is where I expect a bottom for ADAUSDT to be found.
Curious about what Decembers hold for Bitcoin historically? Check out this idea:
_______________________
📢Follow us here on TradingView for daily updates and trade ideas on crypto , stocks and commodities 💎Hit like & Follow 👍
We thank you for your support !
CryptoCheck
Adausdlong


ADA going UP ⬆️ 🆙 BINANCE:ADAUSDT
this my opinion about what it seems to be the path that the price will respect ✊

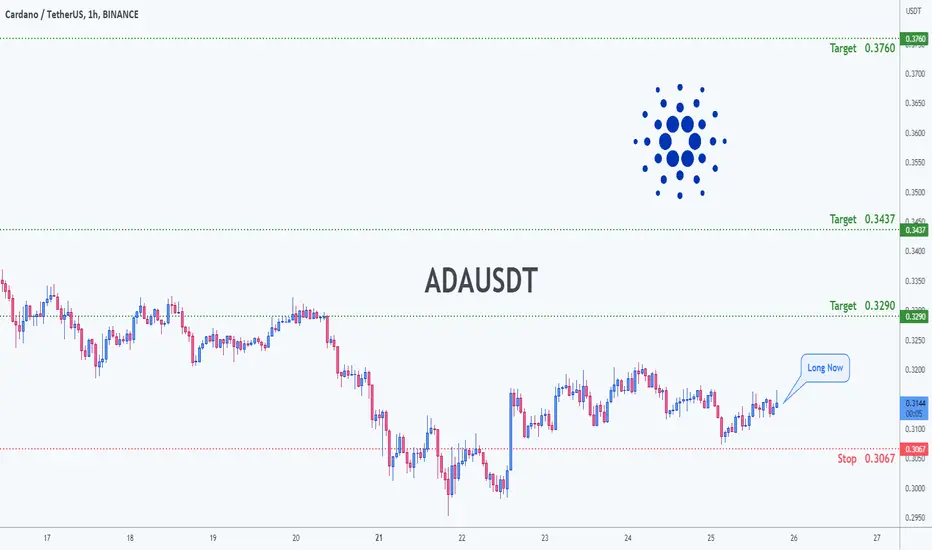
Trading opportunity For ADAUSDTBased on technical factors there is a Buy position in :
📊 ADAUSDT
🔵 Buy Now 0.3146
🧯 Stop loss 0.3067
🏹 Target 1 0.3290
🏹 Target 2 0.3437
🏹 Target 3 0.3760
💸RISK : 1%
We hope it is profitable for you ❤️
Please support our activity with your likes👍 and comments📝
ADAUSDT: Is It the Best Time to Buy ADA? 🫣| Nov. 25, 2022
This week, we will stick to the 4-hour time frame to analyze the price action in detail!
The bears clearly have had a tight grip on the bulls for the past few weeks as seen in the chart above. ADA has been continuously hitting 52-week lows, the recent one being hit on Monday.
Until we see the price reverse, it is risky to take a long position on ADA. Therefore, traders should avoid taking positions until ADA is able to reclaim the resistance at $0.34.
The price will show signs of strength only once it is able to sustain above $0.34. Until then, there is a chance of a new 52-week low being hit!
Once the resistance is reclaimed, we can expect the price to start approaching our short-term target marked on the chart at $0.38. This view will only be valid if the price is able to sustain above $0.34. We will maintain a bearish outlook on ADA until it is able to reclaim the resistance.
The important price levels for this week are $0.34 and $0.38!

ada usdt 4h updateada usdt currently trade at 0.32 cents
we expect bounce back from its strong support area 0.30 cents
before entry must see overall markete condition

CarDano ADA/USDT Again as I have mentioned earlier.. We are very close..Final capitulation is necessary to spring the crypto back up. At least we're looking for a local bottom.
ADA Cardano Long?ADA Cardano Technical Analysis:
- There is a formation of a falling wedge creating lower lows: falling wedges tend to break to the upside.
- Previous Falling and Rising wedges have played out already.
- Will the current Falling wedge break out to the upside?
- A BULLISH Divergence is also forming on a 1HR Chart
-- But how far upside? Take a look at the POC - point of control price and volume at the red line. $0.40
--- Will we make it to $0.40 based on the technical? What are your thoughts?
Follow for daily charts. Cheers
ADA Cardano
#ADA # Cardano

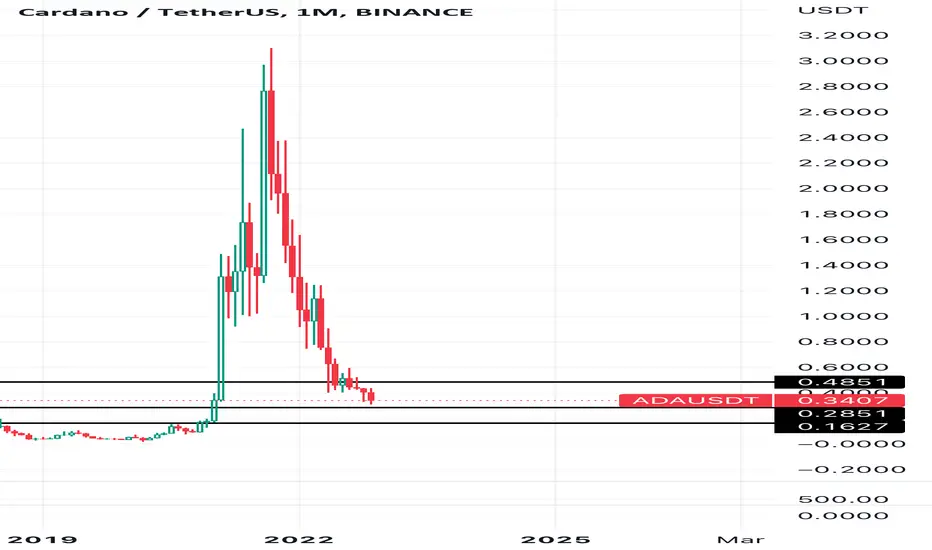
Ada update Will cardano is one of my biggest position in ALTs after ETH
to be honest its clear it can reach .28 $ then .16 $
With that been said ill keep accumulating ada and stake it .
I believe it a good ALT coin .
GOOD LUCK
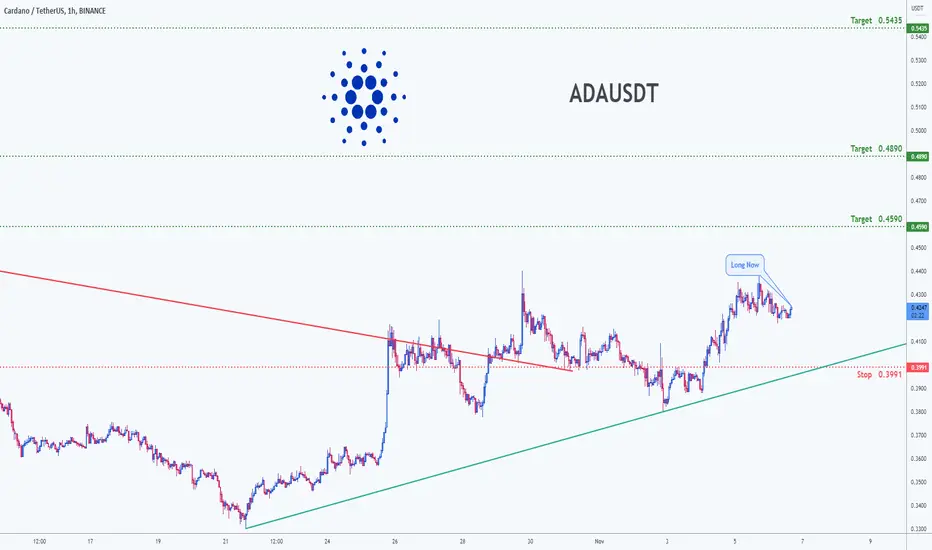
Trading opportunity for long position ADAUSDTBased on technical factors there is a Long position in :
📊 ADAUSDT - Cardano
🔵 Long Now 0.4242
🧯 Stop loss 0.3991
🏹 Target 1 0.4590
🏹 Target 2 0.4890
🏹 Target 3 0.5435
💸RISK : 1%
We hope it is profitable for you ❤️
Please support our activity with your likes👍 and comments📝
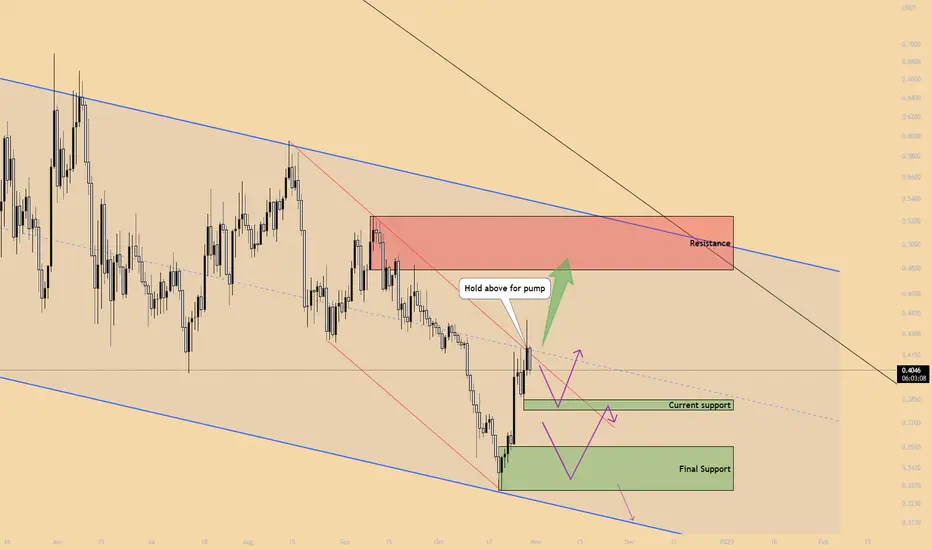
ADA in a falling wedge with next targets ADA has been trading in a falling wedge since last few months now it needs to hold above the red trendline and middle of falling wedge to pump to $0.48 - $0.5 otherwise it will retest the support at $0.38 or $0.35.
ADA /USDT#ADA UPDATE.
#ADA is currently trading in ascending triangle with blue box area as the resistance .For upside move ADA needs to close above the blue box however chances of pullback are higher as ADA is trading with bearish divergence.

ada usdt 4h updateada usdt currently trade at0.36$.
good buying range at 0.33$ to 0.30$
also depend on markete condition ..... waite for more markete dump then good buying oportunity waiting for us.
follow me for regular updates about crypto.

ADAUSDT 15 % pump (NEW)Recently we have published an idea where we expect ADAUSDT to break the support and drop 40 %.
It looks that the support is still holding and now we expect the price to have a 15 % bounce to get rejected one more time from the downsloping resistance line.
It may be the last bounce before the next leg down as the trend overall remains bearish.
Easy trade to strategize:
Buy at the support,
Sell at the downsloping resistance
Stop loss below the support
Good luck

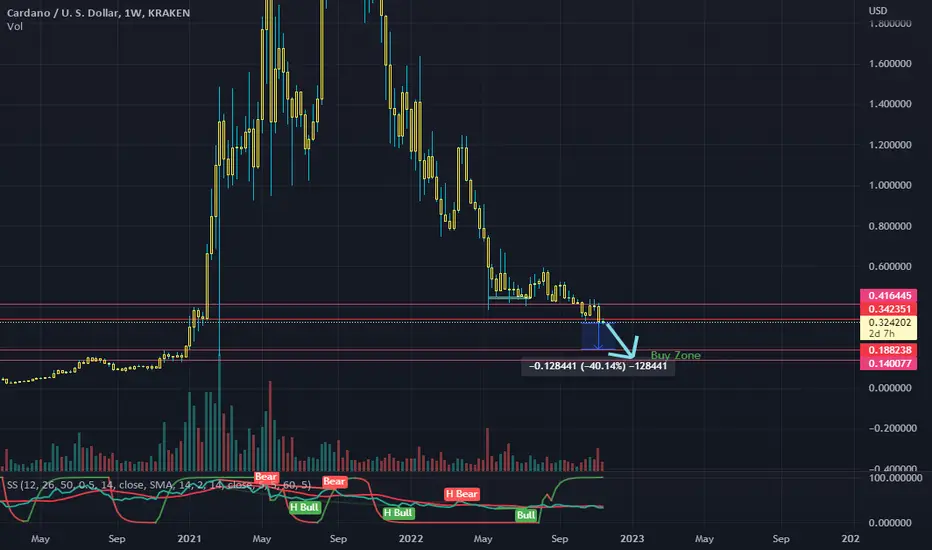
Has the Cardano ADA bottom already printed?I have been looking at the Cardano chart today and noticed that the longer-term targets would only be met IF Cardano has already bottomed. So, if you're expecting higher prices for ADA, I would consider this a bottom as when you pull the Fibonacci retracement tool from 2017 highs to the lows it gives a 1.618 target which is in a similar realm as to if you pull the Fibonacci retracement from the all-time high to the recent lows. As shown on the chart

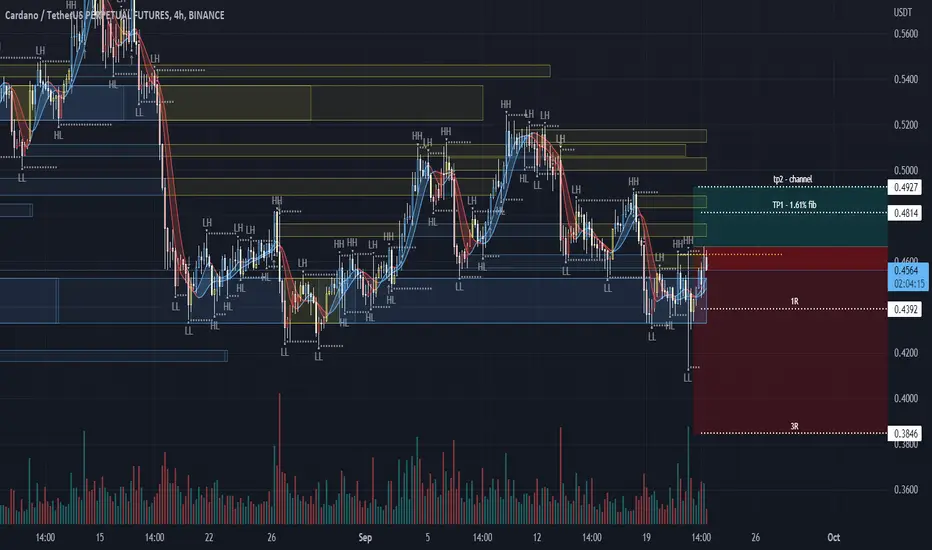
ADA/USDT - LONG ----- Welcome, dear followers! -----
- Here is my trading methodology. I trade with a normal system and analysis of resistance and support, as well as price reversal patterns.
- For the record, I do not place a stop loss within my trades. So that I only risk 1.5% of my total capital in order to support the loss due to a price reversal against me.
- If a price reversed against my expectation and touched the drawn line r3, then I transferred targets to the entry point and waited for the price to close at it with a loss equal to almost zero.
- Today's deal is shown in the chart, and here are the entry and exit points below.
-- Support me with numbers and follow up on my account for other deals in the future. Thank you for coming to this part. --
-------------------------------------------------------
⚡️⚡️ ADA/USDT ⚡️⚡️
Exchange: Binance Futures
Trade Type: Breakout (Long)
Leverage: Cross (1.0X)
Entry Orders:
1) 0.4664 - 100.0% (59.6992 USDT) ✅
Take-Profit Orders:
1) 0.4814 - 80.468%
2) 0.4927 - 19.531%
Trailing Configuration:
Stop: Breakeven -
Trigger: Target (1)
ADA I have 2 scenarios for the movement of this chart. Pay attention to the movements that I showed. be patient . Enter the position with confirmation.
I posted this post after a while and neither myself nor my country nor the people of Iran are doing well. And for now, I will not post until my country is doing well #mahsa_amini #iran
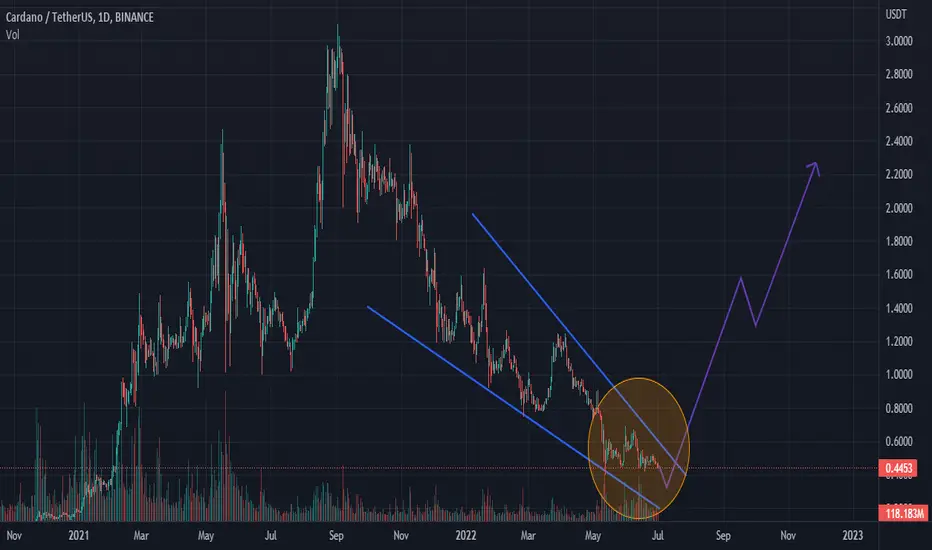
ADA/USDT 1 DAY CHART PROJECTED FALL AND BULLRUN TOPIn this idea I project the bottom for ADA and where we are likely to see it go to. This is a decent run up for this coin and ADA enthusiasts have a lot to look forward to in 2023. If you agree throw me a like and follow me for more unique ideas and concepts that keep you in the gains. Stay tuned as I will be dropping a lot of projections for the coming bullrun for various Alts. Much love to my supporters - ND

ADA/USDT :: Be Ready to take a position !!!ADA/USDT :::
_ in a downward trend and can continue its downward trend until the second support by breaking the support (red line) .
And if it succeeds in breaking through the ceiling of the channel, it will easily move to the nearest resistance .

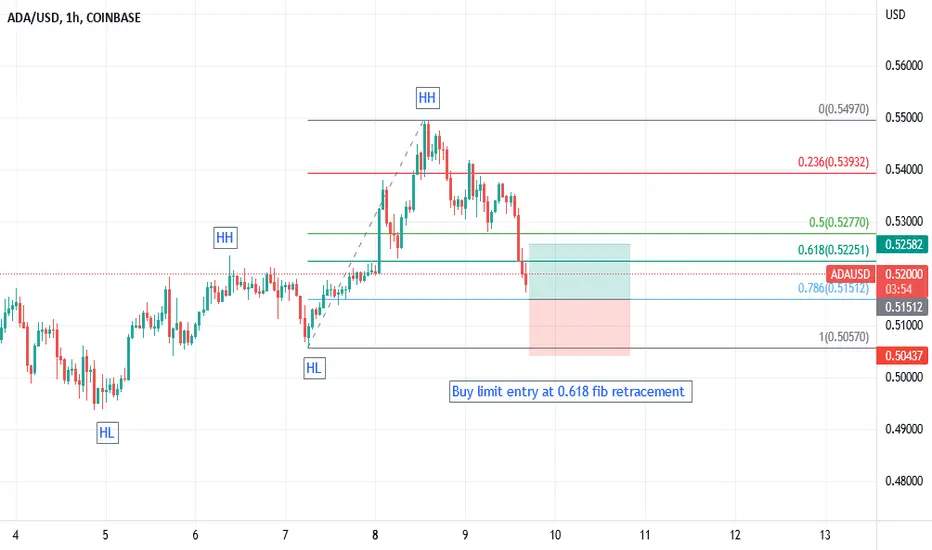
Long ADAUSDBuy limit entry due to
1. Series of higher highs and higher lows
2. Entry at 0.618 fib retracement level

ADAUSDT Future & Next 2-3 MonthADA
I like it!
It's very interesting one
After the large current correction it will pump to 3$ becouse of hard
fundamental background
Best wishes, guys!
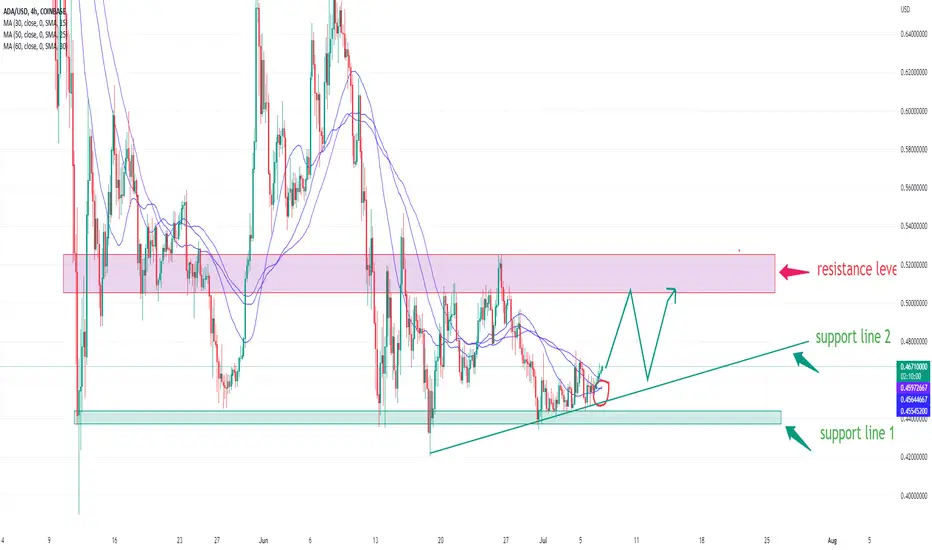
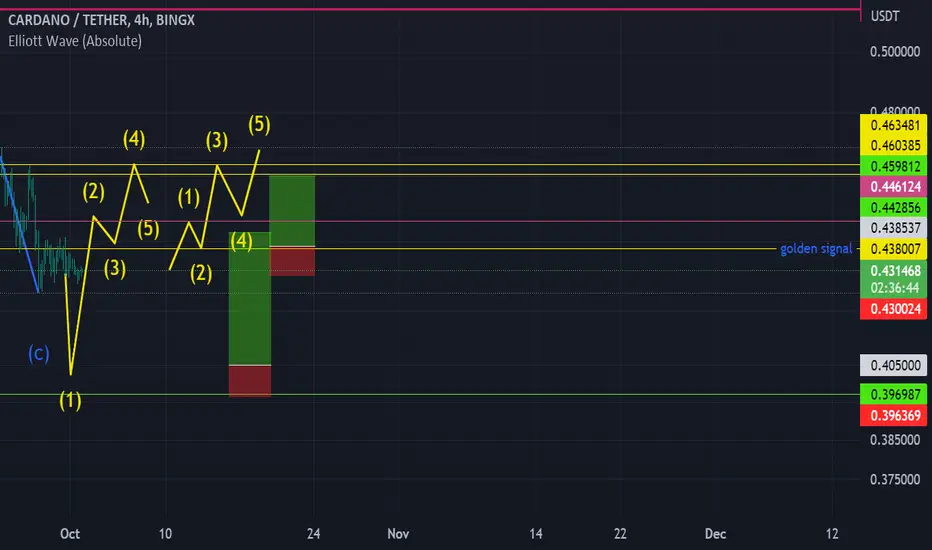
ADA, Swing Trading Reference, Is It Time To Buy?As shown in the figure,
1. The red area is the resistance band.
2. The green band and the green line are support levels
3. The 30/50/60 MA on the 4-hour chart is forming a golden cross, which is likely to continue higher.
4. The Macd indicator is already above the 0-axis, and it may continue to rise.
In conclusion, there is a lot of people waiting to buy at the support level, and the current entry expectation is smaller than the stop loss, I think swing trading is appropriate now.
Thoughts from a trader with 10 years of trading experience. If you feel the same way, please give me a like. If you have a different opinion, please leave a message and let me know.
Your following, comments and likes will be the motivation for me to continue my analysis.