Adausdlong
ADA Analyze by Daniyaldaraei CryptoCurrency master analyzerhello everyone , please like it and follow to reach more and gain more ;)
Cardano , after my last analyze that get two target reached and made a huge bullish rally
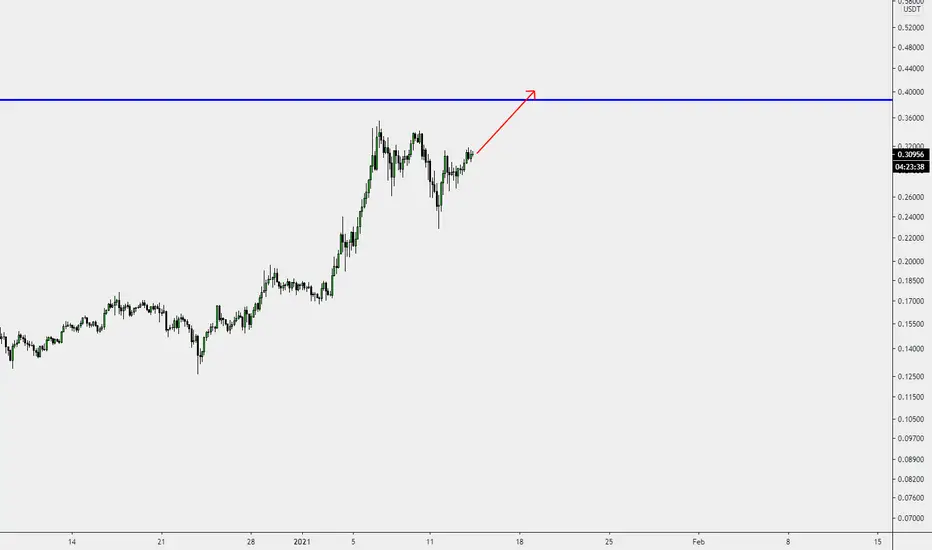
The bulls attempted to extend the uptrend on Jan. 7, but the bears aggressively sold above $0.340 that made a good correction to 0.2627
now we have ada cardano on 0.33-0.34 .
cardano have 0.354 resistance , and if bull could break it, we can simply reach 0.40 and 0.50 (psychological price action resistance )
and if bears could push it more down , of course with participating with BTC! we can reach to full retracement level at 0.2390
this analyze will get update soon
keep calm and hodl ADA

The Long Game with Cardano I don't really post much anymore as I am not actively trading. For this bull cycle I plan on just buying as much as I can now and riding it out for the next year.
Cardano is a long time favorite and I've been accumulating this one for a while. In July, Coinbase announced that Coinbase Custody would support Cardano staking. Around March 2021 Cardano plans on releasing Goguen which enables Smart Contracts and DApps to be made with the addition of expanding decentralization capabilities. Upon a successful release I expect Coinbase to announce that regular users will be able to buy and stake Cardano. At that point, I expect a retest of the previous high, $1.40, some time after. (Not saying ADA will get there but Tezos is a popular staking token on Coinbase and peaked at $4.44 back in August)
That, coupled with Bitcoin just getting started on this next cycle, is why I'm posting this today. If you want to make one buy and hold trade then Cardano is poised to perform well. You can also start staking as well and earn rewards.
Price Target: $1 by September
References
www.coindesk.com
roadmap.cardano.org

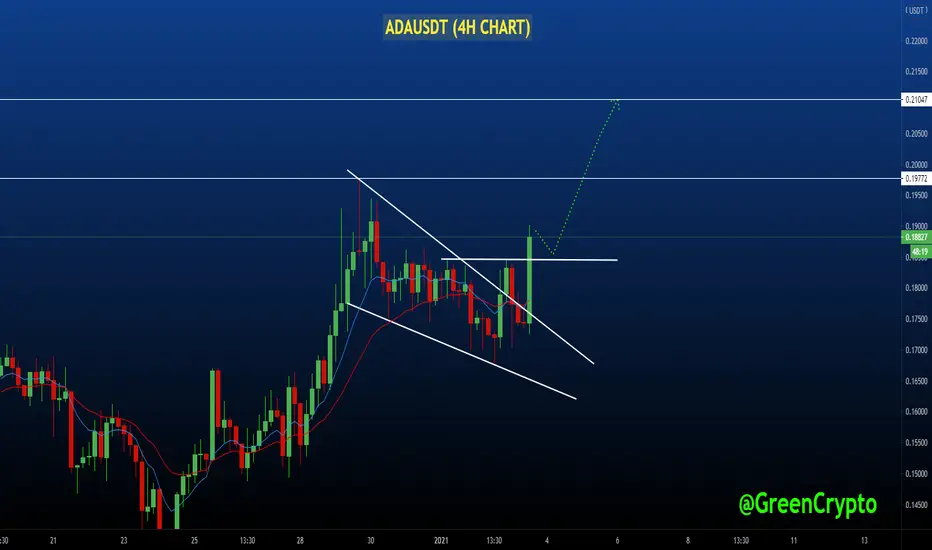
ADAUSDT (Falling Wedge Breakout)#ADAUSDT Technical Analysis Update
Falling Wedge Breakout
ADA/USDT currently trading at $0.187
LONG ENTRY level: $0.185 to $0.188
STOP LOSS: below 0.171
Target 1: $0,197
Target 2 :$0.210
Max leverage: 3X
ALWAYS KEEP STOP LOSS...
Follow our Tradingview Account for more Technical Analysis Update, | Like, Share and Comment your thoughts.
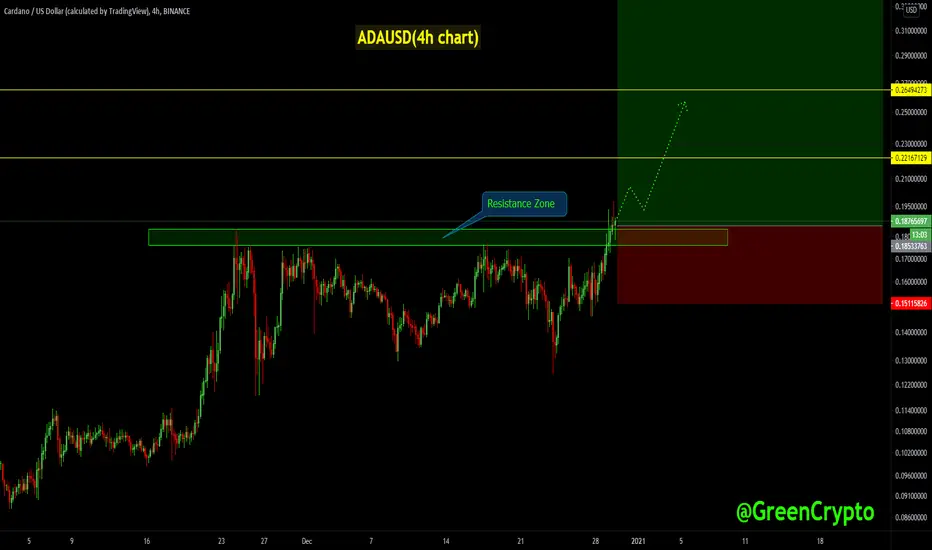
ADAUSDT (Resistance Zone Breakout)#ADUSDT Technical Analysis Update
Resistance Zone Breakout
ADA/USDT currently trading at $0.186
LONG ENTRY level: $0.183 - 0.190
STOP LOSS: below $0.150
Resistance level 1( Target 1): $0.220
Resistance level 2 ( Target 2): $0.265
Resistance level 3 (Target 3): $0.40
Max leverage: 3X
ALWAYS KEEP STOP LOSS...
Follow our Tradingview Account for more Technical Analysis Update, | Like, Share and Comment your thoughts.
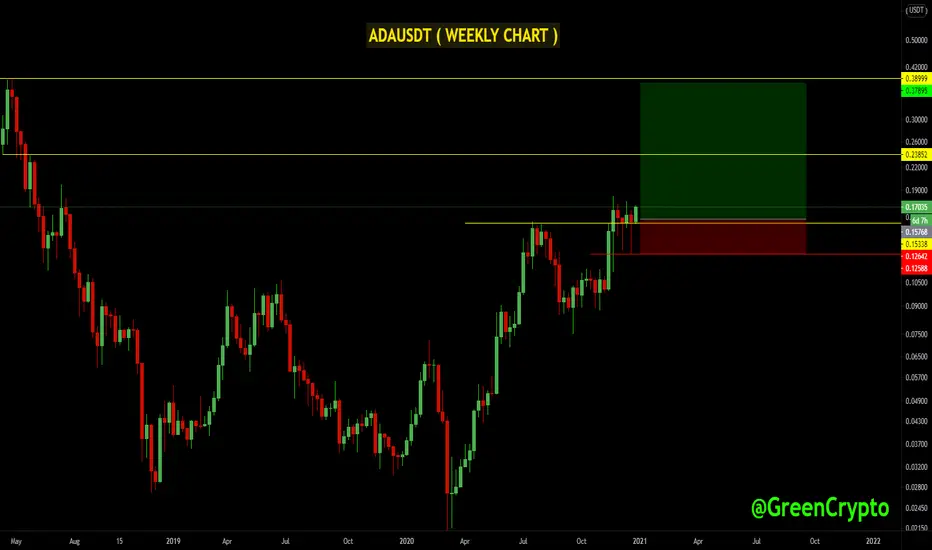
ADAUSDT (weekly Chart) Resistance level Breakout#ADAUSDT Technical Analysis Update
Resistance Breakout
ADA/USDT currently trading at $0.170
LONG ENTRY level: $0.150 TO $0.170
STOP LOSS: below $0.124
Resistance level 1( Target 1): $0.230
Resistance level 2 ( Target 2): $0.38
Max leverage: 2X
Risk Reward Ratio : 1: 7
ALWAYS KEEP STOP LOSS...
Follow our Tradingview Account for more Technical Analysis Update, | Like, Share and Comment your thoughts.
ADAUSDT(Resistance Breakout)#ADAUSDT Technical Analysis Update
Resistance Breakout
ADA/USDT currently trading at $0.1500
LONG ENTRY level: $0.1450 TO 0.1500
STOP LOSS: $0.1420
Resistance level 1( Target 1): 0.17400
Resistance level 2 (Target 2 ): $0.2000
Max Leverage: 4X
ALWAYS KEEP STOP LOSS...
Follow our Tradingview Account for more Technical Analysis Update, | Like, Share and Comment your thoughts

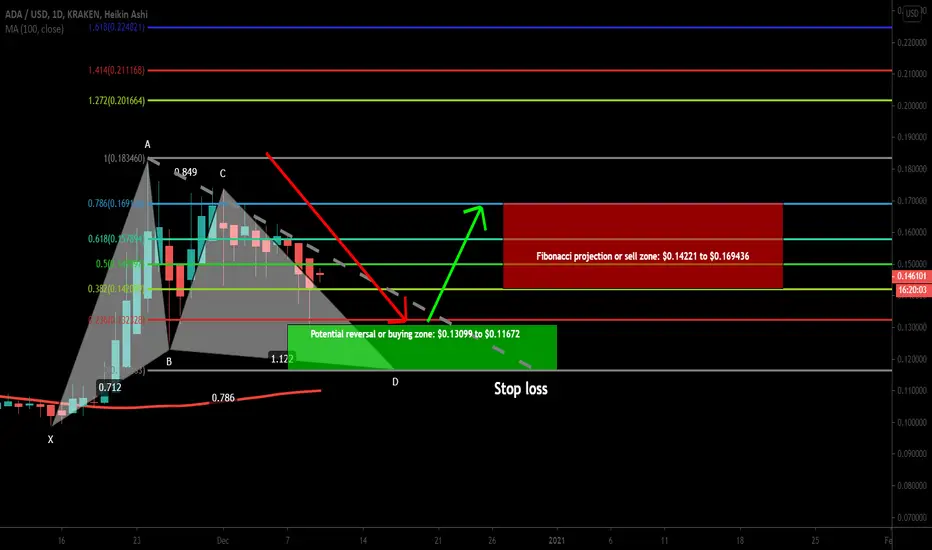
ADAUSD formed Gartley | Upto 45% move expectedOn daily chart, the price action of Cardano has completed bullish Gartley pattern and spiked in the potential reversal zone. It may give another chance to catch it from the PRZ level. There are also 100 simple moving average support below the potential reversal zone.
Buying And Sell Targets:
The buying and sell targets according to harmonic Gartley pattern should be:
Potential reversal or buying zone: $0.13099 to $0.11672
Fibonacci projection or sell zone: $0.14221 to $0.169436
Stop Loss:
The potential reversal zone area that is up to $0.11672 can be used as stop loss in case of complete candlestick closes below this level.
Possible profit and loss ratio:
As per above targets this trade has a profit possibility of 45% and as per the above-mentioned stop loss, the loss possibility is 11%.
Note: Above idea is for educational purpose only.
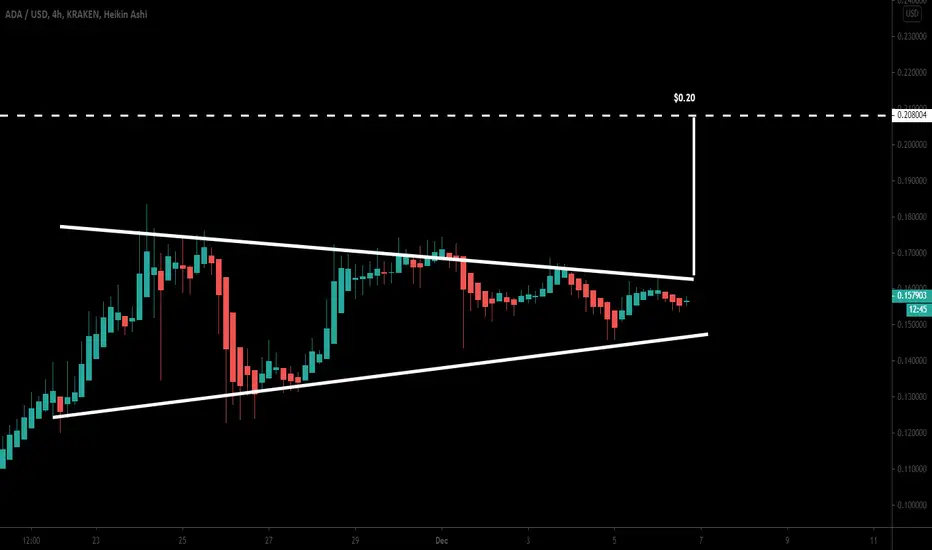
Cardano| A possible move upto $0.20Previously we have seen, on weekly chart, the priceline was at the support of an up trend line and now finally it has spiked from $0.10 to $0.18.
Up channel on long term chart:
Now on the weekly chart, the priceline has started its move in an up channel. At the moment it is at the resistance of this channel. There is also 25 simple moving average support above the support of channel and 50 SMA is also moving up to the support.
Wedge formation and a possible move to $0.20:
On 4 hour chart, the price action is moving in a wedge and rejected by the resistance. In case of breakout the price action of Cardano can reach at $0.20.
Down channel:
The priceline has also formed a down channel within the above wedge pattern. There is also 100 SMA at the support of this channel.
Harmonic Shark formaton:
On 2 hour chart, the priceline is also forming a bullish Shark. Now the potential reversal zone of this harmonic move starts from $0.1479 and ends up to $0.1440. This is the same level where we have the supports of wedge and channel on 4 hour chart.
Conclusion:
There is a strong possibility that the priceline will retest the supports of wedge and channel on 4 hour chart and then move up for breakout to hit $0.20 very soon. But if the price acton of ADA will break down these supports then it may re-test the support of an up channel on weekly chart that is at $0.10.
Why Short ADA Exactly here...Have you been trading ADA Recently?
I wanted to share this trading opportunity with you asap,
As this is the best point to enter the trade,
"This is a stupid simple analysis of ADA - No Complex BS I PROMISE"
If you see from the past few days,
ADA was going Parabolic & Creating Huge Surges In Prices,
Kinda Like A Rising Tide...
...but if you observe it carefully you would notice,
the market is exhausted, people are tired of buying ADA,
and you can see it clearly in the chart above,
where continuous tries to break previous highs,
Have been rejected Flat on the face,
like your girlfriend slapping your face when you propose to her.
We can use this opportunity to Short as the "Market is in our Favor" ,
but it won't be for a very long time as probability,
will spin the game upside down...
The risk we are taking is very negligible to the amount of money the market will give us,
for helping it move towards where it wants to go.
I'm looking to take profits as shown in the chart above at 3 different levels,
where at each level we make more money (P.s -- Risk keeps Increasing though, remember the wheel of probability will spin anytime).
..but if you place you short at this point there are very high chances of making a "Quick Profitable Trade".
I would love to know about your thoughts guys,
Share your thoughts in the comment below &
If you liked this Idea pls Upvote it so we can reach more traders & Keep Crushing Markets!
Thanks.

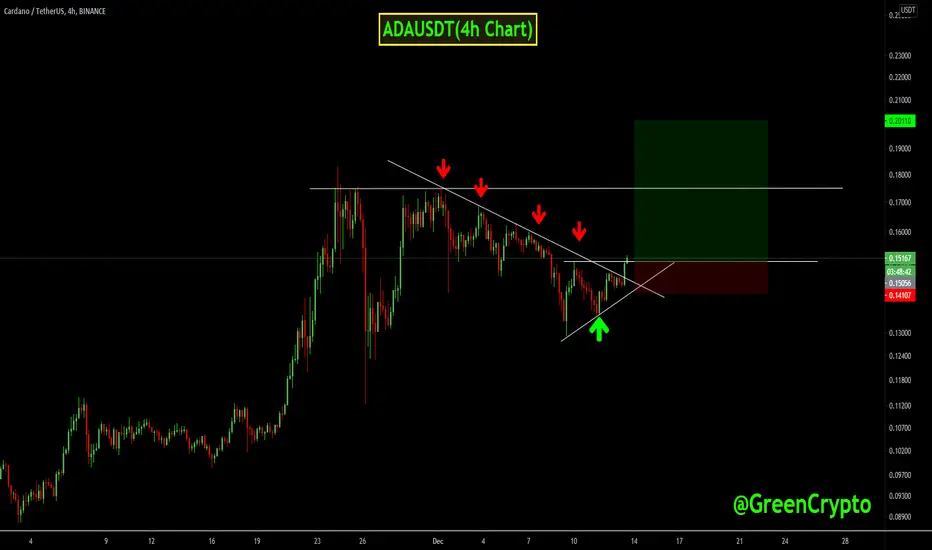
ADAUSDT (Ascending Triangle Breakout in 4h chart)ADA /USDT currently trading at $0.1470
Long Entry Level :$0.1460 - 0.1500( only enter long after 1-hour candle close above the resistance level at 0.14600$
STOP LOSS ( support): $ 0.1370
Resistance level 1(Target) : $0.1750
Resistance Level 2(Target): $0.1950
Resistance Level 3(Target):$0.2360
Max Leverage: 5X
Risk Reward ratio is 1:4
ALWAYS KEEP STOP LOSS...
Follow our Tradingview Account for more Technical Analysis Update, | Like, Share and Comment your thoughts

Cardano Coin price in Symmetrical Triangleprice in symmetrical triangle
buy at retest after the breakout no need to fomo in trade
market is going good

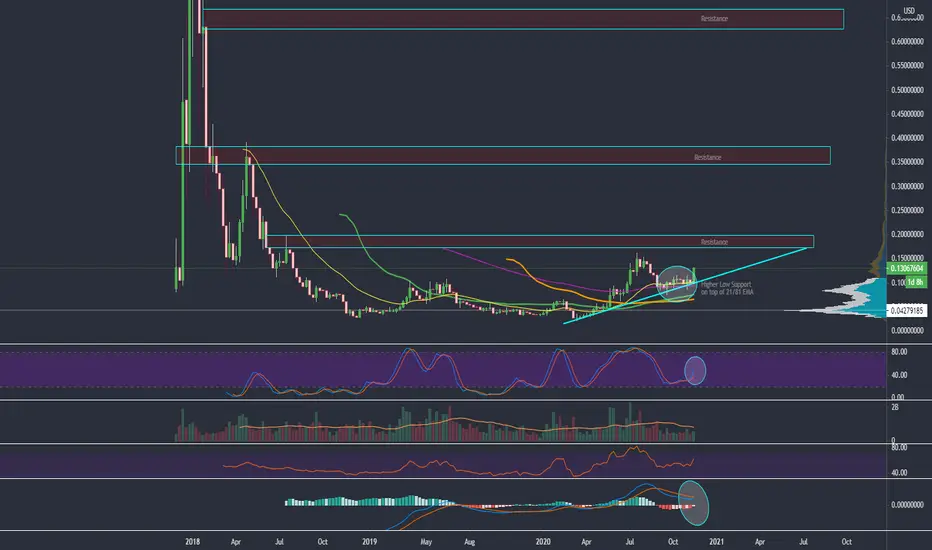
ADA to retest 0.17$ to 0.20$. ADA on the weekly chartA retest to 0.17$ - 0.20$ could form a relative bullish ascending triangle and also a completion of a 2 year cup and handle.
BTC dominance topping could be a catalyst for a breakout and BTC inching closer to 20k.
Cardano - Daily Update Bottom Line: Watching for evidence the wave ii of (i) correction ended.
Outlook: Expecting $ADA to recapture its 0.1542 high and beyond.
Analysis: Cardano has been in recovery mode. A break of 0.1542 is the next upside objective for the bulls. Higher in a subdividing wave iii patterns. The bulls are in control while 0.0756 stays intact as support. This is Key support for our outlook.
Key Levels:
Above 0.1140; 0.1279; 0.1542
Below 0.0882; 0756


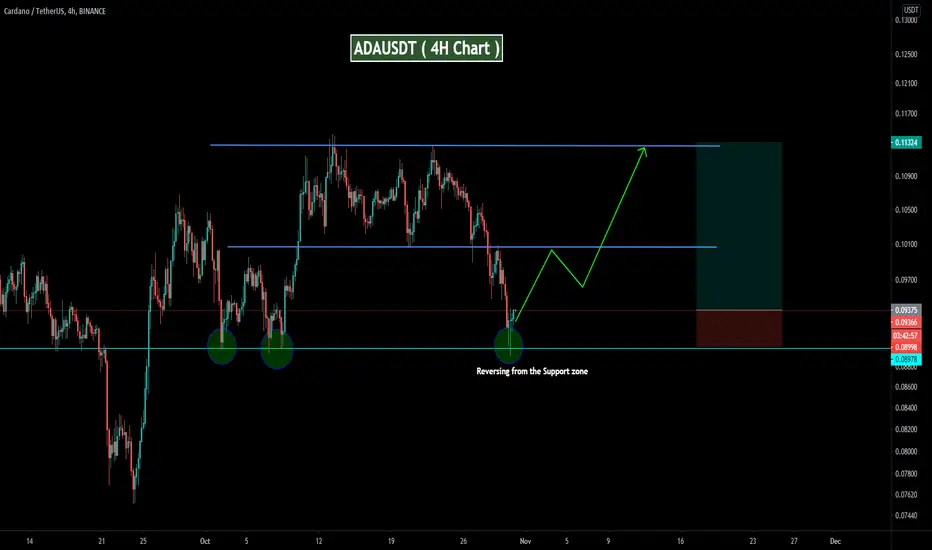
ADA/USDT (Reversing from the support line)ADAUSDT : Strong support at 0.089 and Now ADA started reversing from the strong support level.
Entry level : 0.089 - 0.093
Resistance level 1: 0.100
Resistance level 2: 0.113
Resistance level 3: 0.128
Resistance level 4: 0.153
Stoploss: below the support line (0.089)
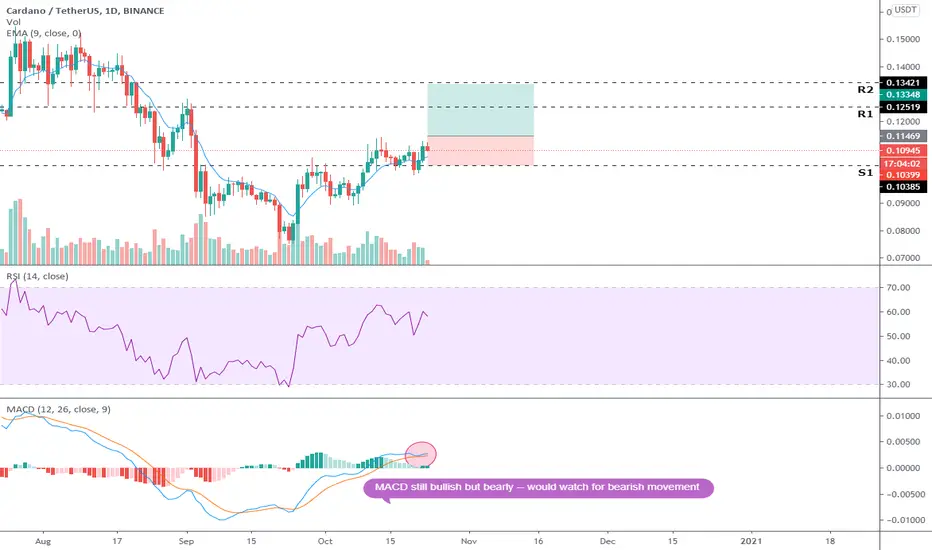
ADA/USDT (Short-term trade)ADA/USDT is presenting a good buy opportunity upon break of short--term resistance.
Next resistance (R2) presents good upside (a good place to TP)
RSI has room to grow on 1D
MACD still bullish, but may turn bearish (would watch before entry)
Stop loss @ 0.10399 USDT
The Crypto Associate is not responsible for any losses incurred during trading digital assets or any form of security. This analysis does not constitute investment advice and should not be regarded as such. All analyses is for informational purposes only.
ADAUSDT: Possible Short (13.10.2020)On D1, the price moves to the 38.2% Fibonacci level on a logarithmic scale. RSI is near the overbought level.
On H4, a movement has formed between the price and the RSI. Moreover, the RSI is at the overbought level.
We recommend selling ADAUSDT when the price will be broken the downward trend line on H4.

CARDANO 💥 by #rocketbomb 🚀💣Hello, dear friends! 🧡
Continue my hashtag #rocketbombquickidea for you🔥🔥
If you like such format of my quick analyzes, support idea with like 🧡. I'll try to find more opportunities for making 💰
Always in touch with you🧡
Sincerely Your Rocket Bomb🚀💣


Cardano to retest $0.095Cardano - Intraday - We look to Buy
Early optimism is likely to lead to gains although extended attempts higher are expected to fail.
Trend line resistance is located at 0.0950.
We look to buy dips.
Dip buying offers good risk/reward.
However, with the intraday chart now highlighting lower highs we are possibly forming a descending triangle pattern.
We look for a temporary move higher.
Our profit targets will be 0.0942 and 0.0948
Resistance: 0.0920 / 0.0940 / 0.0950
Support: 0.0910 / 0.0900 / 0.0890
Signal Centre
