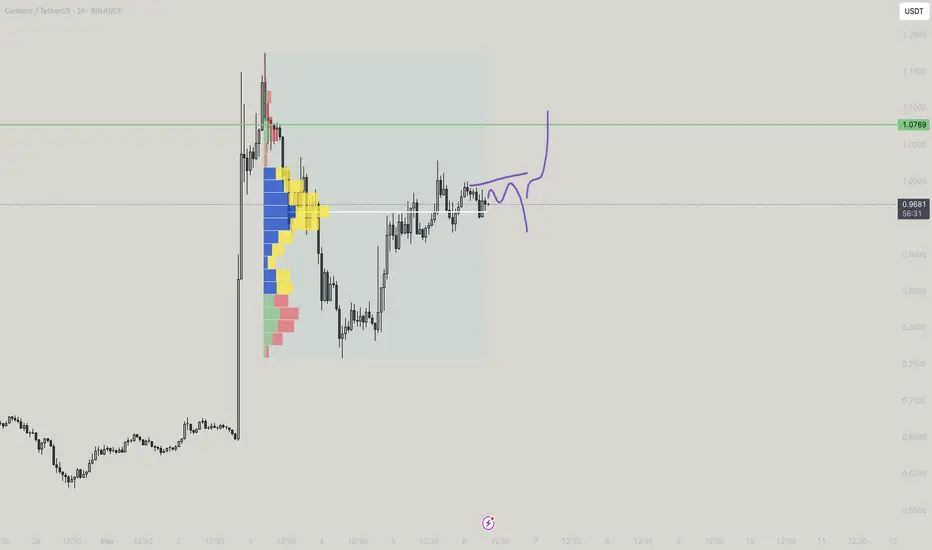
Cardano (ADA) Swing Trade SetupWith ADA approaching a key support level, this presents a strong risk-to-reward opportunity for a long swing trade. If buyers step in at this level, we could see a move towards upside resistance zones.
🛠 Trade Details:
Entry: Around $0.70 (Support Level)
Take Profit Targets:
$0.82 - $0.89 (First TP Zone - Initial Resistance)
$0.96 - $1.02 (Second TP Zone - Major Resistance)
Stop Loss: Just below $0.63
Waiting for buying confirmation at support before entering. 🚀
ADAUSDT

ADA/USDT 1H: Accumulation Phase Holding – Can $0.760 Be ReachedADA/USDT 1H: Accumulation Phase Holding – Can $0.760 Be Reached?
🚀 Follow me on TradingView if you respect our charts! 📈 Daily updates!
Current Market Conditions (Confidence: 7/10):
Price at $0.7331, currently consolidating after a breakout.
RSI momentum is building from mid-levels, indicating increasing strength.
Hidden bullish divergence forming on the 1H timeframe, signaling potential continuation.
LONG Trade Setup:
Entry: $0.730 - $0.732 zone.
Targets:
T1: $0.745 (initial resistance).
T2: $0.760 (extended target).
Stop Loss: $0.715 (below recent support).
Risk Score:
7/10 – Decent risk-to-reward, but requires confirmation of continued momentum.
Market Maker Activity:
Accumulation phase visible after a recent liquidity sweep at $0.69.
Strong support has formed at $0.72, reinforcing bullish potential.
Order blocks suggest further upside potential, as Smart Money positions for the next move.
Recommendation:
Long positions remain favorable in the $0.730 - $0.732 entry zone.
Monitor reaction at $0.745, as resistance could trigger a short-term pause.
Use tight stops, as consolidation could extend before continuation.
🚀 Follow me on TradingView if you respect our charts! 📈 Daily updates!

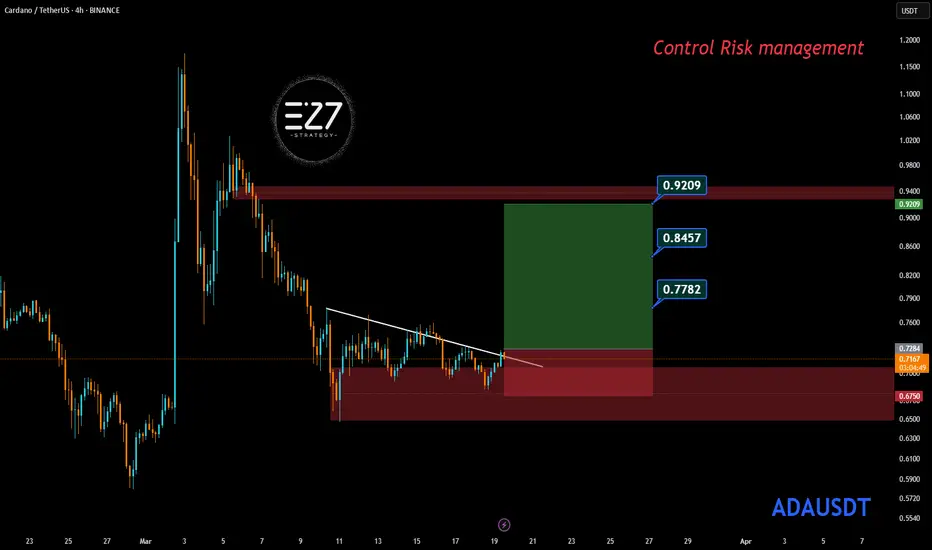
ADAUSDTADAUSDT Signal 📉
📌 Current Price: 0.7161 USDT
📊 Trend: Bearish ⬇️, but testing a descending trendline 📏
🔑 Key Levels:
🔼 Resistance: 0.9209 🛑
🔽 Support: 0.7782–0.8457 🟢
📉 Next Support: 0.6750 ⚠️
📢 Signal:
🔴 Short (Sell): Enter at 0.7161 if price rejects the trendline.
🎯 TP: 0.6750 | 🛑 SL: 0.7500
🟢 Long (Buy): If price breaks above 0.7284, target 0.7782–0.8457.
🎯 TP: 0.7782–0.8457 | 🛑 SL: 0.7000
⚖️ Risk Management: Use 1:2 risk-to-reward ratio. Control risk as highlighted.
🔍 Monitor for a trendline break! 🚨
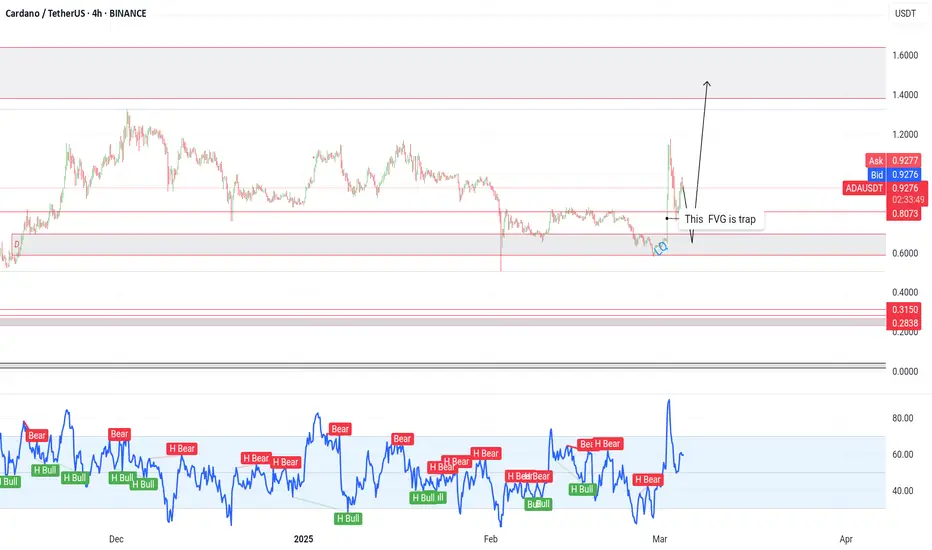
ADA: Current SituationYou asked, and we delivered:
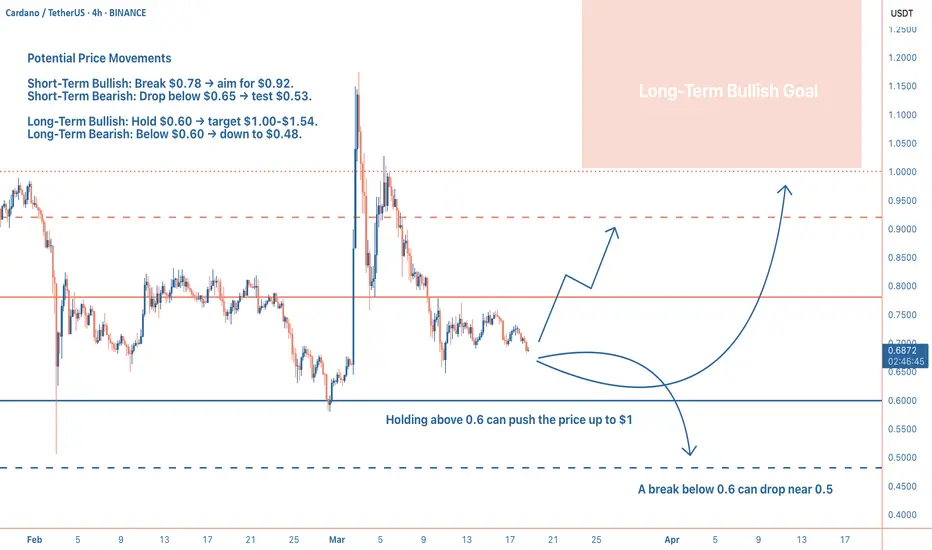
Cardano (ADA) is currently trading at $0.688, reflecting a volatile yet pivotal moment amid a broader crypto market downturn, with the total market cap down 4.4% over the past 24 hours. Some traders see a falling wedge pattern on the 4-hour chart pointing to a potential breakout, while others note whale activity dumping 100M ADA, suggesting selling pressure. Despite this, ADA’s fundamentals, like its 92M organic transactions and $380M daily DEX volume, hint at underlying strength. The market’s cautious mood, combined with Cardano’s utility-driven ecosystem, sets the stage for a critical juncture.
Technical Indicators and Key Levels
Short-Term (1-Hour and 4-Hour Charts):
Support: $0.65-$0.68 – A key demand zone holding firm so far; $0.53 if selling intensifies.
Resistance: $0.78 – A breakout here could signal bullish momentum; $0.92 as the next target.
Indicators: RSI at ~46 (neutral with upside room), MACD showing bearish momentum. A falling wedge on the 4-hour chart suggests a possible reversal if volume supports a break above $0.78.
Long-Term (Weekly Chart):
Support: $0.60 – A major floor; $0.48 if a deeper correction hits.
Resistance: $1.00 – Psychological and historical barrier; $1.54 as a 2026 target per some forecasts.
Indicators: The 200-day MA is falling, reflecting long-term pressure, but a rising 50-day MA below the price could act as support if tested.
Potential Scenarios
Short-Term:
Bullish Case: If ADA holds $0.68 and breaks $0.78 with strong volume, it could rally to $0.92 or higher. This aligns with the falling wedge breakout narrative from X posts.
Bearish Case: A drop below $0.65 might test $0.53, especially if whale selling persists and volume confirms the move.
Long-Term:
Bullish Case: Holding $0.60 could set up a climb to $1.00 by late 2025, with potential to hit $1.54 in 2026 if adoption grows and market sentiment flips.
Bearish Case: A break below $0.60 risks a slide to $0.48, though fundamentals like network activity could cushion the fall.
Broader Context and Tips
ADA’s strength lies in its research-driven blockchain, scalable PoS consensus, and growing DeFi ecosystem. Long-term, its utility could drive value, but short-term volatility ties to market trends and macro events (e.g., US CPI data). Traders should watch $0.78 for a breakout signal and $0.65 for downside risk, volume will tell the story. Use tight stops (e.g., below $0.65 for longs) and stay alert for news on adoption or whale moves. Investors can lean on Cardano’s fundamentals but should brace for choppiness until the market stabilizes.
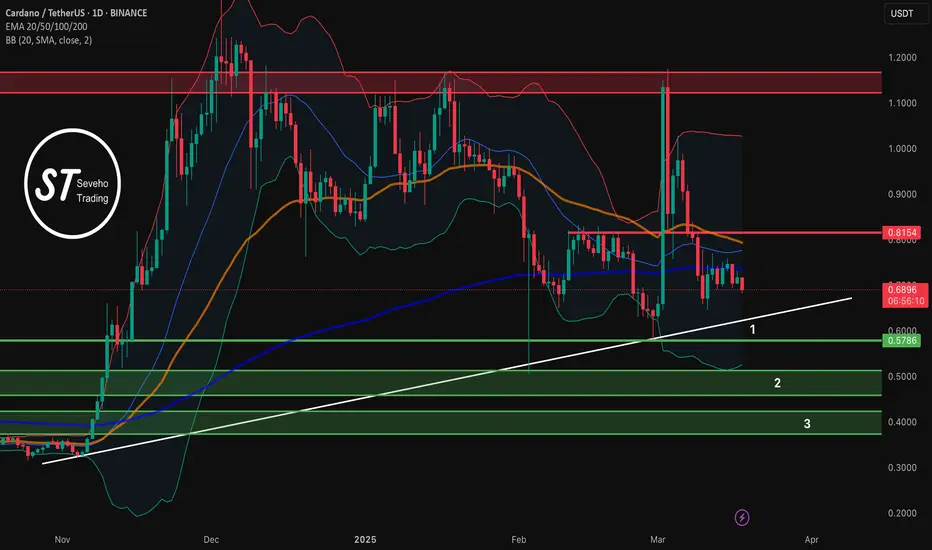
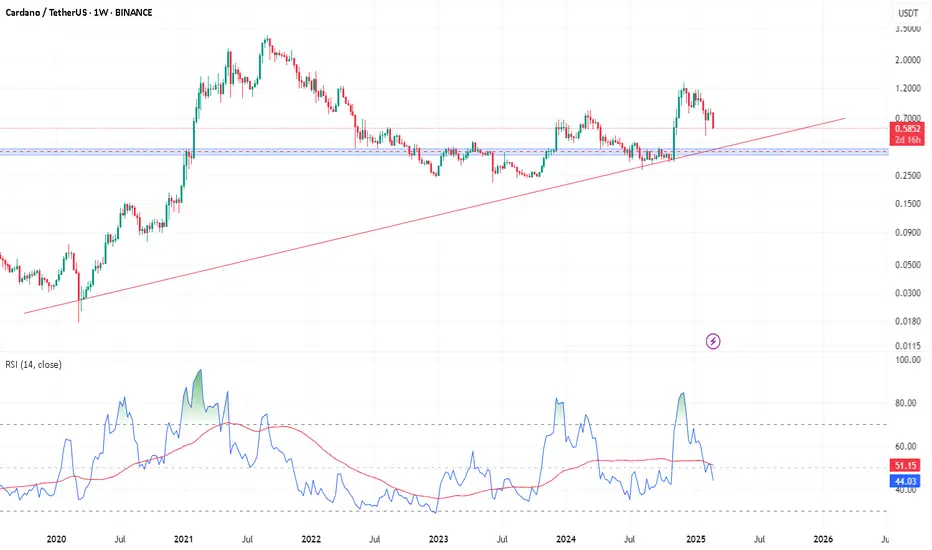
Cardano Update: Short-Term Price Action & Long-Term AnalysisThe crypto market is at a pivotal moment, and Cardano (ADA) is no exception. As we approach the highly anticipated Federal Reserve meeting tomorrow, where interest rate decisions will shape global liquidity, ADA finds itself at a critical juncture both fundamentally and technically.
The Macro Picture – Fed, Liquidity, and Risk Sentiment
Tomorrow’s Fed decision could set the tone for risk assets, including cryptocurrencies. A dovish stance, hinting at potential rate cuts, could fuel bullish momentum in the market, driving investors into speculative assets like ADA. On the flip side, a more hawkish Fed—indicating prolonged high rates—might put additional pressure on ADA, making lower support levels a real possibility.
Meanwhile, broader market sentiment is mixed. Bitcoin’s recent consolidation has left altcoins struggling for clear direction, and ADA is no exception. The question remains: will we see a bounce from current levels, or is further downside in the cards?
Technical Setup – A Make-or-Break Moment
Looking at the 1W chart, ADA is currently sitting on a key ascending support line that has been respected for months. This trendline, marked in white, has historically acted as a launchpad for price rebounds. Losing this level could result in a breakdown toward the deeper support zones marked on the chart.
We also see major resistance at $0.8154, where sellers have repeatedly stepped in. To reclaim bullish momentum, ADA must break above this level convincingly. However, if the price fails to hold above the $0.6860 region, things could turn bearish quickly.
EMA & Bollinger Bands – Signs of Compression
The 50 EMA (orange) and 200 EMA (blue) are key indicators to watch. A sustained move below the 50 EMA suggests that ADA is struggling to regain upward momentum. If the 200 EMA is tested, it could act as the last line of defense before a deeper correction.
The Bollinger Bands also indicate a period of price compression, hinting at an imminent breakout. The narrowing bands suggest that volatility is about to increase—either to the upside or downside, depending on how ADA reacts to macro events and technical levels.
Key Support Zones – Where Bulls Might Step In
I've marked three critical zones on the chart that could act as potential areas of interest for buyers:
1. Current Level (~$0.68 - $0.60): This is the first line of defense. If ADA holds this area, we could see a rebound, especially if the Fed decision sparks bullish sentiment.
2. Mid-Zone (~$0.50 - $0.45): If the first support fails, this level could serve as a strong accumulation zone, where buyers have previously stepped in.
3. Final Support (~$0.40 - $0.35): If ADA reaches this level, it could signal a deeper correction before any meaningful recovery.
The Final Verdict – A High-Stakes Scenario
ADA is at a turning point. If the trendline support holds and the Fed decision aligns with market expectations, we could see a strong bounce toward resistance at $0.8154 and beyond. However, if sellers push the price below key support levels, we could be looking at a deeper retracement.
For now, all eyes are on tomorrow’s Fed decision—will it provide the fuel for a breakout, or will we see another leg down? The coming days will be crucial for ADA’s next big move.
Short term trade for CardanoShort-term trade for Cardano
Let us see how this ADA trade will go. I hope fundamentals favour it.
It is a RR trade of 1:2
We need patience to activate this trade.

ADA/USD "Cardano vs U.S Dollar" Crypto Market Heist Plan🌟Hi! Hola! Ola! Bonjour! Hallo! Marhaba!🌟
Dear Money Makers & Thieves, 🤑 💰🐱👤🐱🏍
Based on 🔥Thief Trading style technical and fundamental analysis🔥, here is our master plan to heist the ADA/USD "Cardano vs U.S Dollar" Crypto Market. Please adhere to the strategy I've outlined in the chart, which emphasizes short entry. Our aim is the high-risk Green Zone. Risky level, oversold market, consolidation, trend reversal, trap at the level where traders and bullish thieves are getting stronger. 🏆💸Book Profits Be wealthy and safe trade.💪🏆🎉
Entry 📈 : "The vault is wide open! Swipe the Bearish loot at any price - the heist is on!
however I advise placing Sell limit orders within a 15 or 30 minute timeframe. Entry from the most recent or closest low or high level should be in retest.
Stop Loss 🛑: Thief SL placed at (0.7000) swing Trade Basis Using the 3H period, the recent / swing high or low level.
SL is based on your risk of the trade, lot size and how many multiple orders you have to take.
Target 🎯: 0.5200 (or) Escape Before the Target
🧲Scalpers, take note 👀 : only scalp on the Short side. If you have a lot of money, you can go straight away; if not, you can join swing traders and carry out the robbery plan. Use trailing SL to safeguard your money 💰.
📰🗞️Fundamental, Macro, COT Report, Sentimental Outlook:
ADA/USD "Cardano vs U.S Dollar" Crypto Market is currently experiencing a Bearish trend in short term, driven by several key factors.
⚡⭐Fundamental Analysis
Market Capitalization : Cardano's market capitalization stands at $23.12 billion USD, with a circulating supply of 35.21 billion ADA.
Tokenomics : The total supply of ADA is capped at 45 billion, with a significant portion already in circulation.
Blockchain Technology : Cardano's blockchain technology is based on the Ouroboros consensus algorithm, which provides a secure and energy-efficient way to validate transactions.
Development Activity : The Cardano development team is actively working on improving the blockchain's scalability, interoperability, and usability.
Partnerships and Collaborations : Cardano has partnered with various organizations, including universities, research institutions, and businesses, to promote the adoption of its blockchain technology.
⚡⭐Macro Economics
Inflation : The current inflation rate is not explicitly stated, but it's essential to consider its impact on the cryptocurrency market. Rising inflation can lead to increased adoption of cryptocurrencies as a store of value.
Interest Rates : Interest rates can influence the attractiveness of cryptocurrencies like ADA. Higher interest rates can make traditional investments more attractive, potentially reducing demand for cryptocurrencies.
Global Economic Growth : The global economy is experiencing a slowdown, which can impact the demand for cryptocurrencies. However, some investors may view cryptocurrencies as a safe-haven asset during times of economic uncertainty.
Regulatory Environment : The regulatory environment for cryptocurrencies is constantly evolving. Changes in regulations can impact the adoption and price of cryptocurrencies like ADA.
⚡⭐Global Market Analysis
Trend: The ADA/USD pair is experiencing a mixed trend, with a 4.27% increase in the last 24 hours, but a 12.92% decrease in the last week.
Support and Resistance: Key support levels are at $0.63 and $0.61, while resistance levels are at $0.68 and $0.70.
⚡⭐COT Data
Speculators (Non-Commercials): The current COT report shows that speculators are holding 26,729 long positions and 9,961 short positions.
Hedgers (Commercials): Hedgers are holding 7,275 long positions and 24,341 short positions.
⚡⭐On-Chain Analysis
Transaction Volume: The 24-hour transaction volume for ADA is approximately $868.36 million USD.
Active Addresses: The number of active addresses on the Cardano network is not provided.
⚡⭐Market Sentiment Analysis
Sentiment: The overall sentiment for ADA/USD is neutral, with a mix of bullish and bearish predictions.
Fear and Greed Index: The current fear and greed index reading is not available.
⚡⭐Positioning
Long/Short Ratio: The long/short ratio for ADA/USD is not provided.
Open Interest: The open interest for ADA/USD is approximately $776.6 million USD.
⚡⭐Next Trend Move
Bullish Prediction: Some analysts suggest a potential bullish move, targeting $0.70 and $0.80.
Bearish Prediction: Others predict a potential bearish move, targeting $0.52 and $0.50, due to the recent downward trend and potential selling pressure.
⚡⭐Overall Summary Outlook
Bullish or Bearish: The overall outlook for ADA/USD is neutral, with a mix of bullish and bearish predictions.
Real-Time Market Feed: As of the current time, the ADA/USD price is $0.66, with a 0.42% increase in the last 24 hours.
📌Keep in mind that these factors can change rapidly, and it's essential to stay up-to-date with market developments and adjust your analysis accordingly.
⚠️Trading Alert : News Releases and Position Management 📰 🗞️ 🚫🚏
As a reminder, news releases can have a significant impact on market prices and volatility. To minimize potential losses and protect your running positions,
we recommend the following:
Avoid taking new trades during news releases
Use trailing stop-loss orders to protect your running positions and lock in profits
💖Supporting our robbery plan 💥Hit the Boost Button💥 will enable us to effortlessly make and steal money 💰💵. Boost the strength of our robbery team. Every day in this market make money with ease by using the Thief Trading Style.🏆💪🤝❤️🎉🚀
I'll see you soon with another heist plan, so stay tuned 🤑🐱👤🤗🤩

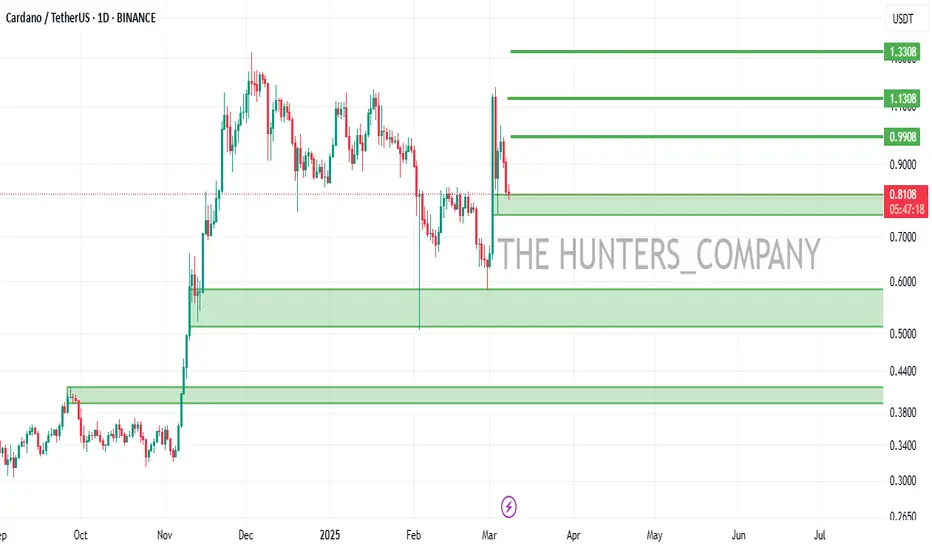
Can Cardano hold $1, or will it drop to $0.74?Hello and greetings to all the crypto enthusiasts, ✌
All previous targets were nailed ✅! Now, let’s dive into a full analysis of the upcoming price potential for Cardano 🔍📈.
Cardano broke out of its downward channel on positive news but quickly retraced its gains. It now trades near the key psychological level of $1, with major monthly support below. Losing this support could trigger a decline of at least 20%, targeting $0.74. This level aligns with a crucial daily support zone, making it a key area to watch.📚🙌
🧨 Our team's main opinion is: 🧨
Cardano briefly surged on positive news but quickly dropped back, now hovering near $1; losing key support could trigger a 20% drop to around $0.74. 📚🎇
Give me some energy !!
✨We invest hours crafting valuable ideas, and your support means everything—feel free to ask questions in the comments! 😊💬
Cheers, Mad Whale. 🐋

ADA on high time frame
"Hello traders, focusing on ADA on high time frames, the candle formations suggest a zone that may entice many to buy. However, as a holder, I believe it's prudent to await further price information. I will continue to monitor the situation and update my analysis accordingly."
If you need further assistance or have any specific questions, please feel free to let me know!
#ADA/USDT#ADA
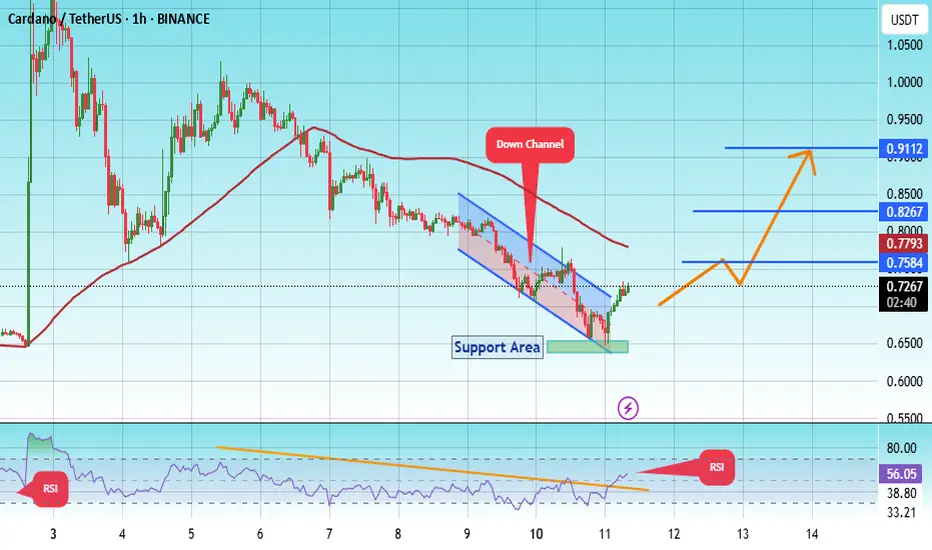
The price is moving in a descending channel on the 1-hour frame and is adhering to it well and is heading to break it upwards strongly and retest it
We have a bounce from the lower limit of the descending channel, this support is at a price of 0.5923
We have a downtrend on the RSI indicator that is about to break and retest, which supports the rise
We have a trend to stabilize above the moving average 100
Entry price 0.6615
First target 0.7111
Second target at 0.7585
Third target at 0.8205
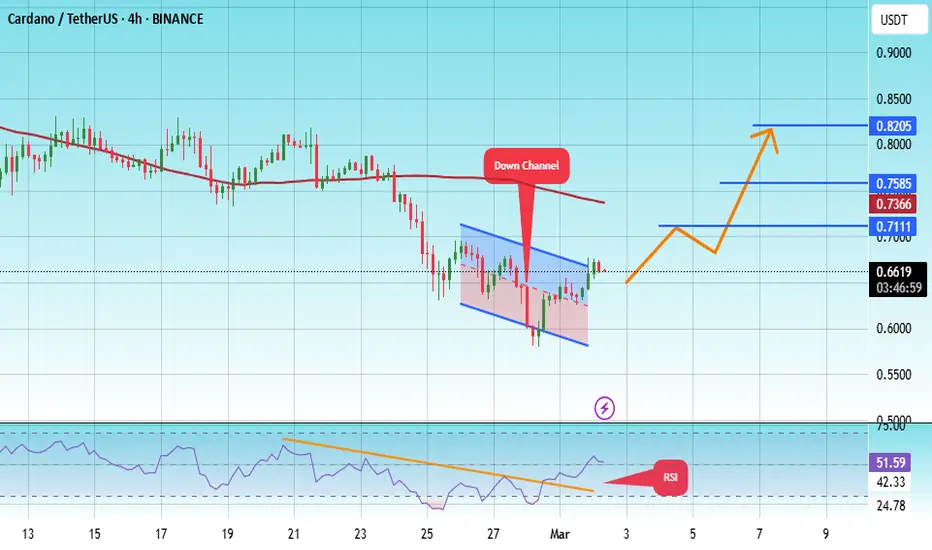
#ADA/USDT#ADA
The price is moving in a descending channel on the 1-hour frame and is adhering to it well and is heading to break it strongly upwards and retest it
We have a bounce from the lower limit of the descending channel, this support is at a price of 0.6400
We have a downtrend on the RSI indicator that is about to be broken and retested, which supports the rise
We have a trend to stabilize above the moving average 100
Entry price 0.7280
First target 0.7584
Second target 0.8267
Third target 0.9112
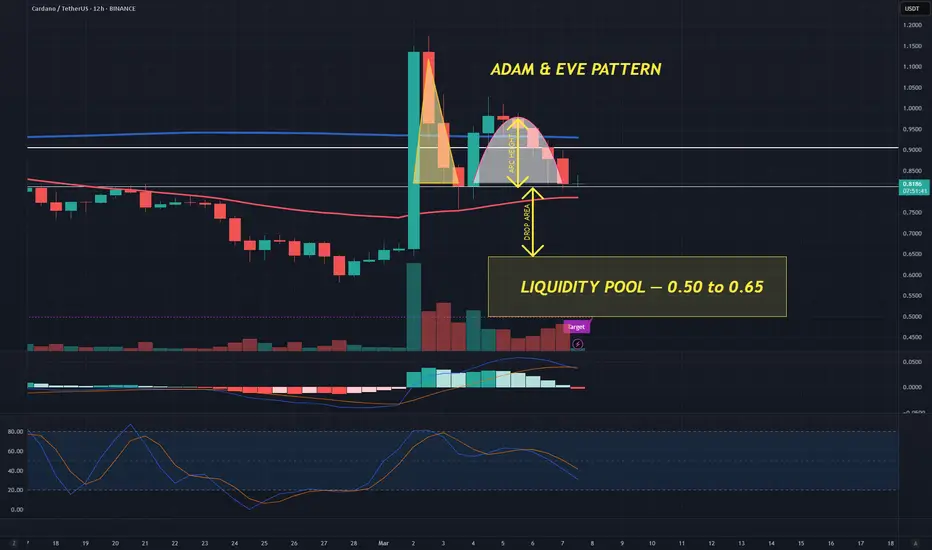
ADA meets ADAM & EVEBearish outlook for ADA as it has formed an Adam & Eve pattern on the 12 hour view.
If ADA falls below 0.80 for enough time, the retest to below 0.70 will be a likely scenario.
This is a Double Top Adam and Eve trading pattern, potentially showing a trend reversal (its accuracy isn't guaranteed) Usually this is 65% to 75% accurate.
Under 0.03 ADA!The market shows us all cryptos will have big fall.
ADAUSDT seems that touch a price under 0.03!
Cardano Update: Short-Term Price Action & Long-Term AnalysisCardano here is revealing a bullish situation. Let's review the basics first.
The correction bottom low came in early February, on the third. Then a higher low happened on the 28th. Good. This higher low was followed by a strong bullish breakout on Trump news. Notice how the retrace remains really strong.
The low 28-Feb reached $0.5803. The low 4-March reached $0.7574. This is 30% higher compared to 28-Feb. Compared to 3-Feb, the most recent low is 51% higher. This reveals a bullish bias.
Even while there is a retrace the action is happening far away from support. This means that buyers are present, bears are weak. Volume. Ok.
Notice the volume. Very low volume on the descent.
Whatever you do, whatever you think will happen next, buy and hold steady, Cryptocurrency will grow. The Altcoins will grow. This chart is bullish and the recent breakout from a falling wedge pattern and current price action proves so.
There is no lower low possible on this chart. There is possibility for a little lower but that is not my guess nor my bet. The best the bears can do is push prices a little bit lower and create a new great entry for us, a great entry because we are going up next.
I think we will see higher prices almost right away. This bearish action is no bearish, I see only a simple retrace, classic reaction after a strong jump. Since this is classic, even more classic is a continuation after a higher low. The continuation will strong because the initial breakout was strong.
One thing to keep in mind though, we are entering a phase of long-term growth. So it will be mixed with some doubts while prices grow.
If in doubt, ever, just zoom-out. The chart is clear. Cardano is set to grow. It will continue growing long-term.
Below is the full long-term analysis including a potential target for a new All-Time High in 2025, this analysis is still valid today:
Thank you for reading.
Namaste.

ADA/USDT BUYHello friends
Given that the price has reached resistance and the price has corrected, the best conditions are now in place to buy in stages and with capital management. We have also specified price targets for you.
*Trade safely with us*
Here is why I think Cardano will be 9 USD in SeptemberPrice currently forming a bullish flag and we are currently in what I think Phase 4 of Wyckoff accumulation which is LPS or Back Up phase. IF Price goes to 24 Fibonacci level it will go to 25 but I think 9 is a realistic target.
Disclaimer: Not a financial advice. Do your own analysis

ADA | UPDATE | Heading for BIG THINGS ??Lace Light Wallet has announced the release of Daedalus 7.1.0 for Cardano, which introduces various security improvements and bug fixes.
This might be particularly important , considering the recent hack on ByBit where billions of dollars worth of ETH was allegedly stolen by the Lazarus group. (More on that, here:)
The price reacted positively briefly to the news, until whales took the opportunity to "sell the news", as we are currently seeing a correction in both the daily and the weekly timeframe:
Ada is likely on par for a further correction, should the current support level not hold. The next zone would be retesting the wick:
It's possible that with these continued improvements, Cardano could be a sleeping giant, waiting for it's moment to shine - in which case, given the functionality is there, the price could easily double from the previous ATH.
_________________ BINANCE:ADAUSDT
Massive Macro Retest: Expecting $1 on ADA, Should Be Bottoming SCRYPTOCAP:ADA has an extremely clean chart, and I think there's a good chance of a move from here after filling the wick and retesting the macro SR flip level.
The current downtrend will expire on March 10th (one of the fastest to expire), so we expect to be a first mover once we see a bounce.
I've bought some here and will continue to add below 60c.
I'm targeting close to $1 and will re-evaluate if it shows greater strength. $CARDANO BINANCE:ADAUSDT

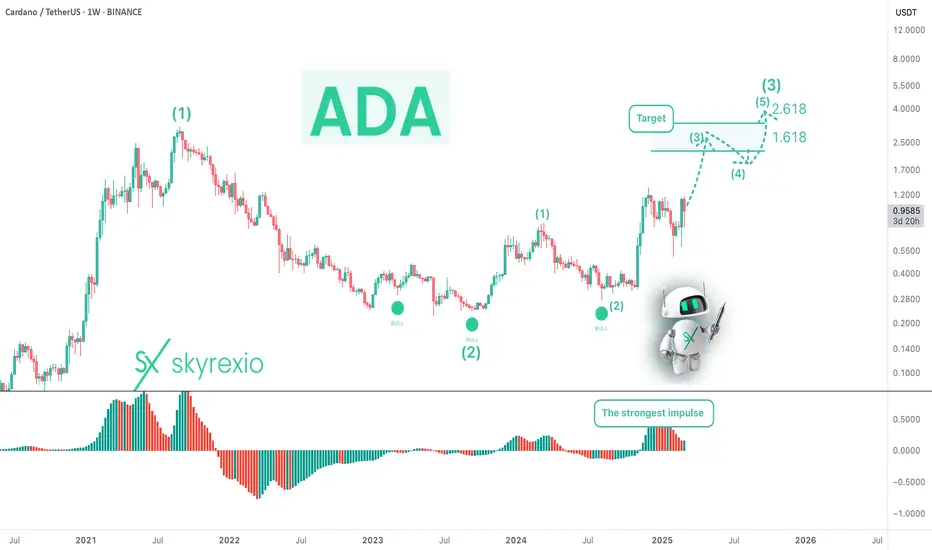
Cardano ADA Is The Best Donald Trump's Coin EverHello, Skyrexians!
We have already made a lot of analysis on BINANCE:ADAUSDT and all of them plays out great, this coin is very technical moving, so we can predict them with the high probability. Donald Trump recently announced that ADA will be in reserve, so we have to understand how it can affect the price action.
Let's take a look at the weekly time frame. You can see that after a green dot on Bullish/Bearish Reversal Bar Indicator the impulsive waves 1 and 3 have been started. In our opinion now the wave 3 is about to continue. Awesome Oscillator has the highest value in this bull run that's why this is can be only wave 3. The targets are very high. Now we can say that they are located between $2 and $3.5 with the final bull run target at $5.
Best regards,
Skyrexio Team
___________________________________________________________
Please, boost this article and subscribe our page if you like analysis!
ADA - Top/Down? ADA has already moved like TRX but without news it would slowly die, like slowly slowly, but yes aim for green!
ADA/USDT: LONG !hello friends
Due to the price correction, now is a good opportunity to buy in steps.
Note that the best way to buy a ladder is to not suffer a loss if the price changes.
We have specified price targets for you.
*Trade safely with us*
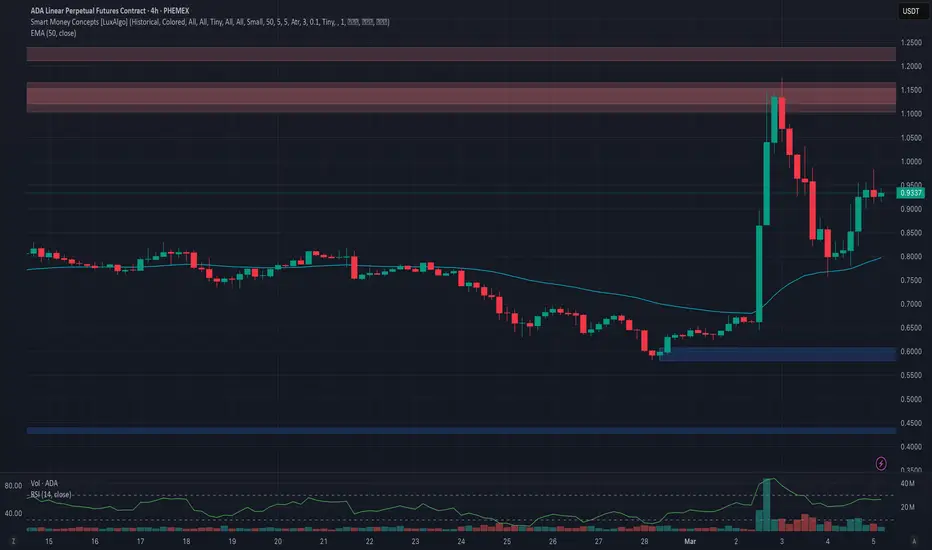
Phemex Analysis #64: Pro Tips to Trade Cardano (ADA)The cryptocurrency market was recently jolted by President Donald Trump's announcement on March 2, 2025, of the establishment of a U.S. "Crypto Strategic Reserve." This initiative aims to position the United States as the "crypto capital of the world" and includes major cryptocurrencies such as Bitcoin ( PHEMEX:BTCUSDT.P ), Ethereum ( PHEMEX:ETHUSDT.P ), Ripple ( PHEMEX:XRPUSDT.P ), Solana ( PHEMEX:SOLUSDT.P ), and notably, Cardano ( PHEMEX:ADAUSDT.P ).
The immediate market reaction was swift and dramatic. Cardano's price surged by over 78%, reaching a four-month high of $1.19 on March 3, 2025. However, this bullish momentum was short-lived, as ADA's price retraced to lowest $0.75 by March 4, reflecting a 36% decline from its recent peak. At the time of writing, ADA is trading at approximately $0.93, having bounced back 22% from its recent low of $0.75.
In light of these developments, traders are exploring several possible scenarios for ADA's price movement:
1. Consolidation Phase
After the initial surge and subsequent correction, ADA may enter a consolidation phase, trading within a range as the market digests the news and assesses its long-term implications. This period of sideways movement could present opportunities for traders to employ range-bound strategies, buying at support levels and selling at resistance.
Pro Tips:
Identify Key Levels: Determine the support levels ($0.75, $0.58 & $0.49) and resistance levels ($0.98, $1.19 & $1.32) to inform entry and exit points.
2. Renewed Bullish Momentum
Should positive sentiment surrounding the Crypto Strategic Reserve persist, ADA could experience renewed buying pressure, leading to a potential breakout above recent highs. This scenario would likely be accompanied by increased trading volumes and heightened investor interest.
Pro Tips:
Breakout Confirmation: Wait for a confirmed breakout above the previous high of $1.19 with substantial volume before entering long positions.
Risk Management: Set stop-loss orders below key support levels to protect against false breakouts.
3. Continued Downward Correction
Conversely, if market sentiment shifts negatively or profit-taking intensifies, ADA could resume its downward trajectory, potentially testing lower support levels. Traders should be cautious of this scenario, especially if accompanied by broader market weakness.
Pro Tips:
Support Monitoring: Keep an eye on critical support levels, such as $0.75, $0.58 & $0.49 to identify potential buying opportunities or to exit existing positions.
Market Correlation: Monitor the performance of major cryptocurrencies like BTC and ETH, as their movements often influence ADA's price action.
Final Thoughts
The recent announcement of the U.S. Crypto Strategic Reserve has injected significant volatility into the cryptocurrency markets, particularly affecting assets like Cardano. Traders should remain vigilant, employing robust risk management strategies and staying informed about broader market trends. By considering the potential scenarios outlined above, traders can better navigate ADA's price movements and capitalize on emerging opportunities.
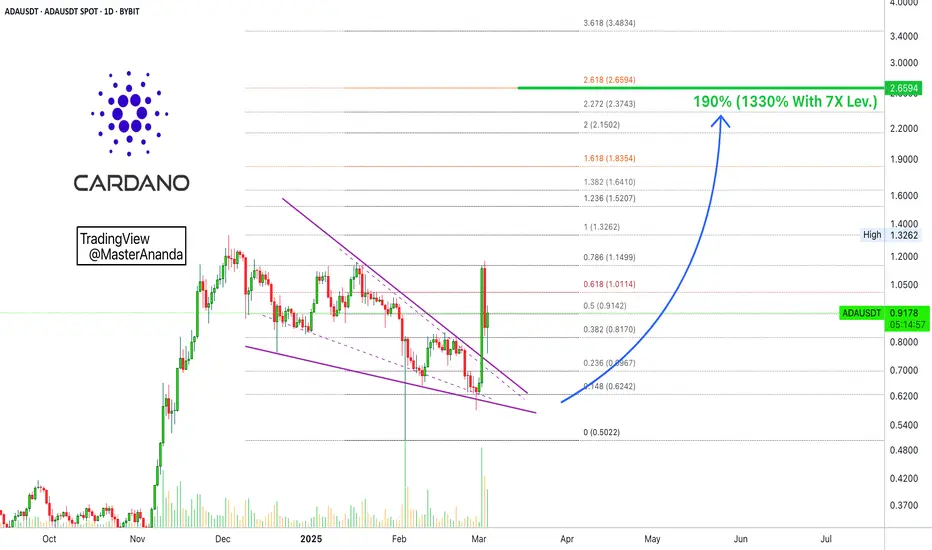
Cardano 7X Trade-Numbers (1330% Potential)I would love to have a better entry here but better late than never. When in doubt, reduce leverage.
The falling wedge pattern here reveals the end of the correction. The bullish breakout reveals the resumption of the bullish move. A bullish move means higher highs and higher lows.
Cardano is set to grow for months and months and months.
We are going up.
You can find the targets for this chart setup listed below:
_____
ADAUSDT LONG 7X (PP: 1330%)
Targets:
TP1: $1.0114
TP2: $1.1499
TP3: $1.3262
TP4: $1.5207
TP5: $1.6410
TP6: $1.8354
TP7: $2.1502
TP8: $2.6594
Adjust all settings to your own liking.
_____
Good luck. Thank you again for your continued support.
Remember, you deserve the best.
The Cryptocurrency market is healthy, new and young.
Crypto is here to stay.
This is only the beginning.
The best is yet to come.
Namaste.