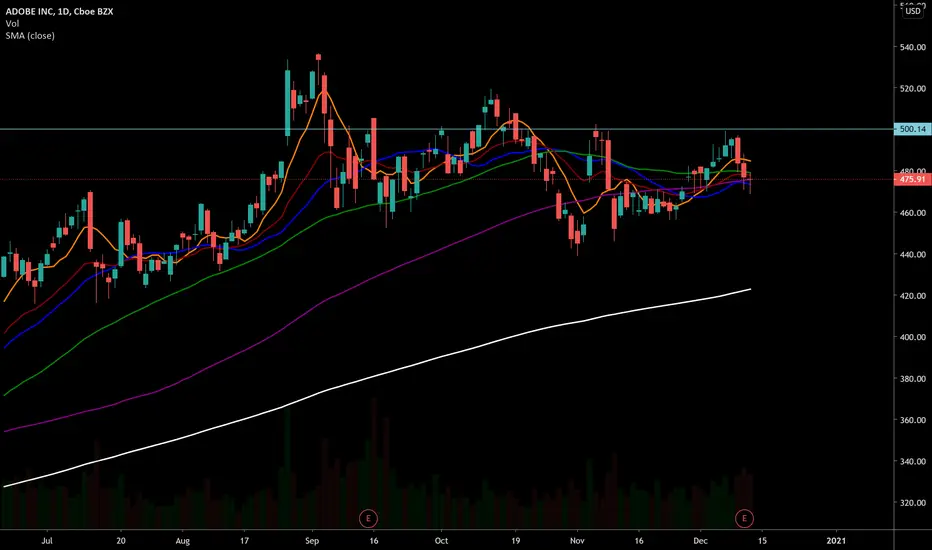
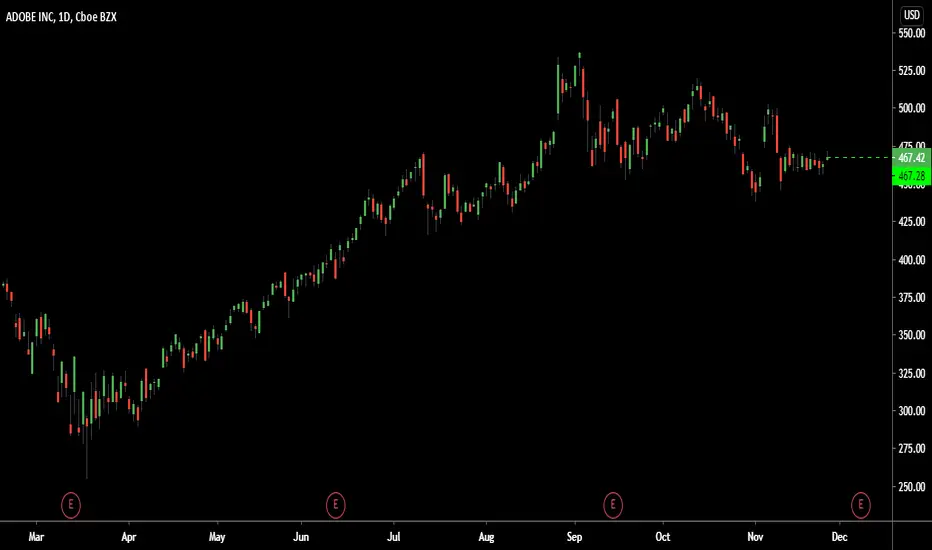
ADBE eyes on 500THis is a great growth name in the tech industry. certainly, one to keep an eye on once we get closer to 500 and some more consolidation.
ADBE
Holding into earnings Even though we were burned on Salesforce we will roll the dice again with holding our ADBE position
Our plan going into earnings next week #stocksWe were burned by Salesforce but were rewarded by Crowdstrike. The Model has us long equities across the board so we are willing to continue to take the earnings risk. ADOBE has been best in breed
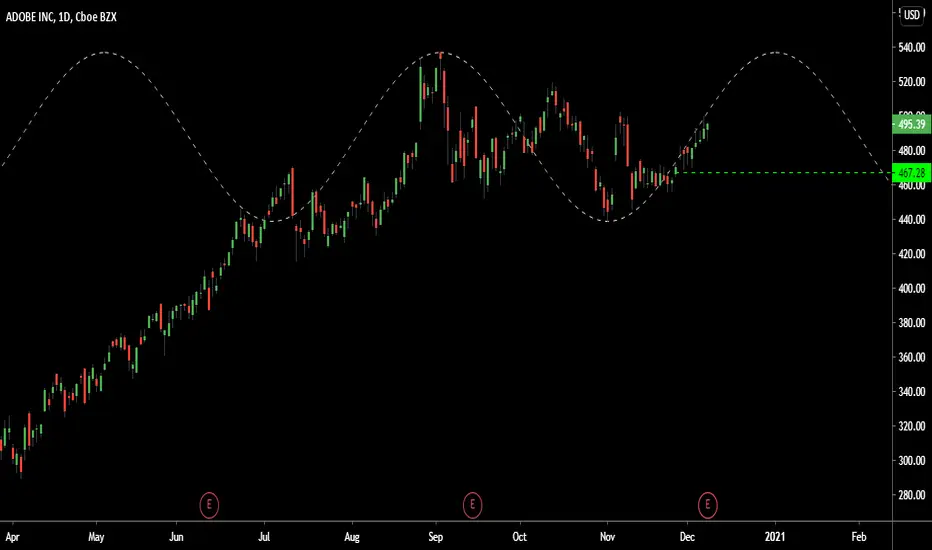
Ingenuity Trading Model is an algorithm used in- Stock, Forex, Futures, and Crypto markets. The model is a Geometric Markov Model :
In probability theory, a Markov model is a stochastic model used to predict randomly changing systems. Markov Models are used in all aspects of life from Google search to daily weather forecast. The randomly changing systems we focus on are the equity, futures, and forex markets. The geometric element of the model is the fractal sine wave structure you can find on any chart you look at across any market and across all time dimensions.
Our model focuses on the current sine wave formation (current state)- geometric price formation along with its volume and volatility over a given time period and using that information to predict the future state- future price movement. For questions or more information feel free to contact me in the comment section or via private chat
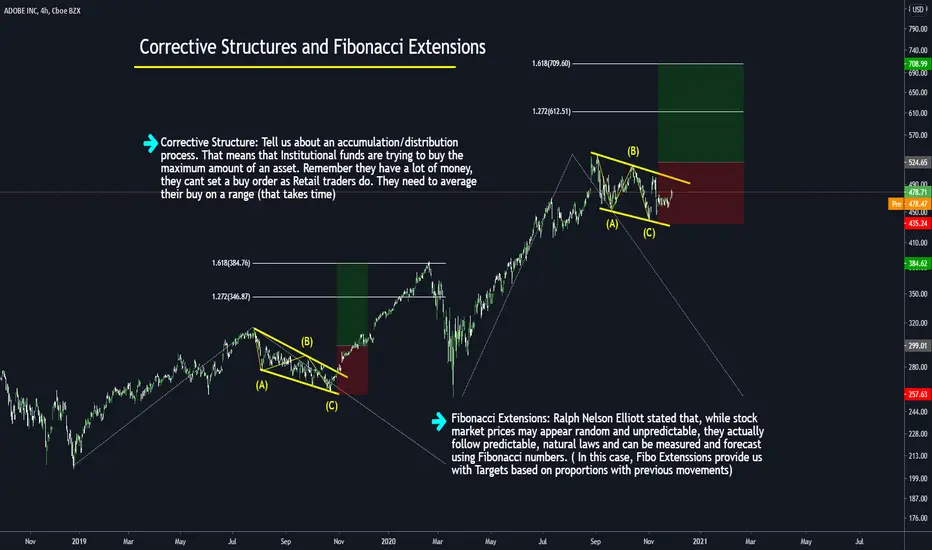
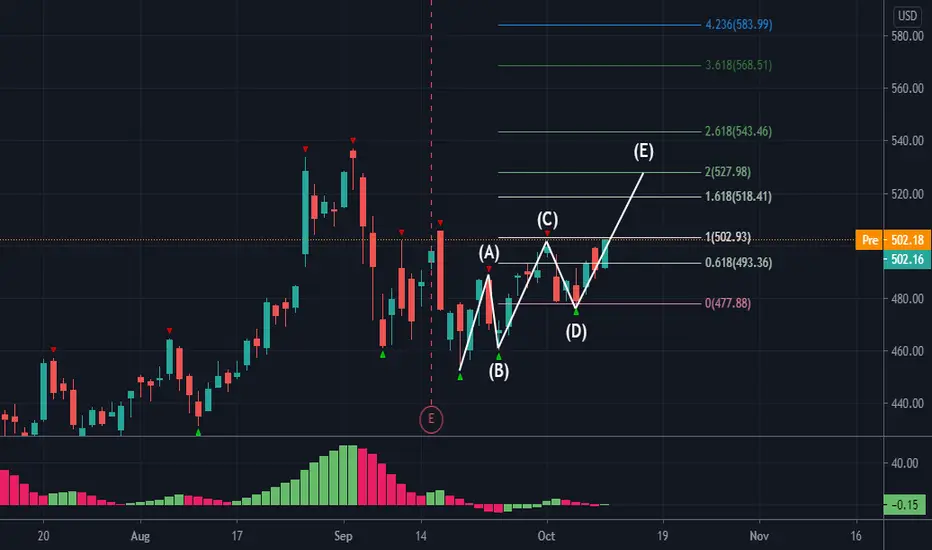
Corrective Structures and Fibonacci ExtensionsHere, we will expand the information about the chart.
Corrective Structure: Tell us about an accumulation/distribution process. That means that Institutional funds are trying to buy the maximum amount of an asset. Remember, they have a lot of money. They cant set a buy order as Retail traders do. They need to average their buy on a range (that takes time). The same applies to the selling process. A key aspect of this process is the idea that when they buy, they will move the price; after that, they need to sell a partial amount of the previous purchase to keep the price in range. When the price falls again, they loop the process again. These actions create corrective structures that retail trades can use to understand that this is happening and simply wait for the breakout.
Fibonacci Extensions: Ralph Nelson Elliott stated that, while stock market prices may appear random and unpredictable, they actually follow predictable, natural laws and can be measured and forecast using Fibonacci numbers. ( In this case, Fibo Extenssions provide us with Targets based on proportions with previous movements) Elliott stated that, while stock market prices may appear random and unpredictable, they actually follow predictable, natural laws and can be measured and forecast using Fibonacci numbers.
We hope the information was useful!

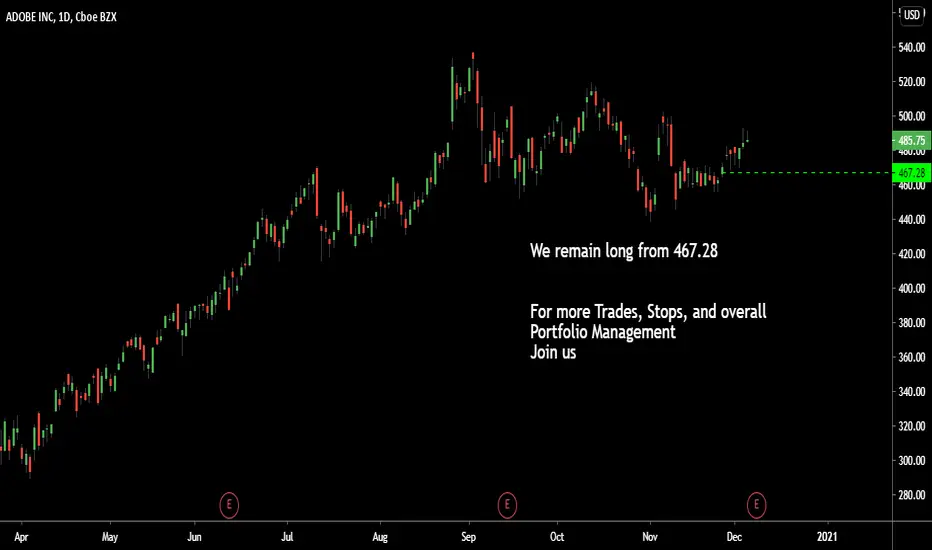
Buy Signal: 467.19Ingenuity Trading Model used in- Stock, Forex, Futures, and Crypto markets
The model is a Geometric Markov Model :
In probability theory, a Markov model is a stochastic model used to predict randomly changing systems. Markov Models are used in all aspects of life from Google search to daily weather forecast. The randomly changing systems we focus on are the equity, futures, and forex markets. The geometric element of the model is the fractal wave structure you can find on any chart you look at across any market and across all time dimensions.
Our model focuses on the current wave formation (current state)- geometric price formation along with its volume and volatility over a given time period and using that information to predict the future state- future price movement. For questions or more information feel free to contact me in the comment section or via private chat
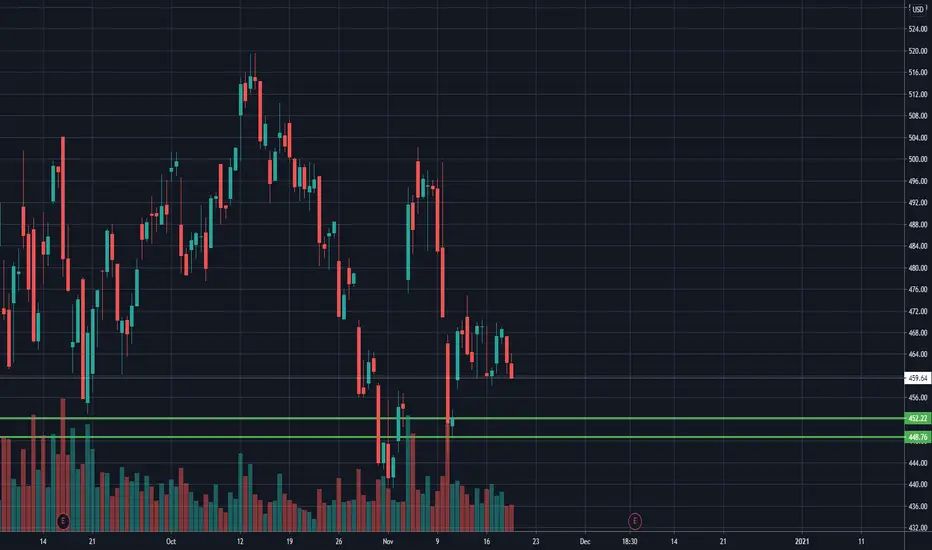
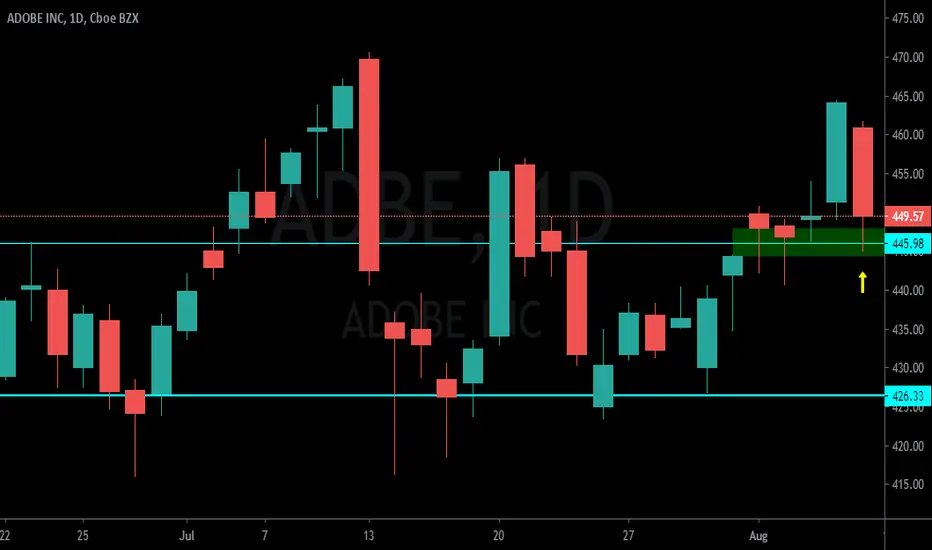
ADBE Long potential on a retest - $ADBE $SPY $QQQ $SKYY $XLK ADBE seems to be consolidating here at the highs. should it come into 448-452 area and hold there it is a decent setup for a swing long for an earnings run up coming in December.
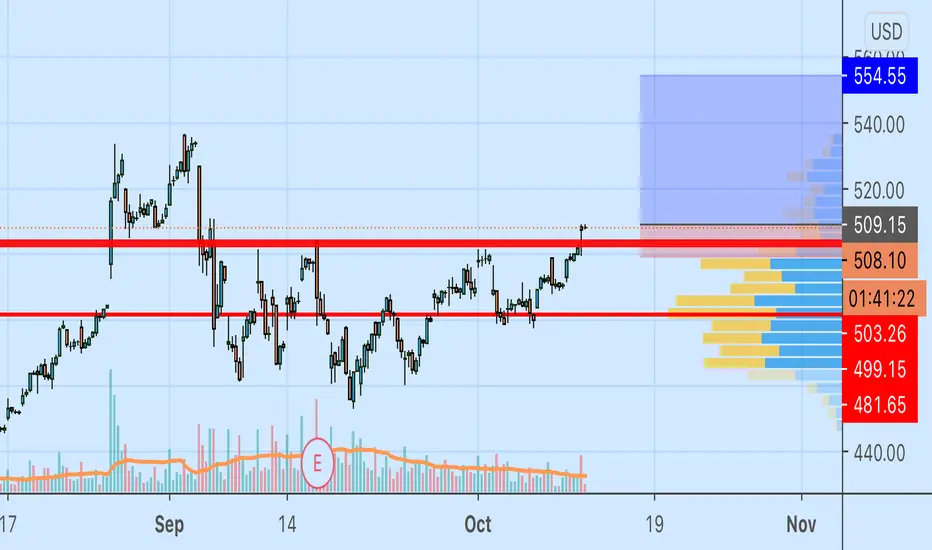
ADOBE INC. LONG📈 NASDAQ:ADBE LONG D1
🛒BUY above = 503
🎯Target1 = 518.40
🎯Target2 = 528
🛑Stop loss or cancel trade = 477.80
🙈Recommended risk = (2%-3%)
It´s never too late to buy $ADBE It´s never too late to buy a stock. No one can determine wether it´s on its cealing or not. Sometimes all you need is historical data and a clear long signal.
It has been now more than 4 years since Adobe´s stock price started to increase at good rithm. For the past weeks it has been quite blurry to determine what could happen.
$ADBE has broken the triangle pattern created since its last highest, upwards. It is above the 50MA, the RSI has been latheralizing while the MACD forrest was negative. But now the MACD is about to turnaround positvely, plus the RSI is above the 50lvl. We can see this as clear long signals on a stock price to which I personally see no roof yet.

$ADBE Adobe Poised for a Run$ADBE Broke out of a falling wedge pattern to the upside today on the daily chart, held the 20d ema line as support and closed above recent highs. Expect to see a strong continuation move in the coming days.
Also of note, we saw some bullish unusual options activity late last week with 5k $420.00 strike (deep ITM) Jan'21 calls traded Friday vs open interest <300 or 19 times OI. These contracts were over $8k each for a total premium outlay of $42.1M - this was likely a large hedge fund trade.
Near term target - $540-$560 range by late October
Note This is NOT investment advice.

ADBE short-term shortADBE created a decending triangle.
Good chance that it will visit horizontal support line @463$ .

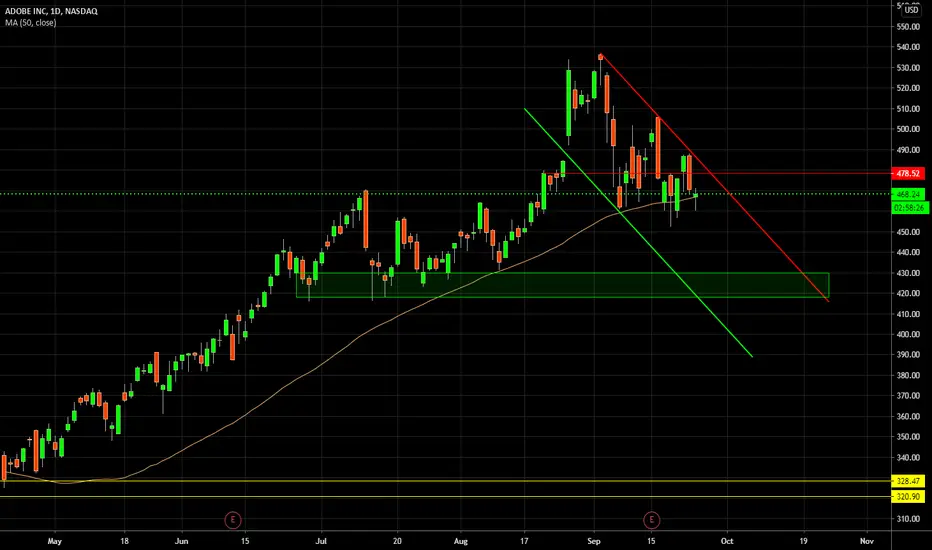
ADBE setting off long term sell signalAdobe had some amazing Q3 results, but it was not enough to stave off the powerful technicals of a waning RSI and a steep upwards trend that was destined to correct. This one looks like its going down to at least $430, but will be a buy between $363 and $396

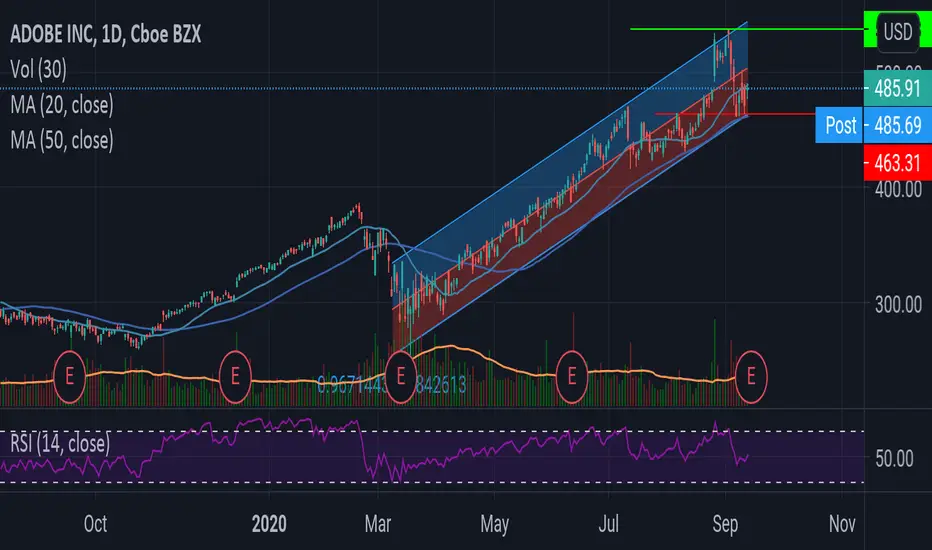
ADBEADBE trading inside an upside channel since March bottom. Have more than 10% potential profit with 5% stop on 460$. 1:2 profit ratio
Reporting tomorrow so extra care should be taken.
Good luck.
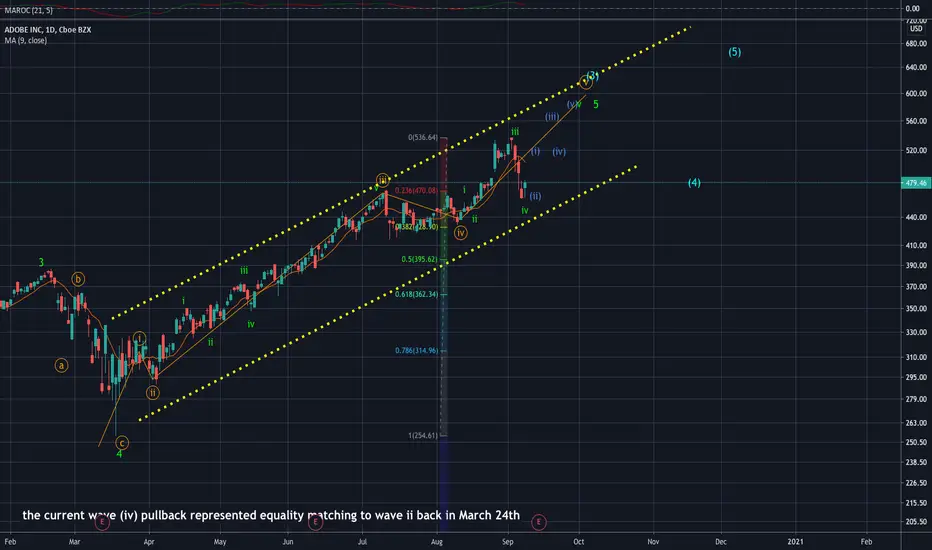
ADBE Wave (5) Bullish On the Daily time frame, ADBE pulling back into wave (4) support level at 460 likely setting up wave (v) rally same degree measured move targeting the 600-610 level. Potential ending diagonal pattern if wave v bullish into 560 upside is complete
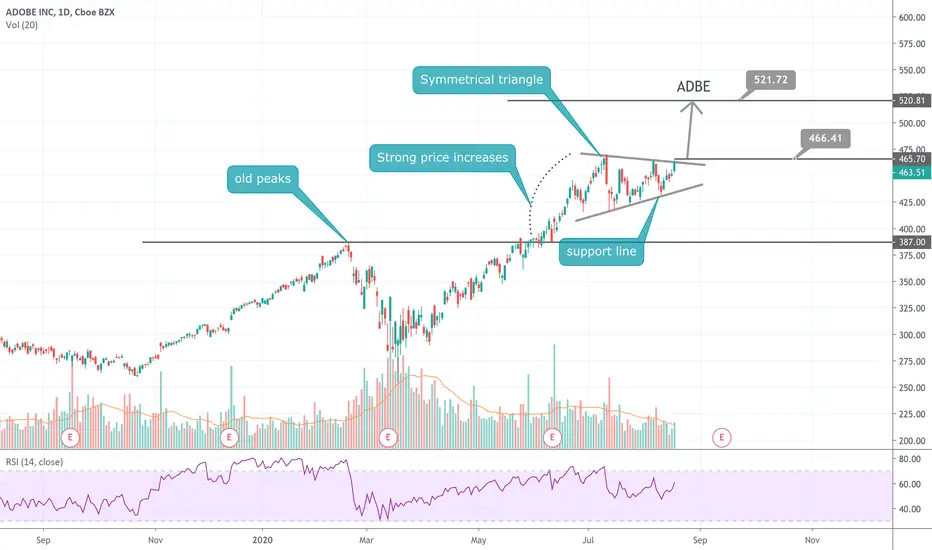
ADBE BUY OR LONG , TARGET UP TO $520+ADBE confirms the Symmetrical triangle pattern today, buy point is activated, I open Long.
ADBE buy : $465
ADBE target : $520+
Stop loss : 6%
Wish you a good deal
ADBE Bullish Trade Setup On the Daily time frame, ADBE consolidation is almost complete setting up for a likely wave (3) rally same degree measured move targeting the 560-599 level. I am interested in setting up medium term long position on ADBE with expiration into Oct-Nov 20’. Trade execution details in video update.

ADBE - Uptrend Corridor (Swing)Bounced off the support line. Opened the opportunity for a range swing trade.


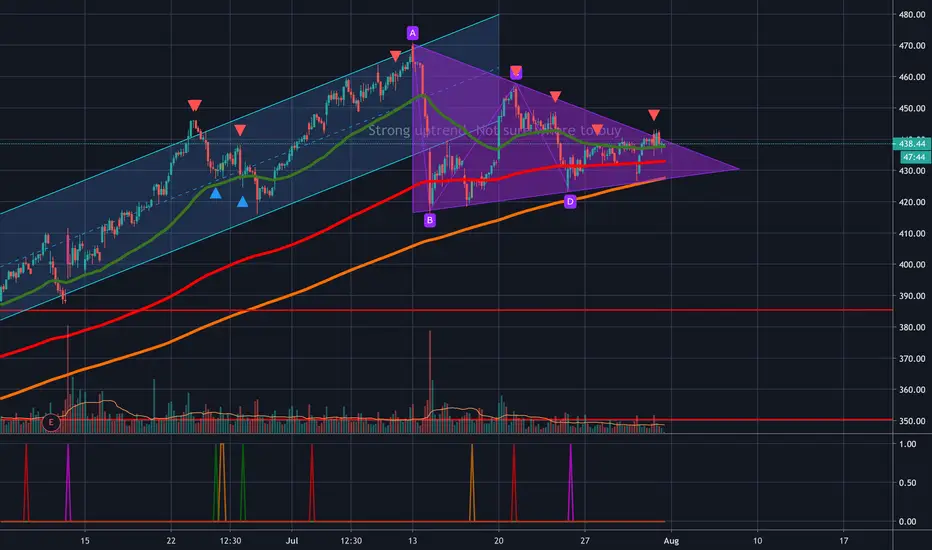
ADBE Triangle pattern. Breakout WatchWith FAANG making big moves, ADBE is stuck in a triangle pattern. My Biased is toward the upside, but will wait for the breakout.
Idea is to Buy ADBE on BreakOut and sell an ITM weekly call.
ADBE ChannelsChannels forming for adobe
A strong uptrend since 87' has formed
Currently it is sitting above the middle of that trendline
Listed buy zones, risk increases any entry earlier than these levels
